VISUALISATION OF COMPLEX 3D CITY MODELS ON MOBILE WEBBROWSERS
USING CLOUD-BASED IMAGE PROVISIONING
M. Christen* a , S. Nebiker a
a
Institute of Geomatics Engineering, FHNW University of Applied Sciences and Arts Northwestern Switzerland - (martin.christen, stephan.nebiker)@fhnw.ch
Commission III, WG 5
KEY WORDS: Big Data, Rendering Geospatial Data, Processing Geospatial Data, Image Based Provisioning, Standards
ABSTRACT:
Rendering large city models with high polygon count and a vast amount of textures at interactive frame rates is a rather difficult to impossible task as it highly depends on the client hardware, which is often insufficient, even if out-of-core rendering techniques and level of detail approaches are used. Rendering complex city models on mobile devices is even more challenging. An approach of maturing of web-based 3D geoinformation services, namely 3D virtual globes. This has also spurred ongoing research both in the automated generation and in the efficient visualisation of very large and increasingly complex 3D city models. Some of the main trends in urban 3D reconstruction include procedural modelling approaches (e.g. Haegler et al., 2009) as well as image-based reconstruction – both from oblique aerial and ground-based imagery (Haala and Kada, 2010; Musialski et al., 2013). Both approaches are used to automatically reconstruct very large urban scenes with huge image textures and increasingly complex geometries and with potentially very large variations in level of detail. Over the last few years a great amount of research has been conducted on efficient web-based 3D graphics in general (Evans et al., 2014) and in web- and cloud-based architectures for large and complex geospatial 3D scenes in particular (Christen et al., 2012 & 2014).
Recently some interesting approaches for rendering massive geospatial datasets on mobile devices have been introduced. Hildebrandt et al. (2011), for example, proposed an architecture for server-side rendering of massive 3D panoramas using cube maps. In their solution the 3D model is preprocessed and provided as a panorama image from the server. Another approach is the provisioning of massive, virtual 3D city models on web browsers, smartphones or tablets assembled from artificial oblique image tiles. It concluded that when using image provisioning techniques, the complexity of the 3D city model data is decoupled from data transfer complexity (Klimke et al., 2014). Also noteworthy is the HuMoRS system (Huge models Mobile Rendering System), where a networked 3D graphics system for interactively streaming and exploring massive 3D mesh models on mobile devices has been proposed (Rodríguez, 2014).
The Open Geospatial Consortium (OGC) and the Web3D Consortium have both been actively addressing the need for interoperability in the field of geospatial 3D visualisation, in particular handling complex datasets, mastering access speed,
and allow a diversity of devices. The Web3D Consortium has focused on open standards for real-time 3D visualization, including streaming. The OGC has focused on developing a service interface to provide interoperable access to 3D geospatial data servers. In 2012, a group of OGC members, building on work done in both organizations, completed the 3D Portrayal Interoperability Experiment to develop and evaluate best practices for 3D portrayal services (Open Geospatial Consortium, 2015). The current state of the portrayal service has been used to implement the proposed 3dmaps.ch framework.
In this paper we first introduce our cloud-based image provisioning approach including the underlying architecture. We then introduce two very demanding use cases with large and complex 3D city models, one of which was created using image-based modelling, the other one using procedural modelling. We subsequently present first results obtained with our cloud-based image provisioning prototype and provide an outlook and conclusion.
2. PROPOSED CLOUD-BASED TILED IMAGE PROVISIONING APPROACH
identification of objects. The fourth image tile type is the Z-buffer tile containing the 32-bit per pixel depth values. With this tile type, it is possible to get the 3D position of every pixel on screen. All tiles are streamed as images in the png format since almost any kind of data can be encoded in and decoded from RGB and RGBA images (Christen, 2005).
2.1 Creating New Scenes
The 3dmaps.ch web application consists of several python scripts, which are handled by a web interface. The web interface uses flask (Flask, 2015; Lerner, 2014) and makes use of MongoDB, an open-source, document database designed for scalability (MongoDB, 2015). The web interface is optional and the scripts can also be called directly.
Scene creation – First, there is the script "createScene.py" which creates a new scene. A scene consists of assets such as 3D geometry, textures, and material definitions. If a 3D format without semantics is used, 3D geometries should be handled as a file per building so an id per Object can be created. In this case the id is simply the filename of the geometry.
Addition of scene contents – New geometry can be added to a scene by uploading the data via the web interface or by calling the script "addFilesToScene.py". If orthophotos are used in combination with elevation data, they must be provided as 3D geometry with textures. A python script to create a 3D model from orthophotos and elevation data has been developed for this purpose. Once the scene is complete it can be optimized by removing duplicate vertices, faces and material definitions.
As the subsequent rendering performance is critical, a spatial data structure is created for acceleration. The bounding volume hierarchy (BVH) is of the most popular spatial data structures (Barringer 2014). The BVH is used for 3D objects, including all buildings and terrain. To support very large 3D cities and to keep the memory footprint low, the BVH is stored as multiple files in the file system. The textures are converted to a format with multiresolution support to reduce time for pixel lookup.
2.2 Rendering Scenes
Once all assets are uploaded to the server so called renderings can be configured. These rendering configurations consist of the 3D tile types to be rendered, the view directions which are used to render the view of the 3D city. The view position can be configured using a pitch angle (Figure 1) and a look-at angle (Figure 2). In Figure 2, we see a look-at angle of 0° looking north and a second view with an angle of 45° looking north-west. The pitch in this example is 22°. There is no limitation as to how many different renderings can be created. A new rendering is defined using the script "createRendering.py".
Figure 1: A scene rendered with a pitch of 10°, 22.5°, and 45°
Figure 2: Using different look-at directions
Perspective image tiles are created in a quadtree structure, as shown in Figure 3. Instead of using a perspective projection for the oblique views, a parallel projection. As a result a uniform level of detail can be used across the entire field of view and that buildings are shown with a uniform scale across the entire screen. An additional advantage of the quadtree structure is that only the lowest pyramid level needs to be rendered and that the remaining levels can be calculated using image processing operations. Thus, the full potential of the acceleration structure is exploited. A simple tiling example is shown in Figure 4.
Figure 3: Quadtree scheme for 3D tiles
Figure 4: 3D tiles of a test scene at zoom level 1
The actual scene rendering is done using ray-tracing, to handle large amounts of textures and polygons in an efficient way. For the time being, an own implementation of a ray-tracer was not a priority, so RenderMan (Renderman 2015) is used for rendering the tiles. However, it would be possible to use other renderers instead or to implement our own rendering solution.
The tiles to be rendered are stored as render-jobs in MongoDB. The rendering can be distributed in the cloud using as many nodes as needed for processing tiles since each node processes a new job retrieved from the database. Once all full-resolution tiles are processed the remaining zoom levels are calculated and stored in the cloud.
2.3 Server Architecture
Figure 5: Client/Server Architecture of 3dmaps.ch
2.4 Viewer API
For displaying the scene in a webbrowser a JavaScript library has been implemented. It is called "map3d.js" and can be used to create custom scenes.
As shown in Listing 1, a new 3D map is created by specifying an id of a canvas element. Then a new layer is created. For the layer the URL(s) to the preprocessed tiles are provided. It is possible (and recommended) to specify many tile servers to speed up downloads, as the number of simultaneous persistent connections per server is limited in Web browsers. The layer is then added to the map. Currently, only a single 3D layer can be added to the map. In future, there will be support of multiple 3D layers, which can be combined using their z-buffers. Finally, we add two markers to the scene. The markers use real 3D positions of the objects. With this, the 3D scene is ready and the result is shown in Figure 6.
var map = new map3d.map("mapcanvas");
var layer = new map3d.imageLayer([
"http://t1.3dmaps.ch/tiles/teatime",
"http://t2.3dmaps.ch/tiles/teatime",
"http://t3.3dmaps.ch/tiles/teatime",
"http://t4.3dmaps.ch/tiles/teatime"]) });
layer.addTo(map);
var teapot_marker = new map3d.marker("Green Teapot", [0,0,0]);
teapot_marker.addTo(map);
var cube_maker = new map3d.marker("Green Cube", [80.5, 11.5, 10.5]);
cube_maker.addTo(map);
Listing 1. Using the viewer API
Figure 6. Scene for Listing 1 with markers using 3D world positions.
The map3d.js library contains an event system supporting custom events such as clicking on an object or building, selecting a marker, and so on. A building can be highlighted according to its id, which is retrieved from the color id tile. The highlighting is then calculated and displayed as shown in Figure 7.
The viewer supports both canvas-only and WebGL-based rendering modes. The WebGL version converts all tiles to textures. Certain operations like highlighting are done completly on the GPU. The texture of the color id tile and the RGB texture are combined in the fragment shader. Also the Z-buffer is written using the WebGL extension "EXT_Frag_Depth", which will also be part of WebGL 2.0. This allows the combination of polygonal 3D objects with the image-based view.
Figure 7. Highlighting objects
3. USE CASES
Currently there is a trend toward publishing textured 3D city models in the CityGML format as open data. These city models can be freely downloaded and usually be used for any purpose. This promotes the development of new algorithms and visualizations with real city data. Today, the list of city models released as open data includes: Lyon (France), Hamburg (Germany), Monréal (Canada), Rotterdam (Netherlands), and Berlin (Germany). For the first use case, we chose the modern city of Rotterdam, representing one of the open datasets. In our second case study, we use a procedural city model of the historic roman city of Augusta Raurica.
3.1 Use Case 1: The Rotterdam Dataset
The city model of Rotterdam is available to the public as CityGML dataset. The dataset consists of:
CityGML is an XML-based format for the storage and exchange of virtual 3D city models. It is therefore not a format optimized for viewing and can't simply be converted to an optimized viewing format. In addition, the dataset consists of texture atlases which are not optimized at all. Optimal results would be achieved if a 3D designer would manually redesign all buildings using 3D modelling software. However, we did not have the resources and the intention of doing so. Instead, we implemented a more general way for converting the models in an automated process. In this process we use all original textures and 3D data. In a first step the data is converted from CityGML to Wavefront OBJ format using FME (Safe Software). In a second step the materials and geometry are optimized using a python script. The script does:
• remove untextured faces, as we only want textured buildings
• remove triangles with double vertices
• optimize materials: use only one material per texture • flip axis and face-orientation so we have a right
handed coordinate system for further processing
The textures themselves are not changed as we did not want to reduce the given image quality. However, the original image quality is quite low as we can see when loading the converted dataset in a viewer such as MeshLab (Figure 8). Some city blocks however were too big to be loaded with all textures.
Figure 8. 3D Visualization of a single district containing 151 textures using MeshLab
In addition to the buildings, we used the orthophoto of Rotterdam, which is also available as open data (Figure 9). The file was downloaded from the Rotterdam open data portal in ECW Format. It has a size of 620'000x 248'696 Pixels. The uncompressed size of the image is around 430 GB. With the Wavelet based ECW compression the file is reduced to 8.4 GB. For the 3D visualization we created 10'000 tiles with a size of 4096x4096 Pixels. This was necessary, since the RenderMan renderer does not support ECW Format natively. The tiling has been implemented using a simple python script. As part of the tiling process, the script also creates a 3D file in the Wavefront OBJ Format, including the materials.
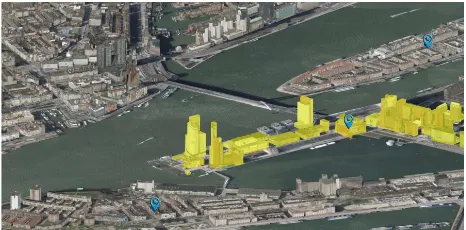
The 3D map of Rotterdam has been processed using 8 zoom levels on a single machine. For the demo a total of 87381 tiles have been preprocessed and stored in the cloud. A visual impression of the Rotterdam scene is shown in Figure 7.
Figure 9. The orthophoto of Rotterdam (RDAM_lufo2014.ecw)
3.2 Use Case 2: The Roman City of Augusta Raurica
The second use case is a digital reconstruction of the historical Roman City of Augusta Raurica, located some 10 kilometres east of today's city of Basel in Switzerland. Augusta Raurica was one of the largest Roman cities north of the Alps with estimated 15'000 inhabitants in the 1st and 2nd century AD. The digital reconstruction of the historical city and its continual evolution is part of a long lasting research cooperation between the archaeological team of Augusta Raurica and the Institute of Geomatics Engineering of the University of Applied Sciences and Arts Northwestern Switzerland (FHNW).
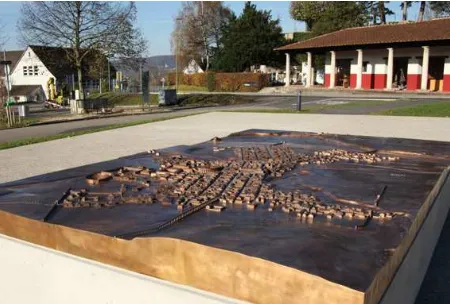
The new digital model of Augusta Raurica is the result of a procedural reconstruction based on an accurate excavation GIS database and on the latest scientific findings by the archaeological team. These findings were translated into rule sets for ESRI's CityEngine, which was subsequently used for generating a multi-resolution digital reconstruction of the entire city. This multi-resolution modelling approach allows the new digital model to be used for a broad range of applications. The model with a lower LOD, for example, was used for creating one of the largest bronze models of a historic city (Figures 10, 11) (Schaub, 2014). The high-resolution model featured in this paper, provides the basis for the upcoming «AR App Augusta Raurica», a location-based visitors guide incorporating state-of-the art augmented reality features. In order to allow for state-of-the interactive exploitation of the large and complex 3D model on a standard mobile device, we used the proposed image provisioning approach.
Figure 11. Detail view of the bronze model of Augusta Raurica
The high-resolution 3D model of Augusta Raurica covers an area of approx. 2 km x 2.5 km and includes over 4000 geospatial objects (such as buildings, roads, vegetation features and the terrain) at three levels of detail. This leads to a geometry dataset of approx. 172 MB and textures in the order of 350 MB (compressed). The rendering is shown in Figures 12 and 13.
Figure 12: Overview of the rendered Augusta Raurica
Figure 13: Detail view of the rendered Augusta Raurica
4. FIRST RESULTS OFFERED BY IMAGE-BASED-PROVISIONING
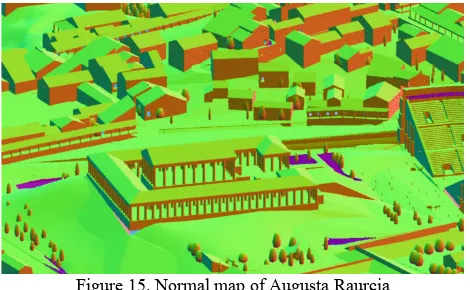
For the Augusta Raurica scene, color map tiles (Figure 14) and normal map tiles (Figure 15) are rendered. These two image types are combined on the fly with a simple lighting equation (Figure 16). The lighting is done using the Lambert's cosine law (Lambert, 1760). First, a light direction l is defined and then the
and b-component of the corresponding pixel from the colormap. This allows for dynamic lighting as the light direction may change over time – for example simulating the sun position. This lighting also works without WebGL, since pixels can also be accessed using the canvas API.
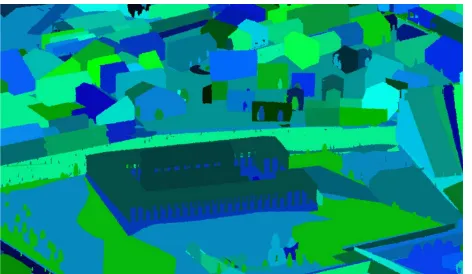
In addition to the color map and normal map tiles a color id map is also generated to allow identification and highlighting of buildings (Figure 17). Every color represents an id, supporting a total of 232 different ids in an 8-bit per channel RGBA image.
Figure 14. Color map of Augusta Raurcia
Figure 15. Normal map of Augusta Raurcia
Figure 17. In the id map every color represents an object id
5. OUTLOOK AND CONCLUSION
In this paper we introduced a cloud-based approach for 3D image provisioning supporting large and complex 3D city models. The 3D map of Rotterdam and the historic roman city of Augusta Raurica. The city model of Rotterdam has been created from a very large CityGML model with textures and Augusta Raurica has been generated in CityEngine using a procedural modeling approach. The Augusta Raurica case showed that screen space rendering techniques can be used on visualisation of different types of city models.
In future, more lighting models will be implemented, such as screen-space ambient occlusion (Kajalin, 2009). In that case the depth map would be used to retrieve the object positions. Another planned feature will be the support of multiple layers. Layers will be combined by using the depth maps of each layer in order to determine which pixel is in front and which in the back. This will also allow to combine scenes with point clouds, as proposed by Nebiker et al., 2010.
Once the OGC 3D Portrayal specification is finalized the 3dmaps.ch server will be adapted to ensure full compatibility.
REFERENCES
Barringer R. and Akenine-Möller T., 2014. Dynamic ray stream traversal. ACM Trans. Graph. 33, 4, Article 151 (July 2014), 9 pages.
Christen M., 2005. Implementing Ray Tracing on the GPU. In Wolfgang Engel, editor, ShaderX4 - Advanced Rendering Techniques, pages 413–424. Charles River Media
Christen, M., Nebiker, S. and Loesch, B., 2012. Web-Based Large-Scale 3D-Geovisualisation Using WebGL. International Journal of 3-D Information Modeling, 1(3), pp.16–25.
Christen M., Hürbi K., Nebiker S., 2014. OpenWebGlobe: 3D-Visualisierung und Caching von globalen Stadtmodellen aus OpenStreetMap mittels Cloud-basiertem Framework, DGPF Tagungsband 2014, Hamburg building reconstruction. ISPRS Journal of Photogrammetry and Remote Sensing, 65(6), pp.570–580.
Haegler, S., Müller, P. & Van Gool, L., 2009. Procedural Modeling for Digital Cultural Heritage. EURASIP Journal on Image and Video Processing, 2009(852392), pp.1–11.
Hildebrandt D., Klimke J., Hagedorn B., and Döllner J., 2011. Service-oriented interactive 3D visualization of massive 3D city models on thin clients. In Proceedings of the 2nd International Conference on Computing for Geospatial Research & Applications (COM.Geo '11). ACM, New York, NY, USA
Kajalin V., 2009. Screen-Space Ambient Occlusion. In Wolfgang Engel, editor, ShaderX7 - Advanced Rendering Techniques, pages 413–424. Charles River Media
Klimke J., Hagedorn B., and Döllner J., 2014. Scalable Multi-Platform Distribution of Spatial 3D Contents. Int. J. 3D Inf. Model. 3, 3 (July 2014), 35-49.
Lambert, J. H., 1760. Photometria, sive de Mensura et Gradibus Luminis, Colorum et Umbrae, Augsburg.
Lerner M.R., 2014. At the forge: flask. July 2014 Issue of Linux Journal, Belltown Media, Houston, TX.
MongoDB, 2015. The MongoDB 3.0 Manual, available online http://docs.mongodb.org/manual/, accessed April 20, 2015.
Musialski, P. et al., 2013. A survey of urban reconstruction. Computer Graphics Forum, 32(6), pp.146–177.
Nebiker S., Bleisch S., Christen M., 2010. Rich point clouds in virtual globes – A new paradigm in city modeling?, Computers, Environment and Urban Systems, Volume 34, Issue 6,
Renderman, 2015. Pixar Renderman Pro Server, available online http://renderman.pixar.com, accessed April 20, 2015.
Rodríguez M. B., Agus M., Marton F., and Gobbetti E., 2014. HuMoRS: huge models mobile rendering system. In Proceedings of the Nineteenth International ACM Conference on 3D Web Technologies (Web3D '14). ACM, New York, NY, USA.
Saito T. and Takahashi T., 1990. Comprehensible rendering of 3-D shapes. In Proceedings of the 17th annual conference on Computer graphics and interactive techniques (SIGGRAPH '90). ACM, New York, NY, USA, 197-206.