REAL TIME LOCALIZATION OF ASSETS IN HOSPITALS
USING QUUPPA INDOOR POSITIONING TECHNOLOGY
M.F.S. van der Ham, MSc a, dr. S. Zlatanova b, ir. E. Verbree c *, ir. R. Voûte d
a Delft University of Technology, Faculty of Architecture and the Built Environment, MSc Geomatics, Julianalaan 134, 2628 BL, Delft, The Netherlands, [email protected]
b Delft University of Technology, Faculty of Architecture and the Built Environment, Department of Urbanism, 3D Geoinformation,
Julianalaan 134, 2628 BL, Delft, The Netherlands, [email protected] c Delft University of Technology, Faculty of Architecture and the Built Environment,
OTB - Research Institute for the Built Environment, GIS Technology, Julianalaan 134, 2628 BL, Delft, The Netherlands, [email protected]
d CGI Nederland BV,
Meander 901, P.O. Box 7015, 6801 HA Arnhem, The Netherlands, [email protected]
KEY WORDS: smart buildings, indoor localization, positioning, BLE, space subdivision, asset management
ABSTRACT:
At the most fundamental level, smart buildings deliver useful building services that make occupants productive. Smart asset management in hostipals starts with knowing the whereabouts of medical equipment. This paper investigates the subject of indoor localization of medical equipment in hospitals by defining functional spaces. In order to localize the assets indoors, a localization method is developed that takes into account several factors such as geometrical influences, characteristics of the Quuppa positioning system and obstructions in the indoor environment. For matching the position data to a real world location, several location types are developed by subdividing the floor plan into location clusters. The research has shown that a high-performance level can be achieved for locations that are within the high-resolution range of the receiver. The performance at the smallest subspaces can only be achieved when having a dense distribution of receivers. Test cases that were defined for specific situations in the test-area show successful localization in these subspaces for the majority of the test data.
1. INTRODUCTION
Indoor positioning and mapping has been a topic of research for more of thirty years, but still many challenges exist in acquisition and sensors, data structures and modelling, visualisation, navigation applications, legal issues and standards (Zlatanova et al 2013). Among them indoor modelling and positioning in public areas is one of the most discussed and investigated topics (Kolodziej and Hjelm 2006, Stook and Verbree 2012). The positioning is predominantly seen with respect to locating people in inner spaces for the purpose of tracking or navigation. To provide appropriate models for navigation, much research has been also performed on appropriate spatial models (Becker at al 2009, Worboys, 2011). The models are adapted to the profile of the user and type of the environment. A large number of approaches for space subdivision are currently investigated (Afyouni et al, 2012, Brown et al 2013). However, the research on tracking of assets is still fragmented and vendor-based.
In this paper, we present an approach for tracking of hospital assets. The main goal of this research was to develop a working model for an indoor positioning system for a hospital. Localizing assets in a hospital is critical because loss and theft of (usually expensive) equipment takes a large amount of the hospital’s budget. If the position of the piece of equipment is available in real time, a system could be developed that localizes the assets through the hospital building. The indoor positioning technology developed by the Finnish company Quuppa forms the basis for the developments in this paper (Quuppa, 2016).
* Corresponding author
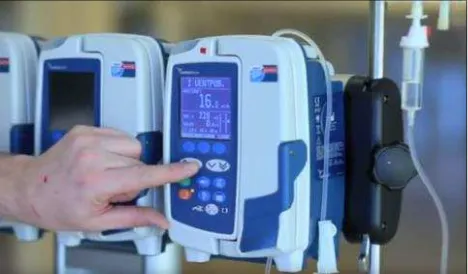
The Rijnstate hospital, Arnhem was the main end user for this research and developments. Several meetings with the hospital management were organised to investigate issues the hospital staff is struggling with during their daily routine. Based on these discussions, a test set up was defined, which was used to investigated the localisation. In consultation with the hospital management, a special type of infusion pumps (Figure 1Fout! Verwijzingsbron niet gevonden.) were selected to describe the routine and bottlenecks within the use case.
Figure 1: Infusion pump that is used in Rijnstate hospital (Carefusion, 2016)
registered in the asset management system. When the pump is shipped to the department that made the request, the ID of the pump is assigned to that specific department.
The area in a room, where the object of interest is located, is called the Area of Interest (AoI) in this paper. The AoI for the use case is the Acute Medical Assessment Unit (Dutch: Acute Opname Afdeling (AOA)), which is a nursing ward distributed over three wings at the fourth floor of the building. The following situations can occur regarding transport and use of the infusion pumps. An infusion pump is requested but none are available at the central supply. Another situation occurs when a pump is taken from another department and not returned afterwards. In both situations the issue is that there are no pumps available at the ward or at the supply room. The supplier needs to have information about the location of the used pumps in order to clean them and make them available for re-use. Implementing an indoor localization system for finding assets such as infusion pumps can save money for hospitals to manage their assets. The costs to set up a system as the one proposed in this paper outweighs the money spend on redundant equipment to balance the stock. This system can also be used to increase compliancy standards for staff and patients and safety in general.
This remainder of this paper is organised as follows. Section 2 provide background information and related work on used technology, methodology, and models. Section 3 presents the concept of spatial subdivision of the space for the purpose of the localisation of the assets. Section 4 discusses the setup up for the tests. The tests are completed in a building, which did not belong to the hospital. Section 5 analyses different localisation cases and analyses them in the context of the hospital. The last section positioning, other wireless technologies like Bluetooth (BT), RFID and WiFi come to mind that return a higher accuracy for indoor localization (Kolodziej and Hjelm 2006). A lot of buildings have a WiFi system installed that has good coverage of the areas where people are most of the time (Verbree et al 2013, Liu at al 2015). Therefore, most of the approaches used so far for tracking of people in public buildings are WiFi-based. However, it is possible to set up comparable networks using other technologies like Bluetooth (BT) or Bluetooth low energy (BLE) (Mautz, 2012). BLE Angle-of-Arrival signal processing technology is the basis of the Quuppa Real-Time Locating System (RTLS) used in this research (Quuppa, 2016).
2.1 Positioning versus localization
The positioning system can return the x and y coordinates in 2D, and x, y and z coordinates in 3D, of the position of an asset or person in a coordinate system. However, without any information about the environment, the position is useless for systems and human beings to understand. Mautz defines positioning, as:
“Positioning is the general term for determination of a position of an object or a person”. It is particularly used to emphasize that
the target object has been moved to a new location”. Adding semantics to the position of the object to be able to pin point it at
a specific place and exclude all other places, is called
localization. Localization can also be defined as: “…localization
is mainly associated with rough estimation of location” (Mautz, 2012). Both these terms are relevant within this research and form the basic structure of the methodology for testing. Examples of semantics used in this paper are real world object names based on e.g. length, height, size, shape and other properties for identification of a location. The locations are for example hallway, patient- and storage room or subparts of these spaces.
2.2 Space subdivision
Another important aspect of the localisation is the spatial model and the granularity of the indoor space. After discussions with the hospital management, we have concluded that a 2D approach is sufficient. For 2D subdivision, three approaches can be distinguished. 2D floor plans of the indoor area can be used when there is a clear and unambiguous lay out of the space, which can be identified using semantics. A second approach is to use a dedicated subdivision method by dividing the space into convex polygons, for example Delaunay triangulation (Mortari et al 2014). A third approach is using a regular subdivision. To the grid or triangle shaped network cells the information and semantics of the underlying 2D objects are assigned for identification of the location. Based on (x,y,z) position information a 3D space subdivision method can be used. In this research (x,y) position data was used which puts limitations on the possibilities for 3D space subdivision for indoor localization (Zlatanova et al., 2014).
But we still need to subdivide the space into smaller sub-spaces, indicating more accurately where an asset can be. In this respect,
we consider space can be defined as an “empty area bounded in some ways”. Indoor subspace is then “a subdivision of indoor
space into smaller parts, which might be partially or completely
bordered by virtual or concrete boundaries” (Zlatanova et al.,
2014). Examples of bounding elements in indoor space are discussed below.
For indoor localization a number of characteristics can be described which influence the method for division of the space. Compared to outdoors, the composition of objects and construction elements indoors causes a more difficult overview of the entire environment. Indoor space consists of more small-scale objects, such as furniture, columns and podiums (Kruminaite, 2014). Related to indoor navigation also the speed of movement is lower, which affect the perception of space. With respect to the relations between semantic locations the number of possibilities to go from position A to B is larger compared to outdoors (Zlatanova et al., 2014)
In order to perform localization indoors, a rich model is required for representation of enclosed spaces. The identification of the space can be based on semantics and information related to the geometry of the space (Afyouni et al, 2012, Brown et al 2013, Zlatanova et al. 2014). Typically, the type of building (e.g. airport, hospital, university, shopping mall, train station) determines the lay out of the floor plan and the arrangement of interior elements. However, the elements describing the boundaries of (sub)locations share common attributes such as height, surface area and materials (Kruminaite, 2014).
between spaces, e.g. stairs, door, elevator, instead of the space itself in the case of localizing (Kruminaite, 2014).
3. DIVISION OF THE FLOOR PLAN
3.1 Simulation of hospital case in test area
For the experiments a test building was selected, which already had the Quuppa system installed. The building has three zones, which are called Theatre, Business- and Play zone. The dimension of the zones is comparable to that of rooms and closed spaces in a hospital. The ceiling height corresponds to the height of a regular office building, which is approximately 3m. As the testing could not be done in the hospital itself, the data from the test area and test setup have been used for the analyses. For the use case it is important to have similar data compared to when the testing would have been carried out in the hospital. For this reason, a simulation of the routine of the assets described in the use case was performed in the test area. A number of test cases are defined to use the position data collected in the test area, as input to measure the performance of localization in the hospital.
Figure 2: Impressions of different areas in the test facility: Play Zone (left), Business Zone (middle) and Theatre (right)
For every test case the performance of the measurements is calculated and localization is performed. One of four scenarios based on the accuracy and precision of the measurements is selected for each of the six test cases. The performance of the location is indicated by the amount of measurements that are located correctly based on the situation described in the test case. Localization of a position measurement can either be correct or incorrect. For correct localization of the points that would be wrongly assigned to a location, the performance value can be used. Based on the performance, a model for correcting the coordinates of the point measurement is described.
Figure 3: Range of the individual receivers on the floor, based on the conical angle
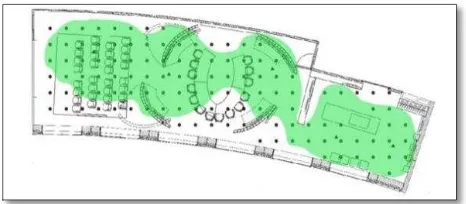
The theoretical range of the receivers is based on the installation height and the conical angle of the antenna of the receivers. In Figure 3 is shown to what extent the theoretical range covers the floor plan. In this situation the influences from the environment on the coverage are not taken into account. In Figure 4 the area of the floor plan covered by the receivers is shown in green where the performance of the system is expected to be according to the requirements of the use case.
Figure 4: Tags in the green area are expected to return the positions with acceptable performance
3.2 Types for subdivision
In the business zone, two ellipse shaped areas are defined for testing the zone type. The inner zone is situated around the U-shaped table and the outer zone covers the rest of the area where people walk and stand in front of the demo systems.
Figure 5: Subdivision types for localization on the floor plan: zone-type (left), functional- type (right)
The functional type is tested in the Play zone by localizing the transmitter in the area around each separate desktop that is situated there. The desktops arranged along the wall are representative for the use case of the infusion pumps as they are
placed next to the patient’s bed close to the wall of the room.
4. TEST SETUP
4.1 Test requirements
Table 1: Input from requirements of the hospital use case for definition of the test cases
These requirements are used to define case specific tests using (parts of) the position data. For the test setup the characteristics of an infusion pump are used as input, which is shown in Table 1. An infusion pump remains in the same place, e.g. storage room
and patient’s room, most of the time and is fixed to an infusion pump stand or a patient’s bed. This implies that, during
measuring of the positions, the transmitters can remain in the same place (static) instead of being moved across the room (dynamic). Based on the information about the routine and characteristics of the infusion pumps, a number of test cases are defined.
4.2 Description of the test cases
For asset management in hospitals the location is only needed when the object is static or has been moved. Knowing the location of a moving object is of less importance because it covers only a small part of the time. The locations for the test case are a cupboard, used for localization around the border of a room. A table, for localizing smaller objects such as medication. And open space, to measure the localization of large movable objects, e.g. beds, and people. In consultation with the hospital management, the characteristics of the infusion pumps are used as input for further testing and analyses.
Six cases are defined based on possible locations of the infusion pumps. For the Rijnstate hospital those locations are the storage
room, from where the pumps are distributed and the patient’s
rooms on the wards. The dashed areas I to VI describe a specific subset of the data that complies with the requirements the horizontal and vertical direction of the matrix. The size and shape of these two rooms correspond to part A and B in the test area. These areas are best covered by the Quuppa system. The Play Zone (A) is used to simulate the storage room. The area of interest is situated along the borders of the room, which makes it possible to simulate the storage of infusion pumps in the cupboards. The Business Zone (B) is used as the test area for the patient’s room.
The area size corresponds to a single patient’s room in the
hospital.
Specific locations in the environment are used for defining the test cases based on the characteristics of the object to be
localized. According to Afyouni the “context varies according to
application constraints, taking into account (…) the interfaces to
interact with" (Afyouni et al., 2012). For each of the standard locations of the infusion pumps, i.e. the storage room and a
patient’s room, three test areas are defined. These three test areas have different characteristics and cover different parts of the floor plan of both rooms. The first category is represented by a cupboard. This object is generally placed against a wall, which corresponds with localization of a transmitter at the borders of a room. The second category is localization on a table. This represents all situations across the floor plan where the transmitter is situated on an object with a Z value larger than 0. The third category covers all other situations where a transmitter is located in open space. Open space can be defined as the part of the floor plan where no obstacles are placed and objects and people can move around freely.
5. ANALYSIS OF THE TEST CASES
Below, the six test cases for localization of infusion pumps in the hospital are described and analysed. For each test case a sub dataset is selected from the test data. The locations for the storage room are selected in the Play Zone in the test area. The locations
for the patient’s room are selected in the Business Zone. Based on the selected type for subdivision, i.e. function, the performance of the system can be represented by the points that are located inside the dedicated polygon and outside this polygon. In Figure 6 the results are shown for the table and its surroundings in the Business Zone.
Figure 6: Correctly and incorrectly assigned points with respect to the dedicated polygon. On the table (left) and around the table (right).
I II III
IV V VI
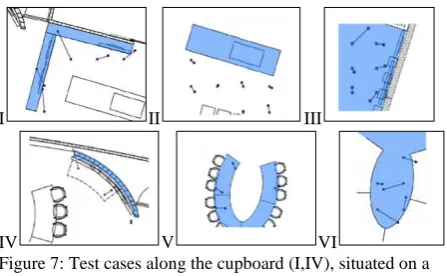
Figure 7: Test cases along the cupboard (I,IV), situated on a table (II,V) and the test cases for the walking area (III,VI).
Due to the orientation of the furniture and the distribution of the grid points representative subsets are selected close to the defined test area for test cases I, II and IV. For every test case the accuracy and precision of the position measurements of the subset are used to select one of the performance scenarios. For every test case, the performance values of that specific location were taken into account. The result of the test cases are shown in Figure 7 I-VI.
5.1 Distribution/storage room
I: Cupboard along the wall
The first test case is situated in the upper left corner of the Play Zone. The grid points are shown in green and the position measurements in purple. The accuracy values are above the threshold for 80% of the points. The SD values, on the other hand, are above the threshold for 20% of the points. The performance scenario for this subset is 3, which means low accuracy, high precision. This result indicates that localization at the borders of a room is unreliable because the distance to the receivers is larger and a bad intersection can occur due to the position of the points with respect to the receivers.
II: Table in the storage room Size [m] Height [m] Location Velocity [km/h]
Cupboard Table Open space
Assets Beds 2 0,8 no no yes 0
IV pumps 0,2 1,5 yes yes yes 0
Medication 0,1 NA yes yes no 0
People Patients 0,5 1,2 no no yes < 5
The second test case focusses on localization on a table in the storage room. Since there are no grid points measured on the table in the middle of the Play Zone, six points in the area next to it are selected. In Figure 7-II these points are shown. This area is still located in between receiver 1 and 2, which should give the same characteristics for coverage of the grid points. For both the accuracy and the precision of the measurements, the values are below the threshold. For this test case scenario 1 is selected. Compared to the first test case, the performance of these measurements is significantly higher. Around the boundaries of the table there is a chance of wrong localization, especially because of the lower accuracy values. For these values a shift towards the inside of the polygon, in this case the table, should resolve this issue.
III: Walking space around table
The third test case covers (a part of) the open floor space. In Figure 7-III the six data points representing the open space are shown. The accuracy and precision of the points corresponds with what could be expected from a location in the high resolution range. The point in the upper left corner makes an exception as the accuracy is low compared to the other points. In the middle of an open space this error is of less influence to the localization of the transmitter. Based on these findings, scenario 1 is selected for localization in the open space area. For lower
The fourth test case is situated in a patient’s room on one of the
hospital wards. The sub dataset for this case is taken around one of the four curved walls as they have a similar location to the
cupboards in a patient’s room, i.e. in the corners of the room.
Also medical equipment, such as infusion pump stands and hart monitors are situated next to a patient’s bed. Possible reflection from the equipment is taken into account in the test case. In Figure 7-IV the three points selected for this test case are shown. The values for the precision show acceptable results for all three points. The accuracy values show significant deviation from the real value. However, these values are still within the threshold range, which implies a performance scenario of 1.
The cause for the relatively large errors can be attributed to
multipath caused by reflection of the wall’s material (metal) and
reflection of the TV screens. Compared to the results from test case I, these points return better values for positioning at the border of a room. The main reason for this is better coverage of the receiver, as the distance to the closest locater is much shorter. In both cases the error is pointing towards the border of the room. For localization in a cupboard, the relatively large accuracy errors should not cause the system to return a wrong location. The tracking area, implemented in the Quuppa system, and the wall separating the rooms prevent the transmitter to be located on another location or in another room.
V: Patient’s bed
The fifth test case is situated on the U-shaped table in the middle of the Business Zone. The location in the room is representative
for a patient’s bed in a single patient nursing room. For this test
case, four point measurements are selected for grid points located on the table. The measurements and grid points are shown in Figure 7-V. All measurements show a clear deviation with respect to the grid point. In this specific case all transmitters are localized correctly, i.e. on the table. The other three points on the
left side are located towards the centre of the table and are localized correctly despite of the relatively low accuracy values. In the case of wrong localization due to low accuracy of the measurements, a functional restraint can be added.
VI: Walking space around bed
For the sixth test case, five points are selected in the open space area enclosed by the U-shaped table. The accuracy for these points is below the threshold limit for all points except for one. However, the values are relatively high and cause wrong localizations for two other point measurements. The precision is above the threshold for three of the points. Based on these values, scenario 2 is selected for this test case. Remarkably, the points with low accuracy give good results for the precision and vice versa. This means that the signal is not distorted by obstructions or other environmental influences.
This specific location is situated in between two receivers which causes the performance of the position measurements to be lower compared to other high-resolution areas. Two points are located on the table, where they actually are in the open space in the middle of the table. This error can be corrected by adding functional restraints. As these points are located in the border zone of the table polygon, they are assigned to a lower performance category for being localized on the table.
The performance of localization of the test data based on the performance is shown in Figure 7-VI for each test case. Localization along a wall is difficult due to the relatively large distance of the transmitter to the receiver, assuming that the receiver is in the middle of the room. In the case of localizing in the open space in the middle of the table the average accuracy value exceeds the threshold. This dataset was taken from a location in between two receivers where the performance of the measurements is lower due to the geometry of the combined measurements.
6. CONCLUSIONS & DISCUSSION
Based on the test cases the positioning system shows good results for localization as in four out of six cases the points were correctly localized. In two cases the value for the accuracy returned a result below the threshold value. Based on the outcome of the analysis for positioning and the test cases the accuracy of the measurements can be regarded as the main indication for the performance. Errors in the accuracy value inevitably result in errors in localization.
The main difference in the characteristics of people and assets is that assets tend to stay in the same place for a longer amount of time without moving. In addition to this, people generally do not appear in objects used for storage in contrast to the assets discussed in this paper. This puts the focus for localization of assets on returning a reliable position for static objects. Based on the comparison of the accuracy and the precision (standard deviation) of the data from different time spans, a relatively low update rate up to 5 Hz is sufficient for getting reliable position estimates. Storage furniture is generally located along the wall of a room which moves the area of interest from the middle (where people are) to the sides where the cupboards are.
to 10cm can be achieved for the high-resolution range of the positioning system. The results for the zone type show a significant improvement in localization for the inner area, which is in accordance with the other findings with respect to the performance and coverage. For the function type the localization success rate is only 70% which is influenced by the low amount of points taken into account. Although this is the best covered part of the test area, the performance of the localization is influenced by reflection from the computer screens. Localizing at the chosen accuracy level of 0.5m should be achievable in a similar situation.
REFERENCES
Afyouni, I., Cyril, R., & Christophe, C. 2012. Spatial models for context-aware indoor navigation systems: A survey. Journal of Spatial Information Science,1(4), 85-123.
Becker, T., Nagel, C., and Kolbe, T. H.2009. A multi-layered space-event model for navigation in indoor spaces. In 3D Geo-Information Sciences. Springer Berlin Heidelberg, 61-77.
Brown, G., C. Nagel, S. Zlatanova and T.H. Kolbe, 2013, Modelling 3D Topographic Space Against Indoor Navigation Requirements, Progress and New Trends in 3D Geoinformation Science, LNG&C, Springer, Heidelberg, New York, Dordrecht, London, pp. 1-22.
Carefusion, 2016. Alaris GP volumetric pump manual.
http://www.carefusion-products.com/assets/supportdocs/DFUs/1000DF00546.pdf, last accessed: February 2016.
Kolodziej, K. W., and J. Hjelm, 2006. Local Positioning Systems: LBS Applications and Services, CRC press, Taylor & Francis. Kruminaite, M. 2014. Space Subdivision for Indoor Navigation, MSc thesis, TU Delft, Delft University of Technology, http://repository.tudelft.nl/view/ir/uuid%3Ac2a9a308-5cdc-4df2-bf30-9eea5ea176c5/, last accessed: May 2016
Mautz, R. 2012. Indoor positioning technologies (Doctoral dissertation, Habilitationsschrift ETH Zürich, 2012.
Mortari, F., S. Zlatanova, L. Liu, and E. Clementini, 2014. Improved Geometric Network Model" (IGNM): a novel approach for deriving Connectivity Graphs for Indoor Navigation, ISPRS Ann. Photogramm. Remote Sens. Spatial Inf. Sci, Vol. II-4, pp. 45–51.
Liu, L., W. Xu, W. Penard, and S. Zlatanova 2015. Leveraging spatial model to improve indoor tracking, ISPRS Arch. Photogramm. Remote Sens. Spatial Inf. Sci, XL-4/W5, pp. 75–80. Quuppa Intelligent Locating System, 2016, http://quuppa.com/, last accessed: May 2016.
Stook, J and Verbree, 2012. Localization with Wi-Fi Fingerprinting: towards Indoor Navigation on Smartphones, LBS 2012: 9th Symposium on Location Bases Services, October 2012, Munich, 5 p.
Verbree, E., S. Zlatanova, K. B. A. van Winden, E. B. van der Laan, A. Makri, L. Taizhou, and A. Haojun, 2013. To localise or to be localised with WiFi in the Hubei museum?, Int. ISPRS Arch. Photogramm. Remote Sens. Spatia l Inf. Sci., XL-4/W4, 31-35, 2013
Worboys, M. 2011. Modeling indoor space. In Proceedings of the 3rd ACM SIGSPATIAL International Workshop on Indoor Spatial Awareness. 1-6. ACM.
Zlatanova, S., Liu, L., Sithole, G., Zhao, J., & Mortari, F. , 2014. Space subdivision for indoor applications. Delft University of Technology, OTB Research Institute for the Built Environment.