Measured and modelled rainfall interception loss from an
agroforestry system in Kenya
N.A. Jackson
∗Institute of Hydrology, Crowmarsh Gifford, Wallingford, Oxon OX10 8BB, UK
Received 17 May 1999; received in revised form 6 October 1999; accepted 11 October 1999
Abstract
Rainfall interception losses from an agroforestry system in semi-arid Kenya comprising Grevillea robusta and maize were measured over a period of 33 months. These measurements showed that interception was slightly higher (10.2%) under trees with no maize understorey, than in the intercropped treatment (9.8%), and was directly related to the degree of tree canopy cover. Interception estimates using the reformulated version of the Gash analytical model were∼4% lower than measured totals, and were strongly dependent on both canopy cover and on monthly variations in the mean rainfall rate (R¯, mm h−1). ©2000 Published by Elsevier Science B.V. All rights reserved.
Keywords: Rainfall interception; Agroforestry; Modelling; Grevillea robusta
1. Introduction
Agroforestry has been promoted as a possible means of increasing the productive use of rainfall in water-limited environments, by using the water which is usually inaccessible to conventional crop-ping systems; i.e. soil water reserves that are below the crop rooting zone and/or rainfall occurring outside the normal cropping seasons (Jackson et al., 1998). However, any potential increase in rainfall utilisation by agroforestry systems, when compared to either woodlots or open crop fields, must be offset against the evaporation of rainfall intercepted by the likely greater canopy size (tree and crop), and not therefore available for crop growth (Wallace et al., 1995). In-terception losses must also be weighed against any increased abstraction of water from the crop rooting
∗Corresponding author. Tel.:+44-1491-692336;
fax:+44-1491-692424.
E-mail address: [email protected] (N.A. Jackson).
zone by tree roots, a component of the water balance that can be manipulated through practices such as root and/or canopy pruning.
Agroforestry systems are often spatially complex in nature, with both the tree and crop canopies affecting rainfall distribution and input to the soil surface. Since quantitative investigations of water-use in agroforestry systems are rare (Ong et al., 1991), we decided to in-vestigate the water-use of a hillslope agroforestry sys-tem in Kenya, combining Grevillea robusta (A. Cunn. ex R. Br.) trees with a local variety of maize (Zea mays L. cv. Katumani). Water balance components other than rainfall interception are reported elsewhere; e.g. soil evaporation (Jackson and Wallace, 1999a; Wallace et al., 1999), rainfall infiltration (Jackson and Wallace, 1999b), soil water storage (Jackson et al., 1999), and tree and crop transpiration (Lott et al., 1997).
It was intended that the experiment would provide data on how rainfall distribution is modified by both tree and crop canopies in an agroforestry system, as well as demonstrate how these processes could be
trolled by regular manipulation of the tree canopy, achieved through pruning. This paper compares the measurement and modelling of rainfall interception by G. robusta (A. Cunn. ex R. Br.) trees in a tropical agroforestry system in Kenya. The previously refor-mulated version of the Gash analytical model (Gash, 1979; Gash et al., 1995) was used to model the inter-ception loss from the discontinuous Grevillea canopy. Interception estimates from tropical forests are of-ten more uncertain than those obtained in temperate climates due to the complexity of the tree canopy struc-ture (Jackson, 1971; Bruijnzeel and Wiersum, 1987; Lloyd and Marques, 1988; Asdak et al., 1998a). Rain-fall interception loss in an agroforestry system will depend on the extent of the tree canopy cover, and this in turn depends on factors such as the tree planting density at establishment, and subsequent thinning and pruning practices.
Most of the literature comprises studies from closed forest canopies, although some cases exist where in-terception by discontinuous tree canopies has been studied (Rao, 1987; Teklehaimanot and Jarvis, 1991; Valente et al., 1997; Asdak et al., 1998a). In terms of tropical forestry and agroforestry systems, Veracion and Lopez (1976) examined interception below Pinus
kesiya stands, and interception under multi-storey
systems incorporating coffee and cocoa and shade tree species has been explored by Imbach et al. (1989). Tropical agroforestry systems often comprise fast-growing tree species grown in rotations as short as 6 or 7 years. Both measurements and models of interception loss are needed to predict the effects of the tree component on the overall water balance of the system at all stages from establishment to the harvest of the trees.
2. Materials and methods
2.1. Site and climate
The rainfall interception measurements presented, were made at the ICRAF field station at Machakos, Kenya, 80 km south-east of Nairobi (1◦33′S, 37◦8′E) at an altitude of 1560 m. The site runs downhill to the Maruba river at a slope of∼22%. The soil con-sists of a series of shallow (0.2–2 m) reddish-brown to brown sandy clay loams (well-drained luvisols — FAO soil classification). The surface 0.4 m was
com-paratively homogenous, while soil layers below this varied widely in gravel and clay content, with a num-ber of distinct horizons (Kibe et al., 1981; Huxley et al., 1989). The soil is underlain by layers of first weathered and then coherent rock (gneiss) at varying depths. A band of very shallow soils (0.2–0.6 m deep) ran across the site from the top north-west corner to-wards the bottom south-east corner. Soils were gen-erally deeper (0.7–1.5 m) above and below this band (Wallace et al., 1995).
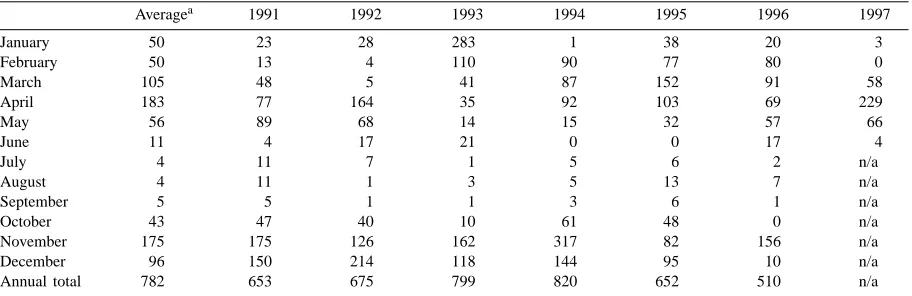
Annual rainfall is bi-modal, with a short rainy sea-son usually lasting from late October to late December, and a longer rainy season running from late February to the end of May. Monthly rainfall peaks in April and November, and little rainfall occurs between June and October (see Table 1 ). Rainfall during much of the two crop growth seasons is largely orographic in origin as moisture-laden air travels from the coast westwards towards the Kenyan highlands. Machakos district has a very large inter-annual variation in monthly and seasonal rainfall (Huxley et al., 1989).
2.2. Experimental design
This rainfall interception study formed part of a larger agroforestry trial which was established in October 1991. This trial combined rows of maize with
G. robusta, a rainforest tree species (Proteaceae) from
the north of Australia, introduced to East Africa as an ornamental in the last century. A detailed description of the experimental design is given by Jackson et al. (1999).
The planting arrangements of the plots in which rainfall interception was measured, consisted of a sole tree (Td) treatment, where G. robusta trees were
planted in a 3 m×4 m grid pattern, and an
inter-cropped (CTd) treatment with trees planted in the
same grid pattern, but with maize planted in rows 1 m apart (0.3 m between plants along row), following the contours of the slope. Maize was grown twice a year, and was planted at the start of each rainy season, after at least 20 mm of rainfall had occurred.
2.3. Instrumentation
Table 1
Monthly and annual rainfall (mm) at Machakos: historical means and recorded values at the project site between tree planting (October 1991) and the end of the project (June 1997)
Averagea 1991 1992 1993 1994 1995 1996 1997
January 50 23 28 283 1 38 20 3
February 50 13 4 110 90 77 80 0
March 105 48 5 41 87 152 91 58
April 183 77 164 35 92 103 69 229
May 56 89 68 14 15 32 57 66
June 11 4 17 21 0 0 17 4
July 4 11 7 1 5 6 2 n/a
August 4 11 1 3 5 13 7 n/a
September 5 5 1 1 3 6 1 n/a
October 43 47 40 10 61 48 0 n/a
November 175 175 126 162 317 82 156 n/a
December 96 150 214 118 144 95 10 n/a
Annual total 782 653 675 799 820 652 510 n/a
aData for 9-year period (1963–1971) from Machakos (Maruba) Dam station.
from the nearest trees, and four manually recorded raingauges (125 mm diameter) at distances of between 20 and 100 m from the nearest trees.
An automatic weather station (Didcot Instruments, Abingdon, UK) was sited on a tower above the trees in the centre of the site, with the tree canopy extending between 40 and 80 m in all directions. The mast was raised at least once each season to ensure that the
mea-surements were always made∼2 m above the mean
tree height. The variables measured at this position were: dry- and wet-bulb air temperatures (recorded us-ing an aspirated psychrometer); incident solar radia-tion (Model CM5, Kipp and Zonen, Netherlands); and wind speed and direction (Campbell Scientific, Leics., UK), used to determine prevailing wind directions dur-ing rainfall events. Wind speed was also measured at various heights below and within the tree canopy. All automatic instruments were measured every 10 s, and hourly totals (for rainfall and wind speed) or averages (wind direction) were stored on a data logger (Model 21, Campbell Scientific Instruments, UK).
Jackson (1971) demonstrated that estimates of trop-ical forest interception varied greatly as a result of high spatial heterogeneity in canopy architecture. Although the agroforestry system was less spatially complex than most tropical forests, the grid pattern of tree plant-ing meant that the canopy was markedly ‘clumped’. It was expected that such a canopy distribution might lead to significant differences in throughfall over rela-tively small horizontal distances. Eschner (1967) noted that considerable micro-scale variability in
through-fall existed between points below tree canopies, with stemflow sometimes accounting for significantly en-hanced and localised rainfall inputs to the soil surface. Given this anticipated variation in throughfall, it would have been preferable to use large-scale sheet-type interception gauges of the sort described by Calder and Rosier (1976) and Rao (1987). How-ever, the presence of the understorey maize crop made it impossible to adopt this technique. In addition, as part of the larger experiment it was necessary to obtain measurements of net rainfall input to the soil at specific positions relative to the trees, to match other measurements being made, such as soil water content (Jackson et al., 1999) and soil evaporation (Jackson and Wallace, 1999a). Therefore, throughfall was measured in both the Tdand CTdtreatments
us-ing manually recorded raus-ingauges, measurus-ing 125 mm diameter.
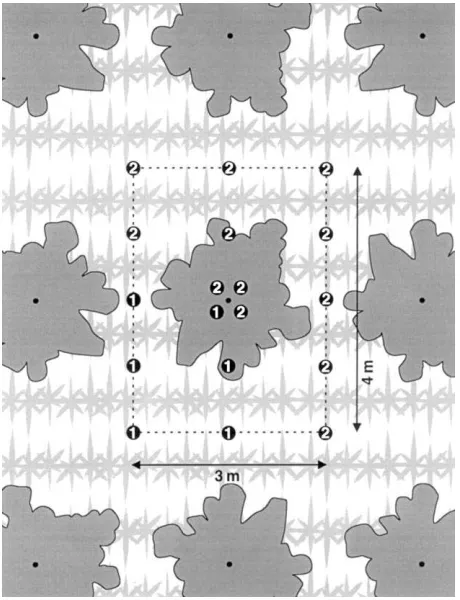
Initially (in October 1994), sets of raingauges were installed in the following arrangements. Six gauges were placed in one of the CTd plots, at various
dis-tances (0.3–2.5 m) from the base of the tree (see Fig. 1), covering one quarter of the 12 m2 area occu-pied by each tree, and in such a way that each lay mid-way between two rows of maize. Six more gauges were installed in one of Tdplots, in the same spatial
Fig. 1. Location of the raingauges used to measure throughfall over a 12 m2 area below the G. robusta tree canopy (CTd intercropped treatment shown here). Six gauges ( ) were deployed in November 1994, and the network was augmented with a further twelve gauges ( ) in early 1995. An identical spatial arrangement was employed in the sole tree Td treatment.
gauges on a regular basis. To compensate for varia-tion in intercepvaria-tion by tree canopies of different sizes and shapes in this study, the raingauges in both the Tdand CTdwere moved to identical positions around
different, randomly chosen trees, after approximately five rainfall events >5 mm had been recorded. Areal average interception over the 12 m2per tree was de-termined by weighting the volumes recorded in indi-vidual gauges by the fractional area they represented. An analysis of the wind direction during 885 h of rainfall showed that the bulk of the rain (73% of vol., 81% of rainfall h) came from directions between north-east and south-east. As there was measurable interception at 2.5 m midway between the trees, some rainfall must have been inclined away from vertical fall paths and was therefore being intercepted by the adjacent tree canopies, as reported in previous interception studies (Eschner, 1967; Aldridge, 1975;
Herwitz and Slye, 1995). Therefore, the number of gauges was increased early in 1995 to 18 per tree, so that the entire 12 m2area occupied by each tree was measured (see Fig. 1).
To measure stemflow, Sf, 18 gauges were installed
on trees in the Td plot and a further 18 gauges in the
CTdplot, consisting of a flexible plastic collar which
was sealed to the trunk of the tree with a non-toxic sil-icone compound about 0.75 m above the ground. The collars drained to plastic jerry-cans of 35 l capacity. Stemflow gauges were moved from tree to tree on a regular basis, in order to sample trees with varying trunk diameters and canopy sizes.
2.4. Tree canopy cover
rate of leaf fall seem to be seasonally dependent. The trees were pruned at various stages during the exper-iment, usually prior to planting the crop, by remov-ing the lowermost 1 m of canopy. In November 1996 the trees were severely pruned, removing all but the uppermost 1 m of canopy. This reduced the canopy volume by approximately 85%, and was designed to minimise the competition for soil water between trees and crops as part of an associated experiment on root competition (Smith et al., 1999).
Leaf area index (L∗) values for G. robusta was
estimated using a calibrated pipe model (Lott et al., 1997), for the entire period from establishment (October 1991) to the end of the study (June 1997).
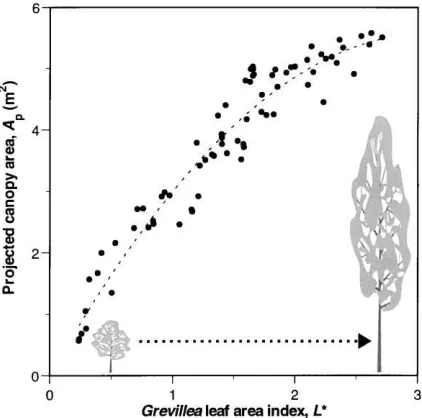
Estimates of projected crown area (Ap) were made
at various intervals throughout the experiment, using canopy radius measurements and assuming a circular canopy distribution. An empirical relationship be-tween projected canopy area (m2) and leaf area index was determined, and is shown in Fig. 2:
Ap= −0.594(L∗)2+3.669(L∗);
r2=0.932; n=74 (1)
The curved nature of the relationship reflects the fact that the adopted pruning regime encouraged the trees
Fig. 2. Empirical relationship determined between the leaf area index (L∗) and the projected area (A
p, in m2) of G. robusta crowns at the Machakos site. The relationship has the form: Ap= −0.594(L∗)2+3.669(L∗).
to grow vertically more rapidly than laterally, and therefore, towards the end of the experiment, tree leaf area index increased faster than did the projected canopy area. The relationship was used to calculate monthly values of Ap, which were in turn converted
to fractional canopy cover values, c, (where a dense
closed canopy=1) using a planting density of one
tree per 12 m2.
2.5. Model description
Gash et al. (1995) revised the original (Gash, 1979) analytical rainfall interception model to improve esti-mation of interception from sparse tree canopies. The model, which is a simplification of the Rutter model (Rutter et al., 1971, 1975), assumes that daily rainfall occurs as one single storm event each day, an assump-tion that Lloyd et al. (1988) considered valid given the prevailing rainfall conditions in much of the tropics, i.e. short but intense convective storms. Each of these rainfall events is considered to comprise three distinct phases: firstly, a period from the onset of rainfall un-til the canopy becomes saturated (wetting-up phase); secondly, a saturation phase; and lastly a period of drying out, from the point at which rainfall stops until the canopy and trunks are absolutely dry. It is assumed that both the canopy and trunks dry out completely between rainfall events.
To calculate the various components of the inter-ception loss, the revised model requires several initial parameters (see Table 2). A value for canopy cover,
c, is required, defined as the projected area of the tree
canopy on the ground below. Canopy storage, Sc, is
as-sumed to remain constant, however, the canopy cover,
c, varies. Also required are daily rainfall, Pg, the trunk
storage capacity, St, the rainfall fraction redirected to
stemflow, pt, and the ratio between the mean rainfall
rate,R, and the mean evaporation rate (during rainfall) per unit area of canopy cover,Ec.
2.6. Model parameterisation
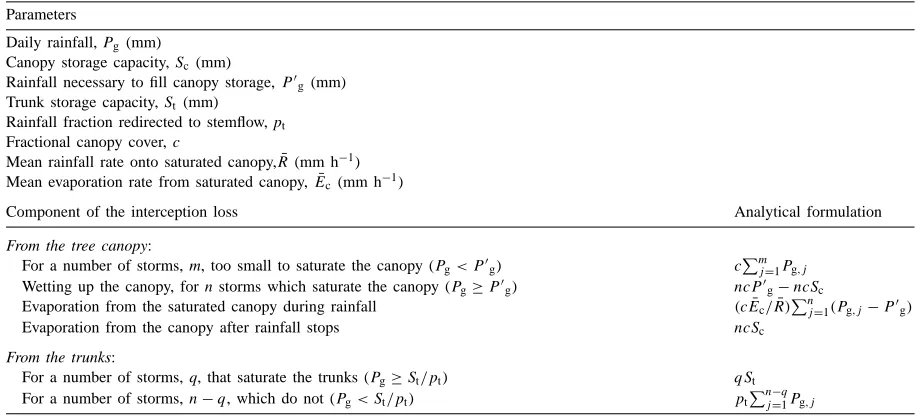
Table 2
The parameters and analytical forms for components of rainfall interception loss from sparse tree canopies (after Gash et al., 1995) Parameters
Daily rainfall, Pg (mm)
Canopy storage capacity, Sc(mm) Rainfall necessary to fill canopy storage,P′
g (mm) Trunk storage capacity, St (mm)
Rainfall fraction redirected to stemflow, pt Fractional canopy cover, c
Mean rainfall rate onto saturated canopy,R¯(mm h−1) Mean evaporation rate from saturated canopy,E¯c(mm h−1)
Component of the interception loss Analytical formulation
From the tree canopy:
For a number of storms, m, too small to saturate the canopy (Pg< P′g) cPmj=1Pg,j Wetting up the canopy, for n storms which saturate the canopy (Pg≥P′g) ncP′g−ncSc Evaporation from the saturated canopy during rainfall (cE¯c/R)¯ Pn
j=1(Pg,j−P′g)
Evaporation from the canopy after rainfall stops ncSc
From the trunks:
For a number of storms, q, that saturate the trunks (Pg≥St/pt) qSt For a number of storms,n−q, which do not (Pg< St/pt) ptPn
−q j=1Pg,j
From 885 h of rainfall recorded between 1991 and 1993 (i.e. before interception measurements com-menced), the mean rainfall rate was determined to be 2.28±0.92 mm h−1. However, individual storms of
more than 90 mm were recorded, as well as (very) oc-casional rainfall intensities of more than 15 mm h−1. For this reason, monthly rainfall rates (R¯m) were also
calculated, which varied between 0.5 and 3.2 mm h−1. Both the long term and monthly values were used in modelling. Bruijnzeel and Wiersum (1987) found that the mean daily rainfall rate in a sparse Acacia planta-tion varied significantly at different times throughout the rainy season.
The mean evaporation rate during rainfall,
¯
Ec, was calculated as 0.23 mm h−1, using the
Penman–Monteith formula, estimating values of net radiation (Rn) above the tree canopy from measured
solar radiation (see Rao, 1987; Lloyd et al., 1988).
The aerodynamic conductance, ga, was calculated
according to Valente et al. (1997), as ga=fu, where u
is the windspeed and f is a constant. It was assumed that the aerodynamic conductances for momentum, water vapour and sensible heat remained the same, and therefore f was calculated as:
f =
k
ln[(z−d)/z0] 2
(2)
where k is the von Kármán constant (0.41), z is the ref-erence level, d is the zero-plane displacement height, and z0is the roughness length, determined to be 0.75
and 0.1, respectively, of the mean tree height (Rutter et al., 1975; Valente et al., 1997), which increased from 0.5 to 9.5 m over the course of the experiment.
Although the effect on ga of increasing tree height
was taken into account by varying the value of the two roughness parameters, it is possible that the nature of the relationship between d and z0and tree height may
have varied over time, as pruning changed the shape and distribution of the canopy. There is some uncer-tainty about determining d and z0 in widely spaced
canopies (Jarvis et al., 1976). Pruning would widen the gaps between individual tree canopies, often lead-ing to more effective turbulent exchange within the canopy layer and greater conductances per tree.
Teklehaimanot et al. (1991) studied the effect of tree planting density on boundary layer conductance and found that ga increased linearly as the spacing
between trees grew larger. It is unlikely that removing the lowermost branches would have had a large effect on the value of ga, as windspeeds below and within the
that the value of gadid also. However, as canopy cover
was less than 2% at this stage, any error in the value of gawould account for a negligible percentage of the
overall interception.
As the canopy storage capacity (Sc) was known to be
affected by canopy architecture (Asdak et al., 1998b) it was expected to vary, depending on the height and shape of the trees as they grew, and on the degree of canopy cover resulting from the pruning regime adopted. Canopy storage capacity was determined us-ing the envelope method of Leyton et al. (1967), from the negative intercepts of linear regressions between throughfall and gross rainfall (with a pre-defined slope set to 1−pt).
There is an inevitable degree of subjectivism in-volved in the envelope approach (Rowe, 1983), who noted that seasonal variations, rainfall intensities and
wind speeds had a marked effect on determining Sc
using the Leyton et al. (1967) method. Data from 172 rainfall events recorded at various stages dur-ing the experiment were used to derive Sc values of
between 0.71 and 0.93 mm. In general, as the tree
canopies expanded, Sc increased. Pruning reduced
Sc, but to varying degrees, as might be expected
from removing either the lowermost branches or foliage higher up the tree. Variation in Sc also
re-flected monthly and seasonal variations in the rainfall intensity.
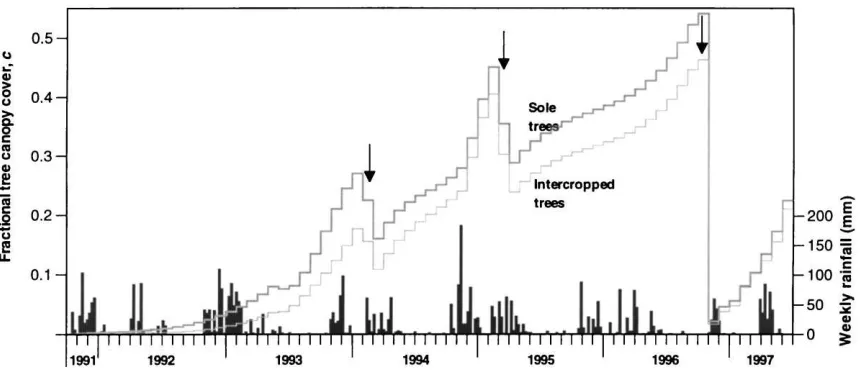
Fig. 3. Changes in the fractional cover, c, from the G. robusta canopies in the sole tree (thick line) and intercropped (thin line) treatments, estimated from the formula from Fig. 2. Arrows denote times at which the canopies were pruned. Bars show weekly rainfall during the long (February–July) and short (October–January) rainy seasons.
Trunk storage capacities for smooth barked Aus-tralian rainforest tree species like Grevillea were found to be much lower than rough barked equivalents (Her-witz, 1985), suggesting that stemflow from the
Grevil-lea in our experiment might be significant. Due to the
observed variability in stemflow from trees of different sizes, St and ptwere derived following the procedure
of Lloyd et al. (1988). Separate linear regressions of stemflow against gross rainfall were determined for 42 trees. The averages of the intercepts (0.185±0.03 mm) and of the slopes (0.026±0.007) were taken as esti-mates of Stand pt, respectively. Monthly values of the
canopy cover, c, were calculated using values of Ap,
as shown in Fig. 3.
3. Results and discussion
Fig. 3 shows the monthly changes in fractional tree canopy cover, c, in the Tdand CTdplots during the
ex-periment. After 214years of growth after planting, tree canopy cover, c, in the Td and CTd plots in January
1994 was 0.27 and 0.18 respectively. The values of c in the CTdplots reflect the smaller tree size resulting
from earlier resource competition between trees and crops after establishment (Lott et al., 1997). Remov-ing the lowermost 1 m of canopy at this point reduced
c to 0.16 and 0.11 in the Td and CTd treatments,
Table 3
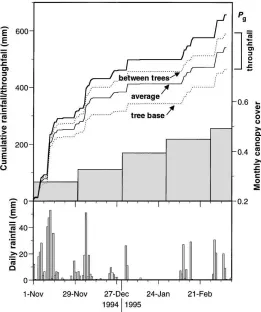
Comparison of gross rainfall, Pg, canopy throughfall Tf, and stemflow, Sf, and rainfall interception, I, in the agroforestry (CTd) and sole tree (Td) plots, for 126 rainfall events between November 1994 and June 1997
Parameters Units Sole tree plots Agroforestry (tree+crop) plots
Area averagea By base of treesb Between treesc Area average By base of trees Between trees
Pg mm 1583 1583 1583 1583 1583 1583
Tf mm 1400 1338 1444 1409 1379 1452
(%) (88.4) (84.5) (91.2) (89.0) (87.1) (91.7)
Sf mm 11 22 – 10 19 –
(%) (0.7) (1.4) – (0.6) (1.2) –
Id mm 172 223 139 164 185 131
(%) (10.9) (14.1) (8.9) (10.4) (11.7) (8.3)
aT
f, Sf and I expressed per 12 m2 ground area occupied per tree. Values of throughfall are means of interception gauges weighted according to ground areas they represent.
bMeans of raingauges closest to the base of the trees (0.3 m) in each treatment. cMeans of raingauges furthest from the trees (2.5 m) in each treatment. dInterception, I, defined asP
g−Tf−Sf.
Canopy cover increased steadily following prun-ing, throughout the dry season, before increasing rapidly in both treatments following the onset of the 1994–95 short rains. Both treatments were pruned again, between the rainy seasons, reducing c from 0.45 to 0.29 and from 0.40 to 0.24 in the Tdand CTd
treatments, respectively. The final pruning, in Novem-ber 1996, reduced the canopy size by approximately 85%, and hence reduced the canopy cover, c, from the largest values observed during the study (Td=0.54;
CTd=0.46) to values similar to those observed
dur-ing establishment (0.02 for both treatments). Trees in both treatments recovered quickly, exhibiting values of c of∼0.21 by the end of the experiment.
Table 3 summarises measurements of rainfall in-terception, I, made between November 1994 and the end of the experiment in June 1997. During this period, variation in both storm intensity and dura-tion, as well as in the degree of canopy cover led to a wide range of interception values for individual rainfall events. At just over 10%, rainfall interception was similar to values of 11% reported for a sparse Mediterranean Eucalyptus plantation (Valente et al., 1997), montane stands of P. kesiya of varying densi-ties (from 8 to 13%, Veracion and Lopez, 1976), and montane stands of bamboo and cypress in Kenya (be-tween 10 and 15%, Pereira, 1973). However, rainfall interception in the Grevillea/maize system was much lower than values reported for both Ugandan mon-tane forest (∼35%, Hopkins, 1960), or multi-storey agroforestry systems in Costa Rica (>30%, Imbach et
al., 1989), where the vegetation in these other studies was considerably more dense.
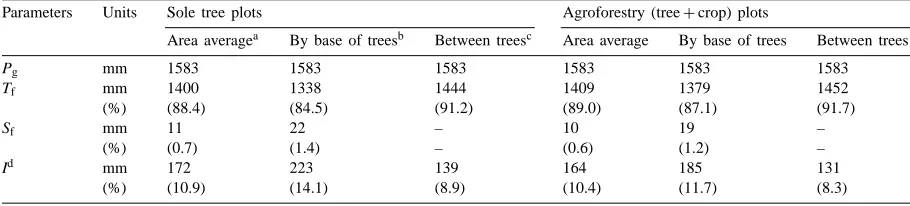
Significant spatial variation in throughfall was ob-served below the canopy, e.g. in the 1994–95 short rains shown in Fig. 4, as was reported by previous au-thors (Lloyd et al., 1988; Asdak et al., 1998a). Greater interception was observed in both treatments, at po-sitions closest to the trees (0.3 m), as compared with both the area average and the value at 2.5 m from the trees (i.e. midway between four trees, see Fig. 1), confirming the strong dependence of throughfall on the degree of canopy cover as well as the position of the gauge with respect to the tree trunk (Eschner, 1967).
Stemflow volumes were influenced by the individ-ual tree size, i.e. canopy cover and trunk diameter, and led to large variation in Sf between trees. The areal
Fig. 4. An example of the spatial variation in throughfall below the tree canopy, from the 1994–95 short rains. Gross rainfall (Pg) is compared with: the areal average throughfall over the 12 m2 occupied by each tree (see Fig. 1), and throughfall recorded by the base of the tree (0.3 m) and between the trees (2.5 m). Also shown are the monthly increases in fractional cover, c, and daily rainfall).
3.1. Comparisons between measured and modelled interception
In order to compare measured rainfall interception loss under continually varying canopy cover with that estimated using the revised Gash model, 4 periods dur-ing the experiment were chosen, and examined sepa-rately. The first period started soon after the start of the 1994–95 short rains (see Fig. 3), on 1 November 1994 and ended just before the tree canopies were pruned on 10 March 1995. The second period started just af-ter pruning, on 15 March 1995 and finished at the end of November, 1995. The fourth interval covered the end of the 1996 long rains, (May and June 1996) a period when tree canopy cover was at a maximum, and was used to compare interception with that recorded during the final period, which started just after the
tree canopies had been severely pruned (4 November 1996) and lasted until the end of the experiment (2 June 1997).
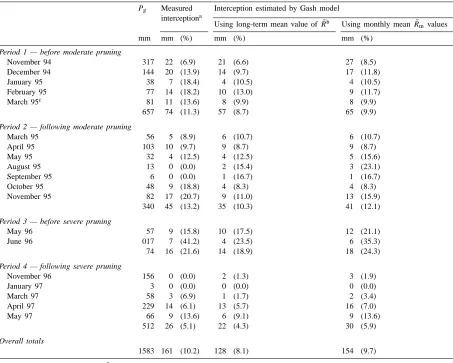
The comparisons between monthly observed and modelled interception losses are shown in Table 4. Initial estimates from the model where the long term (1991–1993) value ofR¯was used, underestimated the
overall measured interception by 33 mm (20%), with more than 50% of this discrepancy occurring during the first period studied. It is possible that as the net-work of interception gauges was not augmented until early 1995, part of this discrepancy may be accounted for, by the errors in the measured interception occur-ring between December 1994 and February 1995.
Table 4
Comparison of gross rainfall, Pg, with measured and modelled interception by the Grevillea canopies in the sole tree (Td) plots over four periods throughout the experiment
Pg Measured Interception estimated by Gash model interceptiona
Using long-term mean value ofR¯b Using monthly meanR¯mvalues
mm mm (%) mm (%) mm (%)
Period 1 — before moderate pruning
November 94 317 22 (6.9) 21 (6.6) 27 (8.5)
December 94 144 20 (13.9) 14 (9.7) 17 (11.8)
January 95 38 7 (18.4) 4 (10.5) 4 (10.5)
February 95 77 14 (18.2) 10 (13.0) 9 (11.7)
March 95c 81 11 (13.6) 8 (9.9) 8 (9.9)
657 74 (11.3) 57 (8.7) 65 (9.9)
Period 2 — following moderate pruning
March 95 56 5 (8.9) 6 (10.7) 6 (10.7)
April 95 103 10 (9.7) 9 (8.7) 9 (8.7)
May 95 32 4 (12.5) 4 (12.5) 5 (15.6)
August 95 13 0 (0.0) 2 (15.4) 3 (23.1)
September 95 6 0 (0.0) 1 (16.7) 1 (16.7)
October 95 48 9 (18.8) 4 (8.3) 4 (8.3)
November 95 82 17 (20.7) 9 (11.0) 13 (15.9)
340 45 (13.2) 35 (10.3) 41 (12.1)
Period 3 — before severe pruning
May 96 57 9 (15.8) 10 (17.5) 12 (21.1)
June 96 017 7 (41.2) 4 (23.5) 6 (35.3)
74 16 (21.6) 14 (18.9) 18 (24.3)
Period 4 — following severe pruning
November 96 156 0 (0.0) 2 (1.3) 3 (1.9)
January 97 3 0 (0.0) 0 (0.0) 0 (0.0)
March 97 58 3 (6.9) 1 (1.7) 2 (3.4)
April 97 229 14 (6.1) 13 (5.7) 16 (7.0)
May 97 66 9 (13.6) 6 (9.1) 9 (13.6)
512 26 (5.1) 22 (4.3) 30 (5.9)
Overall totals
1583 161 (10.2) 128 (8.1) 154 (9.7)
aMean interception per 12 m2 ground area occupied per tree, including stemflow values.
bRis the mean rainfall rate (2.28 mm h−1) recorded between 1991 and 1993, before measurements commenced. Monthly rainfall rates, ¯
Rm were calculated for each month during the experiment in which measurements were made (see text for details).
cAs pruning occurred mid-way through March, two rainfall totals are provided for this month: the first from 1 March to10 March inc., and the second from 15 March to 31 March inc.
and modelled interception, but by the end of Period 2 (Nov 95) the tree canopies had re-grown and in-terception losses were larger. More severe pruning in November 1996, where 85% of the canopy was re-moved, showed a more marked effect on interception. High interception losses observed before pruning in Period 3, were reduced to zero (measured) or minimal (modelled) interception following pruning.
On a month-to-month basis, the model tended to under- or over-estimate interception between 1 and
8 mm, and as several of these months showed mean rainfall rates (R¯m) that varied from the long term
average used (2.28 mm h−1 ), the model was re-run
entering (R¯m) in each case. The results of this
The fact that the model still underestimated inter-ception losses might be due in part to considering rainfall as one storm event per day, when in fact the monthly mean number of ‘discrete’ rainfall events per day varied between 1.0 and 2.2 over the period studied. One might expect a higher interception loss from sev-eral small storms in a day than from one larger event (Jackson, 1971; Bruijnzeel and Wiersum, 1987), and that isolated short periods of rain (1–3 h) occurring within a ‘single’ prolonged event might be expected to result in significant errors in the interception esti-mated by the Gash analytical model (Mulder, 1985; Dykes, 1997).
The calculations showed that relatively small amounts of water were lost through evaporation either the canopy wetted up (4%) or during storms when it is too small for canopy saturation to occur (3%). By far the largest evaporative losses occurred either while the canopy remained saturated (54%) or as it dried out following rainfall (30%). Evaporation from
Fig. 5. (a) Modelled interception losses by G. robusta canopies in the intercropped (CTd, ) and sole-tree (Td, ) treatments. Also shown are monthly estimates of the gap fraction (space between tree canopies) in the CTd ( ) and Td( ) treatments. Arrows denote times at which the canopies were pruned. (b) Monthly gross rainfall amounts (bars) shown for comparison.
the trunks accounted for a little under 9% of the total evaporative loss.
Given that this revised overall model estimate was close to the measured cumulative interception, and that it covered a period where the fractional canopy cover, c, ranged between 0.02 and 0.54 (the maximum observed), it was considered acceptable to use the model to estimate cumulative intercep-tion over the period before intercepintercep-tion measure-ments commenced, i.e. from October 1991 to Oc-tober 1994. During this period, it was impossible to determine canopy storage capacity (Sc) values,
and therefore the earliest recorded measurement (November–December 1994) was substituted, al-though this may have lead to a slight over-estimate of interception in the early stages of the exper-iment. As before, monthly values of the canopy cover, c, were determined from projected area val-ues (see Fig. 3). Monthly mean rainfall rates (R¯m)
between 0.5 and 5.7 mm h−1. The results are shown in Fig. 5.
Overall, between October 1991 and June 1997, the cumulative gross rainfall was 4106 mm and the cu-mulative modelled interception by the trees grown with (CTd) and without (Td) an understorey of maize
was 236 mm (5.8%) and 286 mm (7.0%), respectively. However, monthly interception losses were generally low during the first 3 years after the trees were planted, and the cumulative interception up to 1 November 1994, was 59 mm (2.6%) and 80 mm (3.6%) for the CTd and Td treatments, respectively, during which
time viable yields of maize were obtained from the intercropped plots (Lott et al., 1997).
Highest monthly interception losses were recorded during the 1994–95 short rains, which were signifi-cantly greater than the seasonal average rainfall (see Table 1). Interception losses decreased after this point, then increased again, following the trends in monthly rainfall, as well as variation in the free throughfall coefficients that resulted from pruning management practices. Maize yields were substantially reduced from this point onwards (see Lott et al., 1997), as a result of competition for water between trees and crops. Drastic pruning in late 1996 reduced intercep-tion losses as a percentage of gross rainfall to values similar to those observed during the first 3 years after planting, with increased maize growth beneath the trees (data not shown).
The Penman–Monteith equation used to estimate the evaporation rate is strongly dependent on the
boundary layer conductance, ga. When looking at
the effects that thinning had on rainfall interception,
Whitehead et al. (1989) assumed that ga was
unaf-fected by tree spacing, although it is generally consid-ered to be the most important characteristic of forest canopies that determines the extent of interception losses (Jarvis and Stewart, 1978). As mentioned ear-lier there are problems associated with determining d and z0 at wide tree spacings (Jarvis et al., 1976), as
occurred in some agroforestry systems. Therefore it is worth considering how greater temporal variation in
ga might have affected the model simulations carried
out in this study.
By inverting the Penman–Monteith equation, and ignoring the net radiation term a as being negligible during rainfall, Teklehaimanot et al. (1991) used an averaging method to determine gaat different spacings
of 10 m tall Sitka spruce trees. As the gap between the tree canopies increased from 0 to 2 m, ga increased
from∼0.6 to 2.1 m3s−1.
In the experiment reported here, a comparable increase in gap size occurred when the trees were severely pruned, moving from a situation where ad-jacent tree canopies overlapped to a gap of between 2 and 3 m between canopy edges. However, unlike a study dealing with similar sized trees at different spac-ings, in this experiment as gap size increased it was at the expense of canopy size, i.e. through pruning.
It is likely that a large increase in ga would have
occurred immediately after severe pruning took place, and the average value ofE¯ used would no longer be appropriate, as subsequent evaporation rates would be significantly higher. This would have resulted in under-estimated interception losses in the period immediately after severe pruning. However, given that the aim of the modelling exercise was to sim-ulate cumulative interception from planting through to a harvestable timber stage, and that even a large under-estimation during periods where interception losses were small (between 1.3 and 3.4%, see Table 4) would be negligible in terms of the overall fraction of incoming rainfall, it is convenient to accept the model as it stands.
As remarked on earlier, agroforestry systems are spatially complex. When looking at how conventional
methods of determining ga may be inappropriate
in some cases, other factors affecting the Penman– Monteith equation may also be worth examining. An actively transpiring understorey crop may lead to a lower vapour pressure deficit below and around the tree canopy, affecting evaporation rates of rain-fall intercepted by the tree canopy, when compared with a woodlot with nothing but crusted bare soil below. Clearly there is a need for more research into interception processes within agroforestry systems and their interaction both with the other components of the water balance, and with canopy manipulation through pruning.
4. Concluding remarks
the variation in rainfall rate throughout each year. At around 10% of gross rainfall lost through interception between 1994 and 1997 (when the tree canopies were large), this compares with estimated savings of around 15% of rainfall at the same site due to reductions in soil evaporation (Es) due to shading by the tree canopy
(Wallace et al., 1999).
However, an overall assessment of whether the agro-forestry system really does use rainfall more effec-tively than a combination of woodlots and open fields can only be made when all components of the water balance are compared. This includes surface runoff, tree and crop transpiration and changes in soil water storage. Some of these processes have already been described (Jackson and Wallace, 1999a, b; Jackson et al., 1999, Smith et al., 1999) and an overall assessment will appear in forthcoming papers.
The application of long term (historical) values of R¯ derived from rainfall data from earlier years, caused the model to substantially under-estimate rainfall interception losses, whereas the incorporation of monthly (current) variation in rainfall rate into the model, substantially improved the interception estimate. In this study, hourly rainfall data were avail-able with which to calculate monthly values forR. However, similar data necessary to determine how
¯
R varies from month-to-month in other locations, or from earlier periods may be scarce.
Further examination of rainfall records might re-veal whether monthly variations in mean rainfall rate might be predicted, e.g. if higher values ofR¯ might be expected during months of heavy rainfall, or at the onset of the seasonal rains, whereas low values might be expected during drier months with smaller storms occurring with much lower frequencies. Given that pruning tends to be implemented at the onset of the rains (reduced ground cover) and that the tree canopy recovers late in the rainy season (increased cover), the interaction between c andR¯ could then be investigated more fully.
It is concluded that the revised version of the Gash model (Gash et al., 1995) is suitable to model in-terception in sparse agroforestry systems over peri-ods where both rainfall and canopy characteristics do not alter significantly. Over longer periods, caution should be taken in applying long term average values, and modelling these periods in discrete intervals is preferred.
Acknowledgements
This publication is an output from a research project (R4853 and R6364) funded by the Forestry Research Programme of the Department for International De-velopment of the UK. However the Department for International Development can accept no responsibil-ity for any information provided or views expressed. The water balance research project at Machakos, Kenya was carried out with the support and collab-oration of ICRAF. The assistance of Professor C.K. Ong, Mr Boniface Muli, and Mr Peter Muia Mbatha from ICRAF is greatly appreciated. The author is also grateful to Dr James Lott from the University of Not-tingham, who provided the leaf area index data, and to Prof. Jim Wallace and Mr Colin Lloyd of the Institute of Hydrology who provided advice on the analysis and modelling of the rainfall interception data.
References
Aldridge, R., 1975. The resultant direction and inclination of rainfall at Arahura, Wairarapa, New Zealand. J. Hydrol. (N.Z.) 14, 55–63.
Asdak, C., Jarvis, P.G., van Gardingen, P., Fraser, A., 1998a. Rainfall interception loss in unlogged and logged forest areas of central Kalimantan, Indonesia. J. Hydrol. 206, 237–244. Asdak, C., Jarvis, P.G., van Gardingen, P., 1998b. Modelling
rain-fall interception in unlogged and logged forest areas of central Kalimantan Indonesia. Hydrol. Earth Sys. Sci. 2, 211–220. Bellot, J., Escarre, A., 1998. Stemflow and throughfall
determination in a resprouted Mediterranean holm-oak forest. Ann. Sci. For. 55, 847–865.
Bruijnzeel, L.A., Wiersum, K.F., 1987. Rainfall interception by a young Acacia auriculiformis (A. Cunn.) plantation forest in west Java, Indonesia: application of Gash’s analytical model. Hydrol. Proce. 1, 309–319.
Calder, I.R., Rosier, P.T.W., 1976. The design of large plastic sheet net rainfall gauges. J. Hydrol. 30, 403–405.
Dykes, A.P., 1997. Rainfall interception from a lowland tropical rainforest in Brunei. J. Hydrol. 200, 260–279.
Eschner, A.R., 1967. Interception and soil moisture distribution. In: Sopper, W.E., Hull, H.W. (Eds.), Int. Symp. For. Hydrol. Pergamon Press, Toronto, pp. 191–200.
Gash, J.H.C., 1979. An analytical model of rainfall interception by forests. Q. J. R. Meteorol. Soc. 105, 43–55.
Gash, J.H.C., Lloyd, C.R., Lachaud, G., 1995. Estimating sparse forest rainfall interception with an analytical model. J. Hydrol. 170, 79–86.
Herwitz, S.R., 1985. Interception storage capacities of tropical rainforest canopy trees. J. Hydrol. 77, 237–252.
Herwitz, S.R., 1987. Raindrop impact and water flow on the vegetative surfaces of trees and the effects on stemflow and throughfall generation. Earth Surface Proce. Landforms 12, 425–432.
Herwitz, S.R., Slye, R.E., 1995. Three-dimensional modelling of canopy tree interception of wind-driven rainfall. J. Hydrol. 168, 205–226.
Huxley, P.A., Pinney, A., Gatama, D., 1989. Development of agroforestry research methodology aimed at simplifying the study of potential tree/crop mixtures. Final Report on Project no. 1-432-60005613, ICRAF, Nairobi, Kenya, 109 pp. Hopkins, B., 1960. Rainfall interception by a tropical rainforest
in Uganda. East African Agric. J. 25, 255–258.
Imbach, A.C., Fassbender, H.W., Borel, R., Beer, J., Bonnemann, A., 1989. Modelling agroforestry systems of cacao (Theobroma cacao) with laurel (Cordia alliodora) and cacao with poro (Erythrina poeppigiana) in Costa Rica IV. Water balances. Agroforestry Sys. 8, 267–287.
Jackson, I.J., 1971. Problems of throughfall and interception measurement under tropical forest. J. Hydrol. 12, 234–254. Jackson, N.A., Smith, D.M., Roberts, J.M., Wallace, J.S., Ong,
C.K., 1998. Water balance of agroforestry systems on hillslopes — Phase II. DFID/FRP Final Report on Project, IH 98/3. Institute of Hydrology, Wallingford.
Jackson, N.A., Wallace, J.S., 1999a. Soil evaporation measurements in an agroforestry system in Kenya. Agric. For. Meteorol. 94, 45–57.
Jackson, N.A., Wallace, J.S., 1999b. Analysis of soil water dynamics in an agroforestry system based on detailed soil water records from time-domain reflectometry. Hydrol. Earth Sys. Sci. 4, in press.
Jackson, N.A., Wallace, J.S., Ong, C.K., 1999. Tree pruning as a means of controlling water use in an agroforestry system in Kenya, For. Ecol. Manage. 126, in press.
Jarvis, P.G., James, G.B., Landsberg, J.J., 1976. Coniferous forest. In: Monteith, J.L. (Ed.), Vegetation and the Atmosphere. Academic Press, London, pp. 171–240.
Jarvis, P.G., Stewart, J.B., 1978. Evaporation of water from plantation forest. In: Ford, E.D., Malcolm, D.C., Atterson, J. (Eds.), The Ecology of Even-Aged Forest Plantations. Institute of Terrestrial Ecology, Cambridge, UK, pp. 327–350. Jordan, C.F., 1978. Stem flow and nutrient transfer in tropical rain
forest. Oikos 31, 257–263.
Kibe, J.M., Ochung, H., Macharia, P.N., 1981. Soils and vegetation of the ICRAF experimental farm (Machakos district) — Kenyan Ministry of Agriculture soil survey. Report no. D23, 68 pp. Leyton, L., Reynolds, E.R.C., Thompson, F.B., 1967. Rainfall
interception in forest and moorland. In: Sopper, W.E., Hull, H.W. (Eds.), Int. Symp. For. Hydrol. Pergamon Press, Toronto, pp. 163–178.
Lloyd, C.R., Marques, A., 1988. Spatial variability of throughfall and stemflow measurements in Amazonian rainforest. Agric. For. Meteorol. 42, 63–73.
Lloyd, C.R., Gash, J.H.C., Shuttleworth, W.J., Marques, A., 1988. The measurement and modelling of rainfall interception by Amazonian rain forest. Agric. For. Meteorol. 43, 277–294.
Lott, J.E., Black, C.R., Ong, C.K., 1997. Resource utilisation by trees and crops in agroforestry systems. Final technical report to the Forestry Research Programme, DFID, 81 pp.
Mulder, J.P.M., 1985. Simulating interception loss using standard meteorological data. In: Hutchison, B.A., Hicks, B.B. (Eds.), The Forest-Atmosphere Interaction. Reidel, Dordrecht, pp. 177–196.
Ong, C.K., Corlett, J.E., Singh, R.P., Black, C.R., 1991. Above and below ground interactions in agroforestry systems. For. Ecol. Manage. 45, 45–47.
Pereira, H.C., 1973. Land Use and Water Resources in Temperate and Tropical Climates. Cambridge University Press, UK, pp. 98–102.
Prebble, R.E., Stirk, G.B., 1980. Throughfall and stemflow on silverleaf ironbark (Eucalyptus melanophloia) trees. Aust. J. Ecol. 5, 419–427.
Rao, A.S., 1987. Interception losses of rainfall from cashew trees. J. Hydrol. 90, 293–301.
Rowe, L.K., 1983. Rainfall interception by an evergreen beech forest, Nelson, New Zealand. J. Hydrol. 66, 143–158. Rutter, A.J., Kershaw, K.A., Robins, P.C., Morton, A.J., 1971. A
predictive model of rainfall interception in forests I. Derivation of the model from observations in a plantation of Corsican pine. Agric. Meteorol. 9, 367–384.
Rutter, A.J., Morton, A.J., Robins, P.C., 1975. A predictive model of rainfall interception in forests II. Generalisation of the model and comparison with observations in some coniferous and hardwood stands. J. Appl. Ecol. 12, 367–380.
Smith, D.M., Jackson, N.A., Roberts, J.M., Ong, C.K., 1999. Root distributions in a Grevillea robusta-maize agroforestry system in semi-arid Kenya. Plant and Soil, in press.
Teklehaimanot, Z., Jarvis, P.G., 1991. Modelling of rainfall interception loss in agroforestry systems. Agroforestry Sys. 14, 65–80.
Teklehaimanot, Z., Jarvis, P.G., Ledger, D.C., 1991. Rainfall interception and boundary layer conductance in relation to tree spacing. J. Hydrol. 123, 261–278.
Valente, F., David, J.S., Gash, J.H.C., 1997. Modelling interception loss for two sparse eucalypt and pine forests in central Portugal using reformulated Rutter and Gash analytical models. J. Hydrol. 190, 141–162.
Veracion, V.P., Lopez, A.C.B., 1976. Rainfall interception in a thinned Benguet Pine (Pinus kesiya) forest stand. Sylvatrop 1, 128–134.
Wallace, J.S., Jackson, N.A., Ong, C.K., 1995. Water balance of agroforestry systems on hillslopes. Final report to the ODA Forestry Research Programme. Institute of Hydrology report ODA 95/10, 39 pp.
Wallace, J.S., Jackson, N.A., Ong, C.K., 1999. Modelling soil evaporation in an agroforestry system in Kenya. Agric. For. Meteorol. 94, 31–44.