Controlling agricultural nonpoint water pollution:
costs of implementing the Maryland Water Quality
Improvement Act of 1998
q
Doug Parker
∗Agricultural and Resource Economics, University of Maryland, College Park, MD 20742, USA
Abstract
The Maryland Water Quality Improvement Act of 1998 (WQIA) seeks to create environmental and other benefits to the Chesapeake Bay through reductions in nonpoint source nutrient pollution. This paper analyzes the economic impacts of the WQIA on agricultural users of nutrients (commercial fertilizers or animal manures) and on poultry growers in the state of Maryland. The net economic impacts to each of these groups are estimated along with some discussion of the distribution of the impacts. Recognition of the distribution of the impacts allows for the assessment of potential policies to address negative impacts. Additional sections of the WQIA are discussed in terms of their ability to shift the distribution of the impacts or to provide partial compensation to those most affected. The WQIA is the most restrictive agricultural nonpoint pollution control law in the US. While the WQIA only regulates nutrient use in the state of Maryland, other states, as well as the federal government, are watching how this law is implemented. Many states are considering similar laws. At the national level, the United States Department of Agriculture and the United States Environmental Protection Agency have issued draft guidelines that will control nutrients from animal operations in much the same way as the WQIA. Therefore, analyses of the economic impacts of the WQIA may be important in shaping policies in other states and at the national level. © 2000 Elsevier Science B.V. All rights reserved.
JEL classification:Q20
Keywords:Nonpoint source pollution; Water quality; Nutrient management; Animal waste management
1. Introduction
Runoff and leaching from agricultural fields are a major source of nonpoint source pollution (US En-vironmental Protection Agency, 1996). Contaminated groundwater can have a negative impact when
con-qThis project was partially supported by a cooperative agree-ment with the United States Departagree-ment of Agriculture, Economic Research Service, #43-3AEL-8-80071.
∗Tel.:+1-301-405-8042; fax:+1-301-314-9091.
E-mail address:[email protected] (D. Parker).
sumed, or it can contribute to surface water degrada-tion by moving laterally into streams, lakes or bays. Direct runoff from fields also contributes to surface water degradation. Excess nutrients (nitrogen and phosphorus) in surface waters cause algal blooms and eutrophication, which can lead to problems with odors, fish kills, and other environmental concerns.
Control of nitrogen as an agricultural input has been addressed for both commercial fertilizer and an-imal sources (Trachtenberg and Ogg, 1994). Methods of control that have been addressed include input re-duction, improved irrigation management, and cover
cropping in winter months (Helfand and House, 1995; Wu and Segerson, 1995; Suppalla et al., 1995; Licht-enberg et al., 1994). Since most phosphorus from agricultural lands is transported with sediment, sedi-ment control has been the major focus for phosphorus control. Furthermore, because phosphorus binds to the soil, phosphorus has not been a groundwater con-cern. Thus, the majority of research on phosphorus management has focused on the control of sediments. Sediment control measures that have been assessed include cover crops, buffer strips, no or low till, and the use of polymers (Wu and Babcock, 1998; Hanson et al., 1993; Yiridoe and Weersink, 1998; Parker and Caswell, 1999).
Increased densities in the geographic distribution of animal production have led to excess quantities of nutrients in animal producing regions (Letson et al., 1998). Since most animal waste is applied to the land as a source of nutrients, the intensification of the ani-mal industry has created a situation of gross excesses of certain nutrients being land applied. Recent soil science research has shown that very high phosphorus levels can lead to soluble phosphorus runoff (Sims, 1998). Thus, phosphorus control in animal intense regions must go beyond sediment retention. Recent research on phosphorus management has focused on current and alternative uses of animal wastes (Ja-cobs and Casler, 1979; Govindasamy and Cochran, 1995; Bosch and Napit, 1992; Parker, 1998). This paper considers nitrogen and phosphorus as part of a regional nutrient management strategy.
2. Concerns for the Chesapeake Bay
In August of 1997, the Chesapeake Bay experienced several toxic outbreaks of the microbePfiesteria pis-cicida. The microbe was responsible for several fish kills (each killing thousands of fish) in rivers on the Lower Shore of the Bay. Local fishermen and residents complained of dizziness and memory loss after expo-sure to those waters. The State of Maryland responded by closing several rivers and issuing health warnings to local residents.Pfiesteria had been present in the Neuse River in North Carolina for several years and, thus, there was the beginning of a scientific under-standing of the microbe. Maryland’s rapid response to the microbe furthered scientific inquiry into the life
cycle of the microbe and the conditions under which it becomes a toxic hazard to the waters in which it exists. A scientific panel of experts was convened to as-sess the state of knowledge concerning the microbe (Cambridge Consensus, 1997). This panel concluded that high levels of nutrients in the Bay’s waters, espe-cially phosphorus, had combined with warm waters, high salinity levels, and high fish densities to create an environment conducive to thePfiesteriaoutbreak. Attention immediately focused on the large poultry industry in the region as the most probable source of phosphorus pollution in the waters.
The Chesapeake Bay Program is a federal, state, and local effort to coordinate clean up the Chesa-peake Bay. This program has been working to improve water quality throughout the bay region. One focus of the program has been on agricultural nutrient manage-ment. In 1989, the Maryland Cooperative Extension began a voluntary program to get growers to adopt nu-trient management plans for their land. Adoption of nutrient management guidelines ensures that growers will credit all nutrient sources (commercial and ani-mal waste), when making application decisions. Com-bining source information with information from soil tests, growers only apply that level of nutrients neces-sary to reach their yield goals. If followed, this man-agement strategy would lessen agricultural nonpoint source pollution from excess nutrient applications.
to switch to commercial fertilizers to achieve the ne-cessary nutrient balance. This would entail switching from an essentially free source of nutrients, to having to purchase commercial nitrogen. There was a great deal of opposition by many growers to voluntarily implementing phosphorus based nutrient management plans. The Maryland Water Quality Improvement Act of 1998 (WQIA) will require all growers to imple-ment nutrient manageimple-ment plans that consider both nitrogen and phosphorus in their recommendations.
3. Agricultural impacts of water quality regulation
The WQIA seeks to create environmental and other benefits to the Chesapeake Bay through re-ductions in nonpoint source nutrient pollution. This paper analyzes the economic impacts of the WQIA on agricultural users of nutrients (commercial ferti-lizers or animal manures) for land application, and on Maryland’s poultry growers. The WQIA requires all growers to obtain and follow a nutrient manage-ment plan. The plans will regulate the quantities of nutrients (nitrogen and phosphorus) that may be ap-plied to cropland. Maryland’s large poultry industry is concentrated in a small region on the Eastern Shore of the Chesapeake Bay. The high densities of the in-dustry will force it to find alternatives to local land application for some share of the poultry litter. This paper considers three alternatives to local land appli-cation of poultry litter: compost for wholesale and retail markets, energy conversion, and transport to alternative agricultural lands out of the area. The net economic impacts for each of these alternatives are estimated along with some discussion of the distribu-tion of the impacts. Recognidistribu-tion of the distribudistribu-tion of the impacts allows us to assess the potential for differ-ent policies to lessen the negative impacts. Additional sections of the WQIA are discussed in terms of their ability to shift the distribution of the impacts or to provide partial compensation to those most affected.
3.1. All crop growers
Virtually all crop growers in Maryland will be required to have and implement nutrient management plans. Nearly 1 million acres of Maryland cropland
already have nutrient management plans (Maryland Cooperative Extension Service, 1997). Thus, the WQIA will require that an additional 1.2 million acres implement plans. These plans can be written by private consultants, Maryland Cooperative Extension, or growers that have been certified. The expected cost to write these additional plans is approximately $6.62 million. The plans will need to be updated every few years. For some growers these additional costs may be offset by additional profits from improved management.
3.2. Poultry growers and users of poultry litter
High concentration in the poultry industry has lead to county level excesses of the quantities of available nutrients from animal waste. As a base case, assume that all poultry litter is currently applied as a crop nu-trient source within the county of origin. Implementa-tion of the WQIA will limit the amount of poultry litter that can be used in any given county and, thus, require that some poultry litter be put to alternative uses. The alternative uses to in-county land application that will be considered are: compost, energy production, and transportation for land application outside the county of origin.
The change in value of poultry litter resulting from the WQIA can thus be broken into two parts; the changes in value for in-county land applications, and the additional changes in value under each of the three alternative use scenarios. The changes in value for in-county land application will remain constant across the three alternative use scenarios.
this analysis may overestimate the impacts of the WQIA.
Since final regulations are not yet available and sufficient information on the impacts of the proposed regulations are not available, some simplifying as-sumptions concerning soil phosphorus test levels and nutrient management recommendations are made. For this analysis, assume that nitrogen based nutri-ent managemnutri-ent plans will be required for all land with soil phosphorus test values below some pre-set maximum. For land above this level, the addition of phosphorus will not be allowed.1 The economic impacts at five regulated soil phosphorus levels are estimated: 50 (low), 100 (medium), 150 (optimal), 200 (high), 300 (excessive).
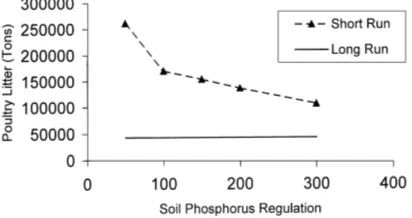
The first step in estimating the expected quantities of excess poultry litter is to estimate how many acres of in-county cropland will be eligible to receive poul-try litter. This is combined with information on the amount of poultry litter produced in each county to estimate the amount of litter that could be used for in-county land application. This number is adjusted to account for the fact that not every crop grower will choose to use poultry litter over commercial fertilizers. For the Lower Shore (the major poultry production region), it is assumed that 20% of the eligible crop acreage will not use poultry litter. This number is increased to 40% for all other Maryland counties. Fig. 1 shows the quantities of poultry litter that will be used as an in-county crop nutrient source under each regulated soil phosphorus level. As the phosphorus restriction is relaxed (moving towards 300), the quantity of in-county litter use increases.
Land with excessive soil phosphorus levels will not be permitted to add any additional phosphorus. Thus, in the long run (15–30 years) land with exces-sive soil phosphorus levels will see phosphorus levels drop. Eventually all cropland will again be available for poultry litter application. The long run, in-county
1It is expected that the final regulations will require the
appli-cation of a phosphorus index on lands above the pre-set soil phos-phorus test level. Application of the phosphos-phorus index is expected to allow some unknown amount of land above this level to ap-ply phosphorus. Thus, the assumptions used in this analysis lead to overestimates of the amount of land for which no phosphorus, and thus no poultry litter, will be allowed. Therefore, this analysis overestimates the economic impacts at any given soil phosphorus test level.
Fig. 1. In-county land application of poultry litter.
application of poultry litter under a phosphorus based nutrient management plan is also shown in Fig. 1. Notice that, in the long run, the regulated soil phos-phorus level does not affect the outcome. The regu-lated soil phosphorus level does determine the amount of time it will take to reach this long-run equilibrium. The amount of poultry litter that must find an alter-native use is equal to the amount produced, less the amount that is land applied in-county. Fig. 2 shows that the amount of excess poultry litter decreases from a high of 270 000 t at a very restrictive level to just over 100 000 t as the regulated soil phosphorus level is relaxed. For the long-run equilibrium, there are still some counties with excess poultry litter and thus about 45 000 t would need to find an alternative use.
3.3. Changes in value of poultry litter
For each of the three alternative poultry litter use scenarios, the same estimate of net changes in poultry litter value for in-county land application is incorporated.
3.4. Estimating the changes in value for in-county land application
The changes in value of poultry litter depend upon the current costs for land application of poultry lit-ter. The current costs depend upon whether poultry growers use their own poultry litter or whether the poultry litter is transported to another crop grower for in-county land application. Currently, 36% of poultry growers use their own poultry litter on their own or on rented land, while 64% sell, give away, or pay to dispose of poultry litter (Michel et al., 1996).
Under the WQIA, the use of some amount of poul-try litter for in-county land application will still be allowed. The change in value of the poultry litter that stays within the county of origin will be the gains in fertilizer savings from using the poultry litter as a nu-trient source on the in-county farms (calculated at the rate recommended by a nutrient management plan), less the losses in fertilizer savings from no longer using poultry litter as a nutrient source (calculated at the current average rate of litter application in the base case), less the costs of marketing the poultry litter, less, for the share of poultry litter currently used on-farm, the costs of loading and transporting the poultry litter to another in-county farm
1πIC=[FN−F0−M−0.36(L+TIC)]QMDβ (1)
where1πIC is the change in value for poultry litter
to be land applied in-county,FN the fertilizer savings
under new law, F0 the fertilizer savings before new
law,M the marketing costs, L the loading costs,TIC
the transportation costs (in-county average),QMD the
quantity of poultry litter produced in Maryland, and
β the share of poultry litter used in-county after new law (β=1 before law).
Note that for poultry litter that is not currently used on the farm of origin there is no change in loading and transportation costs. This is because the poultry litter is already being loaded and transported off-farm and we are assuming an even spatial distribution of poultry litter use within each county. The share of poultry litter that must find an alternative use can be represented as(1−β). As the restriction represented by the regulations gets tighter,(1−β)increases.
The changes in value for the in-county land appli-cation are combined with the estimated net changes in
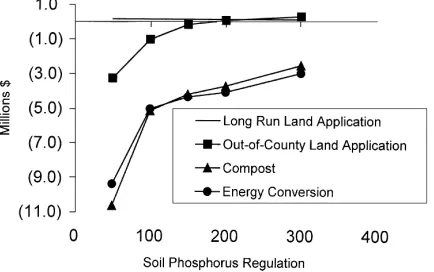
Fig. 3. Annual change in value of poultry litter from implementing the Maryland WQIA.
value from each of the three alternative use scenarios to get a series of net changes in value. The three alter-natives are compost, energy production, and transport for land application out-of-county. The net changes in value for each scenario plus the net changes in value for the long-run equilibrium of land application in and out-of-county are all shown in Fig. 3. Each will be discussed separately below.
3.5. Compost
This scenario assumes a central compost facility is set up in each county and compost is sold in bulk form. The information for the analysis comes from variety of sources (Barker et al., 1990; Brodie et al., 1996; Composting News, 1998; Fritsch and Collins, 1993) and is adapted to Maryland conditions. The change in value for the compost option is the revenues generated from compost sales, less the costs to produce compost, less the losses in fertilizer savings associated with the litter that is no longer used as a crop nutrient source (calculated at the average rate of application), less, for the share of poultry litter currently used on-farm, the costs to load and transport the poultry litter to the compost facility
1πC=[RC−CC−F0−0.36(L+TIC)]
×QMD(1−β)αC (2)
where1πC is the change in value for poultry litter
to be composted,RCthe revenue from compost sales,
CCthe costs to produce compost, andαCthe share of
The variableαCrepresents the share of the excess
poultry litter that is composted. If all excess poultry litter were composted, αC = 1. The net change in
value for the industry if all excess poultry litter is composted is1πIC+1πC(Fig. 3). As the strictness
of the restriction on soil phosphorus is increased (β
decreases), the net costs of this option (αC = 1)
rises from about $3 million to nearly $11 million. As the restriction is increased, more poultry litter must be composted, more compost is produced, and local markets are saturated. This market saturation causes a decrease in the price of compost. Thus, the decrease in value of poultry litter results from the increase in quantities of poultry litter to be composted and from a decrease in the sale price of compost.
3.6. Energy conversion
This scenario assumes one central energy produc-tion facility is located in the center of the poultry producing region, Salisbury, MD. The facility burns poultry litter for electricity production and sells the phosphorus rich ash as an input to commercial fer-tilizer production. The information is taken from a study of poultry litter energy conversion in the United Kingdom (Dagnall, 1993), and adapted to US condi-tions with information from the Maryland Environ-mental Services study of energy conversion options at the Eastern Shore Correctional Facility (Maryland Environmental Service, 1998).
The change in value for the energy conversion option is the revenues generated from the sales of electricity and nutrient rich ash, less the costs to pro-duce the electricity, less the losses in fertilizer savings associated with the litter that is no longer used as a crop nutrient source (calculated at the average rate of application), less, for the share of poultry litter cur-rently used on-farm, the costs to load and transport the poultry litter to a centralized facility, less, for the poultry litter currently used off-farm, the difference in the transportation costs between in-county use and transportation to a centralized energy facility
1πE=[RE−CE−F0−0.36(L+TE)
−0.64(TE−TIC)]QMD(1−β)αE (3)
where1πE is the change in value for poultry litter
from energy conversion,RE the revenue from energy
and ash sales, CE the cost to produce energy,TE the
transportation costs to energy facility, andαEthe share
of excess poultry litter going to energy.
The variableαE represents the share of the excess
poultry litter that is used for energy production. If all excess poultry litter were used for energy production,
αE=1. The net change in value for the industry if all
excess poultry litter is used for energy conversion is
1πIC+1πE (Fig. 3). As the strictness of the
restric-tion on soil phosphorus is increased (β decreases), the net costs of this option(αE=1), rise from about $3.5
million to over $9 million. Because the price of elec-tricity does not change (it only represents a very small part of the US electricity market), the energy conver-sion option is favorable to the compost option in the very restrictive cases.
If we were allow the share of poultry litter that goes to each option to vary(αE ≤ 1, αC ≤ 1),we
would expect that poultry litter would be used for the production of compost until it drove down the price of compost such that the value of another unit of poultry litter composted is just equal to the value of poultry litter as an energy source.
3.7. Transport for out-of-county land application
This scenario uses a least cost travel model to dis-tribute poultry litter to available lands in neighboring counties. It only looks at counties in Maryland. Thus, for the restrictive cases, poultry litter is shipped to Southern Maryland, Central Maryland, and, eventu-ally, Western Maryland, and it is not considered pos-sible to ship poultry litter to Delaware or Virginia.2 As with the in-county land application, it is assumed that 40% of the available land not on the Lower Shore will choose not to use poultry litter.
The change in value for out-of-county land ap-plication is the gains in fertilizer savings from out-of-county land application (calculated at the nu-trient management application rate), less the losses in fertilizer savings from the litter that is no longer used in-county (calculated at the average rate of applica-tion), less the costs to market the litter, less, for the share of poultry litter currently used on-farm, the costs to load and transport the litter for land application
2 Both Delaware and Virginia have high concentrations of poultry
out of the county, less, for the share of poultry litter currently used off-farm, the difference in the costs to transport the litter in-county versus out-of-county
1πL=[FN−F0−ML−0.36(L+TL) −0.64(TL−TIC)]QMD(1−β)
×(1−αC−αE) (4)
where1πL is the change in value for poultry litter
land applied out-of-county, ML the costs to
mar-ket out-of-county, TL the transportation costs to
out-of-county sites.
If all excess poultry litter were used for land appli-cation out of the county of origin,αC=0 andαE=0.
The net change in value for the industry if all excess poultry litter is used for out-of-county land applica-tion is1πIC+1πL(Fig. 3). For very low restrictions
(βclose to 1), the net change in value from this option (αC=0 andαE=0), produces a net gain of approxi-mately $300 000. This gain results from two forces. First, at a low regulatory level very little poultry litter is transported further than is currently the case. Sec-ond, the law requires growers to adhere to nutrient management plans. Current rates of application are so high as to essentially waste nutrients in the litter. Un-der nutrient management plans, less poultry litter is applied per acre and more acres benefit. As the strict-ness of the restriction on soil phosphorus is increased (βdecreases), the net costs of this option (αC=0 and
αE=0) rises to over $3 million.
The long-run equilibrium of poultry transport for out-of-county land application also produces a small net gain (Fig. 3). Again, this is because long-run application under phosphorus based nutrient manage-ment more efficiently utilizes the nutrients available in poultry litter.
The in-county use equation can be combined with the three alternative uses to create one decision model for the industry
1πIN=1πIC+1πC+1πE+1πL (5)
where1πINis the change in value of poultry litter for the poultry industry.
Given the dominance of the out-of-county land ap-plication option over the other two options (compost and energy conversion), we would expect a corner solution such that, αC =0 and αE = 0. If land
ap-plication restrictions became very tight, the marginal
cost of transporting another unit of poultry litter a very long distance may become so high that the com-post option may be optimal for some share of the excess poultry litter. This does not seem likely under the set of regulations under consideration.
4. Distribution of impacts
The distribution of costs between groups of grow-ers may vary significantly across the alternative use scenarios. In the cases of compost and energy pro-duction, the majority of the costs are almost certain to be borne by the poultry growers. A small number of growers may still be able to use poultry litter on their own fields and these growers may see little or no impact. Furthermore, some litter will be used on other fields within the county. This litter will produce fertilizer savings. It is unclear who will benefit from those fertilizer savings. If a strong market for poultry litter were to arise, the poultry growers could capture the fertilizer savings from the in-county use. If a weak market exists, the benefits from the fertilizer savings may go to the crop grower.
For the transport of litter for land application out-side the county option, it is less clear who will bear the costs and who will receive the benefits (of fertilizer savings). If a strong market arises, then poultry grow-ers will capture much of the fertilizer savings. Under these market conditions, poultry growers would bear the net costs shown in Fig. 3 (i.e. $50 000 for a phos-phorus soil test restriction at 150), and crop growers will essentially break-even. If there is a weak market for poultry litter, poultry growers could bear signifi-cantly higher costs, while crop growers could make significant profits. With a weak market for poultry lit-ter, at the phosphorus soil test restriction of 150 sce-nario, poultry growers could face costs of up to $4.7 million while crop growers would receive benefits of $3.8 million. This uncertainty suggests a need to pro-vide poultry growers either monetary aide or assis-tance in developing a competitive market for poultry litter as a fertilizer source outside its county of origin.
5. Actions to mitigate WQIA impacts
management. To offset the costs of having nutrient management plans written, growers can apply for a cost share of 50%, up to $3 per acre. Furthermore, there are funds to increase the number of Maryland Cooperative Extension personnel who assist in writing plans.
The major expense to poultry growers will be pur-chasing additional commercial fertilizer for producing their crops (almost 75% of the net costs shown ear-lier). The WQIA provides for a 50% tax credit, up to $4500 per grower per year for up to 3 years, to help offset the costs of switching from poultry litter to commercial fertilizer.
The WQIA also does three things that attempt to as-sist in the creation of a strong market for poultry litter. (1) To facilitate the flow of information in the market (help willing buyers find willing sellers), an animal manure matching service will be set up at the Mary-land Department of Agriculture. This service will allow buyers and sellers to call a toll free telephone number and be matched with others in their area who are looking to sell or buy poultry litter. (2) To help off-set the costs of converting from commercial fertilizer to poultry litter, the WQIA provides a 100% tax de-duction for the costs of manure spreading equipment in their year of purchase. This should help reduce the high entry cost barrier to use of animal manures. (3) The WQIA provides funds to match a voluntary industry contribution to promote poultry litter move-ment. The Poultry Litter Transport Pilot Project will use these funds to cost share, up to $20 t−1, the costs
of transporting poultry litter from poultry growing sites to alternative uses. These funds should provide an extra measure of profit to the poultry litter market that may help to compensate crop growers for some of the uncertainty involved in changing fertilizer sources.
6. Conclusions
Overall, the WQIA does a good job of balancing the need for improvements in environmental quality with the need for Maryland to maintain a healthy agricultural economy. While the Act attempts to miti-gate some of its impacts on poultry growers with cost share programs and market stimulation, there is still the potential for some relatively large economic impacts on some growers. Some impacts not yet
con-sidered include; the possibility of changes in cropping patterns that may arise as a result of a shift in the relative costs of different nutrients, the impacts on other animal operations (specifically dairy) in other parts of the state, the impacts on organic producers, and the impacts on the horticultural industry.
References
Barker, J.C., Carter, T.A., Safley, C.D., Safley Jr., L.M., Warren, S.L., Westerman, P.W., Zublena, Z.P., 1990. Composting poultry litter — economics and marketing potential of a renewable resource. North Carolina Agricultural Research Service No. 8556122. North Carolina State University, Raleigh, NC. Bosch, D.J., Napit, K.B., 1992. Economics of transporting poultry
litter to achieve more effective use as fertilizer. J. Soil Water Conserv. 47 (4), 342–346.
Brodie, H.L., Carr, L.E., Steinhilber, P.M., Teffeau, K.M., 1996. Poultry litter compost production, processing, evaluation and marketing for use as nursery growing media: a means of distributing excess nutrients. Final Report, CBIG contract #14-96-110CBG013. Maryland Department of Natural Resource, Annapolis, MD.
Cambridge Consensus, 1997. Land-based pollution and toxic Dino-flagellates in Chesapeake Bay. Forum. University of Maryland, Center for Environmental Science, Cambridge, MD.
Composting News, 1998. National Compost Prices, Vol. 7, No. 5. McEntee Media Corp., Cleveland, OH, p. 4.
Dagnall, S.P., 1993. Poultry litter as a fuel. World’s Poultry Sci. J. 49 (2), 175–177.
Fritsch, D.A., Collins, A.R., 1993. The economic feasibility of poultry litter composting facilities in Eastern West Virginia. Agric. Resour. Econ. Rev. 22 (2), 199–209.
Govindasamy, R., Cochran, M.J., 1995. The feasibility of poultry litter transportation from environmentally sensitive areas to delta row crop production. Agric. Resour. Econ. Rev. 24 (1), 101– 110.
Hanson, J.C., Lichtenberg, E., Decker, A.M., Clark, A.J., 1993. Profitability of no-tillage corn following a hairy vetch cover crop. J. Prod. Agric. 6 (3), 432–437.
Helfand, G.E., House, B.W., 1995. Regulating nonpoint source pollution under heterogeneous conditions. Am. J. Agric. Econ. 77 (4), 1024–1032.
Jacobs, J.J., Casler, G.L., 1979. Internalizing externalities of phos-phorus discharges from crop production to surface water: effluent taxes versus uniform reductions. Am. J. Agric. Econ. 61 (2), 309–312.
Letson, D., Gollehon, N., Breneman, V., Kascak, C., Mose, C., 1998. Confined animal production and groundwater protection. Rev. Agric. Econ. 20 (2), 348–364.
Lichtenberg, E., Hanson, J.C., Decker, A.M., Clark, A.J., 1994. Profitability of legume cover crops in the mid Atlantic region. J. Soil Water Conserv. 49 (6), 582–585.
Agriculture, Maryland Nutrient Management Program, 1997. Annual Report. College of Agriculture and Natural Resource, University of Maryland, College Park, MD.
Maryland Environmental Service, 1998. Estomin, S., Walters, G., Prasad, A., Ross, J. (Eds.), The Engineering and Economic Feasibility of Using Poultry Litter as a Fuel to Generate Electric Power. Maryland’s Eastern Correctional Institute, Annapolis, MD.
Michel, K., Bacon, J.R., Gempesaw II, C.M., Martin Jr., J.H., 1996. Nutrient management by Delmarva poultry growers: a survey of attitudes and practices. FREC RR96-01. Department of Food and Resource Economics, College of Agricultural Sciences, University of Delaware, Newark, DE.
Parker, D., 1998. Alternative uses for poultry litter. Economic Viewpoints 3. Department of Agricultural and Resource Economics, University of Maryland, College Park, MD. Parker, D.D., Caswell, M.F., 1999. Technological innovation
to remove water pollutants. In: Casey, F., Schmitz, A., Swinton, S., Zilberman, D. (Eds.), Flexible Incentives for the Adoption of Environmental Technologies in Agriculture. Kluwer Academic Publishers, Norwell, MA, pp. 249– 262.
Sims, T., 1998. Soil testing for phosphorus: environmental uses and implications. Bulletin No. 389, SERA-IEG 17. University of Delaware, Newark, DE.
Suppalla, R.J., Selley, R.A., Bredeweg, S., Watts, D., 1995. Adoption of nitrogen and water management practices to improve water quality. J. Soil Water Conserv. 50 (1), 77–82. Trachtenberg, E., Ogg, C., 1994. Potential for reducing nitrogen
pollution through improved agronomic practices. Water Resour. Bull. 30 (6), 1109–1118.
US Environmental Protection Agency, 1996. Environmental indicators of water quality in the United States. EPA 841-R-96-002. Office of Water, Washington, DC.
Wu, J., Babcock, B.A., 1998. The choice of tillage, rotation, and soil testing practices: economic and environmental implications. Am. J. Agric. Econ. 80 (3), 494–511.
Wu, J., Segerson, K., 1995. The impact of policies and land characteristics on potential groundwater pollution in Wisconsin. Am. J. Agric. Econ. 77 (4), 1033–1047.