Land use effects on soil quality in a tropical
forest ecosystem of Bangladesh
K.R. Islam
∗, R.R. Weil
Department of Natural Resource Sciences and Landscape Architecture, 1103 H.J. Patterson Hall, University of Maryland, College Park, MD 20742, USA
Received 16 July 1998; received in revised form 2 March 1999; accepted 18 October 1999
Abstract
Human population pressures upon land resources have increased the need to assess impacts of land use change on soil quality. In order to assess effects of land use changes on soil quality properties in a tropical forest ecosystem of Bangladesh, soil samples were collected from adjacent well-stocked Shorea robusta natural forest, land reforested with Acacia, grassland and cultivated land. Land use/land cover changes (degradation of natural forest and subsequent cultivation of soils) resulted in surface compaction and significant decreases in silt and clay contents, porosity and aggregate stability, N, fulvic and labile C, and microbial biomass C. Maintenance respiration rates increased in comparison to the soils under natural forest. Use of soil deterioration index showed that soil quality deteriorated significantly (−44%) under cultivation, while in sites revegetated with fast-growing Acacia or grasses, it improved by 6–16%. Degradation of soil quality may have resulted from increased disruption of macroaggregates, reductions in microbial biomass, and loss of labile organic matter due to fire, deforestation, tillage and accelerated erosion. Improvement in soil quality and enhanced biological activity at reforested and grassland sites demonstrated the inherent resilience of these soils once revegetated with highly adaptable and fast growing Acacia (Acacia sp.) and grass species. © 2000 Elsevier Science B.V. All rights reserved.
Keywords: Deforestation; Cultivation; Reforestation; Soil quality; Soil organic matter; Deterioration index
1. Introduction
The complex integration of the primary natural resources — soil, water and vegetation, is vital for maintaining terrestrial ecosystem functions and pro-ductivity. Human poverty and a continuous decline in the amount of agricultural land per person have led to indiscriminate exploitation of natural resources in de-veloping countries of the world (Mahtab and Karim, 1992). As a result of increasing demand for firewood,
∗Corresponding address. Tel.:+1-301-405-8922; fax:+1-301-314-9041.
E-mail address: [email protected] (K.R. Islam)
timber, pasture, shelter and food crops, natural land covers, particularly tropical forests, are being de-graded or converted to cropland at an alarming rate (Hall et al., 1993). These trends have led to a need to assess the impacts of deforestation and conversion on soil quality.
Land use changes, especially cultivation of deforested land may rapidly diminish soil quality, as ecologically sensitive components of the tropical forest ecosystem are not able to buffer the effects of agricultural practices. As a result, severe deterioration in soil quality may lead to a permanent degradation of land productivity (Kang and Juo, 1986; Nardi et al., 1996; Islam et al., 1999). Assessment of soil
properties upon conversion of natural forests for vary-ing agricultural purposes is of utmost importance to detect early changes in soil quality. The objectives of the present study were: (i) to assess and compare the changes in the biological, chemical and physical properties of soils in response to land use changes; and (ii) to explore the relationships among changes in different soil properties.
2. Materials and methods
2.1. Description of the study area
The study area (24◦00′–24◦05′N and 90◦18′–90◦ 24′E) was originally covered with tropical deciduous forests of Shorea robusta, Gaertn. f. (local name ‘Sal’) in the Gazipur district, Dhaka division, Bangladesh. The natural forests have been exploited through clear felling to meet the increasing demands for firewood, timber and other construction materials. Over the years, people living in the surrounding villages have often encroached upon and cultivated agricultural crops in the clear felled forest land without using any soil conservation practices. These intense human activities have hampered the regeneration of existing residual vegetation on clear-felled and degraded refor-ested lands. Wildlife has almost disappeared from the encroached upon forest area. In areas where the forest has been under regular protection the natural vegeta-tion consists of well-stocked S. robusta locally mixed with Albizia spp., Samanea saman, Dalbergia sissoo,
Bombax ceiba, Mullacana brucifera and patches of
exotic Acacia reforestation. The distribution of clear
Table 1
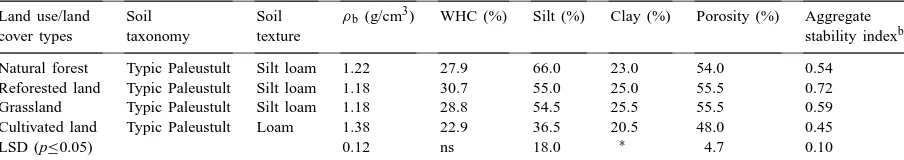
Effect of land use/land cover type on selected physical properties of adjacent areas of similar soils in Dhaka division, Bangladesha
Land use/land Soil Soil ρb (g/cm3) WHC (%) Silt (%) Clay (%) Porosity (%) Aggregate
cover types taxonomy texture stability indexb
Natural forest Typic Paleustult Silt loam 1.22 27.9 66.0 23.0 54.0 0.54 Reforested land Typic Paleustult Silt loam 1.18 30.7 55.0 25.0 55.5 0.72 Grassland Typic Paleustult Silt loam 1.18 28.8 54.5 25.5 55.5 0.59 Cultivated land Typic Paleustult Loam 1.38 22.9 36.5 20.5 48.0 0.45
LSD (p≤0.05) 0.12 ns 18.0 ∗ 4.7 0.10
aMeans of duplicate analysis from each of two sites for each land use/cover typeρ
b=Bulk density, SL=Silt loam, L=Loam, and
WHC=Water holding capacity.
bTurbidity ratio.
∗Indicates significant trends at p ≤0.10.
felled areas and encroaching cultivation are related to the location of crude road and trails, but otherwise are randomly scattered and do not follow any mapped to-pographic or soil variations. Early reports (Brammer, 1996) indicate that the areas sampled were uniformly under S. robusta dominated natural forest up to the beginning of encroachment in the 1960s.
The climate of the area is subtropical monsoon with pronounced hot, wet, and cool, dry seasons. The mean annual temperature is 26◦C, while the mean annual rainfall is about 180 cm. Relative humidity ranges between 65 and 96%. The soils are identified as Red-Brown Terrace soils according to Bangladesh soil classification system (Brammer, 1996), which are classified in the US Soil Taxonomy as fine loamy or clayey, oxic, hyperthermic, acidic, Typic Paleustults and in the FAO-UNESCO system as Orthi-Ferric Acrisols. These soils are imperfectly to moderately drained and occur on undulating to flat uplands.
2.2. Soil sampling and processing
In January 1992, surface soil samples were col-lected from two sites under each of four adjacent land use/land cover types: (1) well-stocked S. robusta forest, (2) reforestation (with Acacia auriculiformis, L. for 5 years or A. minijiri, L. for 7 years in pure stands at 2 m by 2 m spacing), (3) grass (Napier or
Saccharum spontaneous for 21 years) and, (4)
mixed to obtain a composite sample that was sealed in a plastic bag. Field-moist soil samples were gently sieved through a 2 mm mesh to remove stones, roots, and large organic residues and sealed in plastic bags to store at 4◦C. Soil biological analyses were carried out within 20 days of sampling after an overnight ac-climatization period at room temperature.
2.3. Soil physical and chemical properties
Soil bulk density (ρb) was determined by the core method and total porosity was calculated assuming a particle density of 2.65 g cm−3. Gravimetric water holding capacity (WHC) of soil was measured by the tube method (Wani et al., 1994). Soil particle size analysis was done by the hydrometer method. Aggre-gate stability (AS) was determined on 1–2 mm sieved air-dried soil aggregates by a modified turbidimetric method (Williams et al., 1966). In the turbidimetric method, 1.0 g oven-dried equivalent (ODE) amount of aggregates was placed in 35 ml polycarbonate tubes. About 20.0 ml distilled water was slowly added down the edge to the aggregates which were then shaken horizontally at 100 rpm for 2 min in the capped tubes. The tubes were turned upright and the dispersed soil was allowed to settle for 4 min. A 5.0 ml aliquot of the suspension (from the middle depth of the suspen-sion) was drawn by a calibrated pipette, and the trans-mittance of the suspension at 630 nm was measured using distilled water as a blank. The suspension was poured back slowly into the polycarbonate tubes and then shaken again at 100 rpm for 5 min. The dispersed soil was again allowed to settle for 4 min. A 5.0 ml aliquot of the suspension was drawn by a calibrated pipette to measure the transmittance. The turbidity ra-tio (second transmittance/first transmittance) provided a measure of the water-stability of the aggregates.
Soil pH was determined in 1:2.5 soil–water slurry, using a combination glass electrode. Total carbon (CT) and nitrogen (NT) contents were determined on finely grounded air-dried soils by dry combustion in a LECO model CHN-600 analyzer (LECO Corp. St. Joseph, MI).
To measure extractable humic (CHA) and fulvic acid (CFA) C fractions, 1.0 g ODE of air-dried soil samples was shaken overnight with 0.5M NaOH (pH 13.5). The soil suspensions were centrifuged and
filtered through 0.4mm Millipore® membranes to ob-tain soil-free extracts. The extracts were acidified with concentrated H2SO4to pH 2 for precipitation of CHA, which was subsequently separated from the soluble CFAby centrifugation and filtration. The precipitated CHA was solubilized in 0.05M NaHCO3and purified from silica and ash contents by repeated dissolution and precipitation. Both CHAand CFAwere determined colorimetrically by a rapid microwave digestion method (Islam and Weil, 1998).
Labile organic C (CL) fractions, based on KMnO4 reaction with soil modified from Blair et al. (1995) were measured as follows: 1.0 g ODE samples of air-dried soil were placed in clean 50 ml screw-capped centrifuge tubes with 10 ml of 0.16M KMnO4 so-lution, then shaken at 250 rpm using a horizontal shaker for 60 min. After shaking, the contents were centrifuged at 3600×g for 5 min to obtained soil-free
aliquot. The oxidation of organic C was determined by change in concentration of KMnO4in solution as measured by a spectrophotometer at 565 nm, assum-ing that 1 mM MnO4is consumed in the oxidation of 0.75 mM of organic C (Blair et al., 1995). The range for the standards was chosen to cover the sample range from 0 to 0.16M KMnO4solutions.
2.4. Soil biological properties
Total microbial biomass (CTMB) was determined by the chloroform fumigation incubation method (Jenk-inson and Powlson, 1976), modified as follows: about 20 g ODE of field-moist soil at 60% WHC was placed in each of two 50 ml glass beakers. The soil in one beaker was fumigated with ethanol-free chloroform for 24 h at room temperature in the dark under a vac-uum in a desiccator lined with moist paper towels. Af-ter removing the chloroform vapors by three repeated evacuations of the desiccator, both fumigated and un-fumigated soils were reinoculated with 0.5 g ODE of field-moist soil. Each soil sample was placed in a 1 l mason jar along with a glass vial containing 10 ml of distilled water to maintain humidity and a plastic vial containing 10 ml of 1M NaOH to trap evolved CO2. The jars were sealed and incubated in the dark for 10 days at 25±1◦C. The C
where FCis the ‘flush’ of CO2(i.e., evolution of CO2 in fumigated soil minus the evolution of CO2 in un-fumigated soil) and KC is the fraction (0.45) of the microbial biomass C mineralized as CO2for 10 days incubation at 25◦C.
Active microbial biomass (CAMB) of soil was mea-sured by the glucose-nutrient induced respiration method (Van de Werf and Verstrate, 1987) and modi-fied as follows: about 20 g ODE of soil at 60% WHC was placed in each of two 50 ml glass beakers. The soil in one beaker was amended with glucose and nu-trients (120 mg glucose; 30 mg yeast extracts; 45 mg NH4Cl; 12 mg MgSO4·7H2O; and 10 mg KH2PO4). Each soil sample was placed in a 500 ml-mason jar along with a glass vial containing 10 ml of distilled water to maintain humidity and a plastic vial contain-ing 5.0 ml of 0.5M NaOH to trap evolved CO2. The jars were sealed and incubated in the dark for 10 h at 20◦C. The CAMBwas measured as follows:
CAMB=(yCO2–C10amend −yCO2–C10unamend)AC, (2)
where yCO2–C10amendand yCO2–C10unamendare the evolution of CO2from the glucose-nutrient-amended and unamended soils during a 10 h incubation, respec-tively, and AC is the coefficient (0.283) to convert CO2–C into CAMB(Van de Werf and Verstrate, 1987). Basal Respiration (BR) was measured as the CO2-evolution from unamended field-moist soil ad-justed to 60% WHC for an incubation period of 10 days at 25±1◦C in the dark. The BR was calculated as follows:
BR= (CO2–Csoil−CO2–Cair)
10 days , (3)
where CO2–Csoil is the evolution of CO2 from soil and CO2–Cairis the atmospheric CO2absorbed by 1M NaOH in a 1 l blank mason jar.
Several metabolic quotients (CTMB Corg−1; CAMB Corg−1; and CAMB CTMB−1) were calculated. Spe-cific maintenance respiration rates (qCO2) were calcu-lated as BR per unit of total (BR CTMB−1) and active (BR CAMB−1) microbial biomass C (Anderson and Domsch, 1990).
2.5. Calculation of soil deterioration indices
The soil deterioration index (Adejuwon and Ekanade, 1988) was computed on the assumption that the status of individual soil properties under re-forestation, grass and cultivation were once the same as that of adjacent soils under the well-stocked S.
robusta forest prior to conversion. The difference
be-tween mean values of individual soil properties under reforestation, grass and cultivation compared to base-line values of soil properties under the well-stocked
S. robusta forest was computed and expressed as a
percentage of the mean value of individual properties. These percent changes were then averaged across all soil properties to compute the soil deterioration in-dex. Values for pH, C/N ratio, BR, silt and clay were not included in this calculation because the criteria of ‘more is better’ is not true or is uncertain over the range of values in the study.
2.6. Statistical analysis
One-way analyses of variance (ANOVAs) proce-dures were used to compare the effects of different land use/land cover managements on biological, chemical and physical properties of soil. The LSD procedure was used to separate the means of the soil properties at p≤0.05. Values of soil properties that differed at p≤0.10 were considered significant trends.
3. Results and discussion
3.1. Effects on soil physical, chemical and biological properties
Soils under cultivation had higher bulk densi-ties (ρb) than the adjacent soils under well-stocked
S. robusta natural forest, Acacia reforestation and
soils, but higher in the reforested soils. The grassland soils had about the same aggregate stability as the naturally forested soils. Greater residual sand content combined with poorer aggregation probably accounts for the higher bulk density and decreased porosity un-der cultivation in comparison with the natural forest, reforested and grassland soils (Table 1).
Enhanced aggregate stability of reforested soils is consistent with greater input of labile C contributed by the high quality litter-fall and root exudates in this young, rapidly growing legume-dominated forest sys-tem. Both extracellular polysaccharides produced dur-ing decomposition of labile organic matter and fungal hyphae associated with the extensive perennial roots systems of Acacia and grass could be important bind-ing agents for macroaggregates (Tisdale and Oades, 1982; Elliott, 1983). In contrast, organic matter in cul-tivated soils has less physical protection than that in the uncultivated soils because tillage periodically breaks up macroaggregates and exposes previously protected organic matter in soil macroaggregates (Nardi et al., 1996).
The pH values of the natural forest, reforested, grassland and cultivated soils varied significantly from 4.9 to 5.6 (Table 2). Natural forest and reforested soils were significantly more acidic than those of the grassland and cultivated sites. The pre-weathered parent materials, amphoteric nature of aluminum in these tropical soils, and the intense leaching of basic cations during the monsoons are all the likely con-tributing factors to the naturally very acid pH levels in these soils (Hassan and Majumder, 1990). Ash from biomass burning on the grasslands, and to a lesser
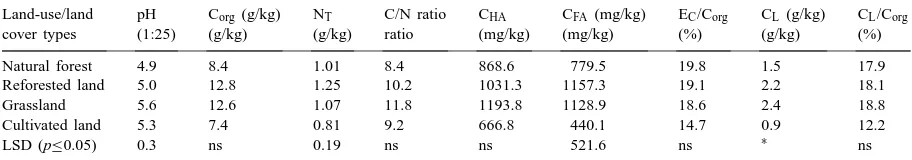
Table 2
Effect of land use/land cover type on soil pH, total nitrogen and selected chemical properties related to organic carbon in adjacent areas of similar soils in Dhaka division, Bangladesha
Land-use/land pH Corg(g/kg) NT C/N ratio CHA CFA(mg/kg) EC/Corg CL (g/kg) CL/Corg
cover types (1:25) (g/kg) (g/kg) ratio (mg/kg) (mg/kg) (%) (g/kg) (%)
Natural forest 4.9 8.4 1.01 8.4 868.6 779.5 19.8 1.5 17.9
Reforested land 5.0 12.8 1.25 10.2 1031.3 1157.3 19.1 2.2 18.1
Grassland 5.6 12.6 1.07 11.8 1193.8 1128.9 18.6 2.4 18.8
Cultivated land 5.3 7.4 0.81 9.2 666.8 440.1 14.7 0.9 12.2
LSD (p≤0.05) 0.3 ns 0.19 ns ns 521.6 ns ∗ ns
aMeans of duplicate analysis of two sites for each land use/cover type C
org=Total organic C, NT=Total N, CHA=Humic acid C,
CFA=Fulvic acid C, EC=Extracted C (CHA+CFA), CL=KMnO4oxidizable C. pH measured in 1:2.5 soil–water suspensions.
∗Indicates significant trends at p ≤0.10.
degree on the cultivated land could have returned enough base-forming cations to increase pH of the surface soil, at least temporarily.
Total nitrogen (NT) content of soils under culti-vation were lower compared to levels in the natural forest soils. In contrast, NT in Acacia reforested soils was significantly higher than that in the natural forest soils (Table 2), as might be expected in a sys-tem dominated by nitrogen fixing trees. The total C (Corg) levels tended to be higher in the reforested and grassland sites, but the variability was too high for statistical significance. The C/N ratios did not vary among the land use/land cover types. Comparatively less fulvic (CFA) C fraction was extracted from soils under cultivation than in the adjacent soils under natural forest, reforestation and grass. The 77–156% reduction in soluble CFA content was far greater than that for humic (CHA) C fraction which was reduced by 30–79%. Total extractable C (CHA and CFA) as a proportions of Corgalso tended to be lower in the cul-tivated soils. Labile C (CL) as measured by KMnO4 oxidation was reduced by 67–167% in soils under cultivation compared to that under natural forest, re-forestation and grass. The CL as a proportion of Corg was also tended to be lower in cultivated soils.
are probably due to higher litter production and N fix-ation by the leguminous Acacia (Islam et al., 1999). Also, increased contact between microorganisms and incorporated plant residues likely resulted in faster de-composition of organic matter and loss of Corgin the cultivated soils. The trend towards lower CL in the cultivated soils is probably due to breakdown of ag-gregates and greater organic matter oxidation follow-ing deforestation and continuous tillage (Blair et al., 1995; Nardi et al., 1996).
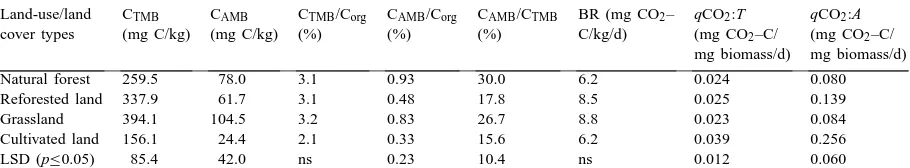
The values of most of the measured biological prop-erties were significantly lower in the cultivated soils than in the natural forest, reforested and grass land soils (Table 3). The total microbial biomass (CTMB) was consistently about 40% lower in soils under cul-tivation than soils under natural forest. The effect was more pronounced (69% reduction) on active microbial biomass (CAMB). In contrast, CAMB contents (and to a lesser degree the CTMB) in the grassland soils were higher than in the natural forest sites. Active microbial biomass as a proportion of Corg (CAMB Corg−1) was higher in the soils under natural forest and grassland than in soils under either reforestation or cultivation. Microbial biomass C is usually limited in size by the availability of labile C and is sensitive to variations in land-use and soil management practices, so a higher proportion of microbial biomass (CTMBor CAMB) is an indication of aggradation of available organic C in soils under reforestation and grass (Anderson and Domsch, 1985; Powlson et al., 1987).
Basal respiration (BR) rates did not vary signifi-cantly among sites, but tended to be somewhat higher in the soils under reforestation and grass. High rates of
Table 3
Effect of land use/land cover type on selected biological soil properties related to microbial biomass and activity in adjacent areas of similar soils in Dhaka division, Bangladesha
Land-use/land CTMB CAMB CTMB/Corg CAMB/Corg CAMB/CTMB BR (mg CO2– qCO2:T qCO2:A
cover types (mg C/kg) (mg C/kg) (%) (%) (%) C/kg/d) (mg CO2–C/ (mg CO2–C/
mg biomass/d) mg biomass/d)
Natural forest 259.5 78.0 3.1 0.93 30.0 6.2 0.024 0.080
Reforested land 337.9 61.7 3.1 0.48 17.8 8.5 0.025 0.139
Grassland 394.1 104.5 3.2 0.83 26.7 8.8 0.023 0.084
Cultivated land 156.1 24.4 2.1 0.33 15.6 6.2 0.039 0.256
LSD (p≤0.05) 85.4 42.0 ns 0.23 10.4 ns 0.012 0.060
aMeans of duplicate analysis of two sites for each land use/cover type C
org=Total organic C, CTMB=Total microbial biomass,
CAMB=Active microbial biomass, BR=Basal respiration, qCO2:T and qCO2:A Specific maintenance respiration rates for CTMBand CAMB,
respectively.
BR can occur either as a result of large pool of labile C substrates or rapid oxidation of a smaller pool. Thus high BR may indicate ecological stress and degrada-tion or a high level of ecosystem productivity. A more clearly interpretable parameter is the rate of BR per unit of microbial biomass (qCO2), high levels of which have been associated with ecosystem stresses (Kill-ham, 1985; Islam and Weil, 2000). The qCO2 rates were similar in all soils under perennial vegetation, but significantly higher in the cultivated soils (Table 3). Enhanced microbial activities in soils under natural forest, reforestation and grass are related to greater levels of available organic C. Thus, reforestation of the degraded lands not only increased the CTMB and CAMBcontents, but also increased the labile fraction of Corg. As a result, soil microbial communities under natural forest, reforestation and grass were more bio-logically active and less stressed than in the cultivated soils.
Relatively higher rates of qCO2 for the cultivated soils suggest that intense competition for the available C may favor those microorganisms which use more C energy for cell integrity and maintenance than for growth under perturbed or disturbed ecosystems. As a result, cultivated soils favor bacteria-based food webs which have low C assimilation efficiencies and faster turnover rates than the more efficient fungal-based food webs dominant in untilled or natural ecosystems (Hendrix et al., 1986).
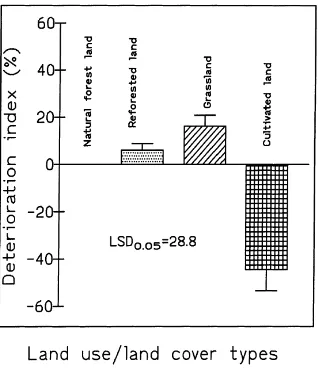
in-Fig. 1. Deterioration index for different land use/land cover types in a tropical forest ecosystem in Dhaka division, Bangladesh. Each deterioration index was calculated as the sum of the percentage deviations ofρb, AS, Corg, NT, CTMB, CAMB,qCO2:A, CFA and
CL from their respective values under natural forest.
dex (−44%) than soils under the other land use types. In contrast, the deterioration indices for soils under grass and reforestation with fast-growing Acacia were actually positive (6–16%), indicating no significant deterioration, or even an improvement compared to natural forest. These soil deterioration indices clearly show that significant deterioration occurs in soil qual-ity when these natural forest systems are degraded and converted for agriculture without the use of appropri-ate soil and wappropri-ater conservation practices.
Table 4
Standardized linear relationship (r) among selected biological, chemical and physical properties of soils under different land use/land cover types in Dhaka division, Bangladesha
Standardized variables ρb AS Corg NT CFA CL
AS −0.81*
Corg −0.70ns 0.74*
NT −0.72* 0.87** 0.49ns
CFA −0.93*** 0.88** 0.87** 0.74*
CL −0.90** 0.81* 0.89** 0.69ns 0.99***
CTMB −0.89** 0.74* 0.73* 0.74* 0.93** 0.95***
CAMB −0.83** 0.46ns 0.64ns 0.41ns 0.78* 0.81**
qCO2:A 0.85** −0.47ns −0.37ns −0.52ns −0.68ns −0.67ns
aρ
b=Bulk density, AS=Aggregate stability, Corg=Total organic C, CHA=Humic acid, CFA=Fulvic acid, CL=KMnO4 oxidizable C,
CTMB=Total microbial biomass, CAMB=Active microbial biomass, BR=Basal respiration, and qCO2:A=Specific maintenance respiration
rates of CAMB.
3.2. Relationships among soil properties
Results show that soil biological properties re-sponded rapidly to chemical and physical changes in soils resulting from human-induced land use/land cover alterations. There was a considerable degree of correlation between the physical properties, ρb and AS, and the various chemical (carbon) and biological properties measured (Table 4). As expected,ρb was negatively correlated with most soil properties while AS was positively correlated with the same. The rela-tionship was reversed for qCO2:A, since high values of this specific maintenance respiration rate and of ρbare both associated with soil degradation brought on by poor agricultural management (Islam and Weil, 2000). The closest correlation for bothρband AS was with CFA, suggesting that the fulvic acid C fraction is an important source of labile C for microbial activity that affects soil aggregation. The CFA was also very closely correlated (r=0.99) with CL as measured by KMnO4 oxidation, suggesting that the latter may be useful as a very rapid and easily performed analysis for microbially functional soil organic matter. For this reason, the authors are currently developing a simpli-fied method suitable for determining CL in the field.
4. Conclusions
and grass. Cultivated soils had higher bulk density and lower aggregate stability. Total organic C and N, soluble and oxidizable C, total and active microbial biomass were all reduced. At the same time, specific maintenance respiration was greater on cultivated sites than in well-stocked natural forest soils. Improve-ment of soil properties under the Acacia reforestation and grass indicates that planting of well-adapted and fast-growing vegetative species can gradually improve soil quality and regenerate degraded lands.
References
Adejuwon, J.O., Ekanade, O., 1988. A comparison of soil properties under different land use types in a part of the Nigerian cocoa belt. Catena. 15, 319–331.
Anderson, T.H., Domsch, K.H., 1985. Determination of ecophysiological maintenance of C requirements of soil microorganisms in a dormant state. Biol. Fertil. Soils 1, 81–89. Anderson, T.H., Domsch, K.H., 1990. Application of ecophysiological quotients (qCO2 and qD) on microbial
biomass from soils of different cropping histories. Soil Biol. Biochem. 22, 251–255.
Blair, G.J., Lefroy, R.D.B., Lisle, L., 1995. Soil carbon fractions based on their degree of oxidation, and the development of a carbon management index for agricultural systems. Aust. J. Agric. Res. 46, 1459–1466.
Brammer, H., 1996. The Geography of the Soils of Bangladesh. University Press Ltd., Dhaka, Bangladesh.
Elliott, E.T., 1983. Aggregate structure and carbon, nitrogen, and phosphorus in native and cultivated soils. Soil Sci. Soc. Am. J. 50, 627–633.
Girma, T., 1998. Effect of cultivation on physical and chemical properties of a Vertisol in Middle Awash Valley, Ethiopia. Commun. Soil Sci. Plant Anal. 29, 587–598.
Hall, T.B., Rosillo-Calle, F., Williams, R.H., Woods, J., 1993. Biomass for energy: supply prospects. In: Hall, T.B., Kelly, H., Reddy, A.K.N., Williams, R.H. (Eds.), Renewable Energy: Sources for Fuels and Electricity. Island Press, Washington D.C., pp. 593–651.
Hassan, M.M., Majumder, A.H., 1990. Distribution of organic matter in some representative forest soils of Bangladesh. Indian J. For. 13, 281–287.
Hendrix, P.F., Parmelle, R.W., Crossley, Jr.D.A., Coleman, D.C., Odum, E.P., Groffman, P.M., 1986. Detritus food webs in
conventional and no-tillage agroecosystems. BioSci. 36, 374– 433.
Islam, K.R., Weil, R.R., 1998. A rapid microwave digestion method for colorimetric measurement of soil organic carbon. Commun. Soil Sci. Plant Anal. 29, 2269–2284.
Islam, K.R., Weil, R.R., 2000. Soil quality indicator properties in mid-Atlantic soils as influenced by conservation management. J. Soil Water Conser. 55, 69–78.
Islam, K.R., Kamaluddin, M., Bhuiyan, M.K., Badruddin, Abu., 1999. Comparative performance of exotic and indigenous forest species for tropical semi-evergreen degraded forest land reforestation in Bangladesh. Land Degrad. Dev. 10, 241–249. Jenkinson, D.S., Powlson, D.S., 1976. The effects of biocidal
treatments on soil V. A method for measuring soil microbial biomass. Soil Biol. Biochem. 8, 209–213.
Kang, B.T., Juo, A.S.R., 1986. Effect of forest clearing on soil chemical properties and crop performance. In: Lal, R., Sanchez, P.A., Cummings, Jr., R.W. (Eds.), Land Clearing and Development in the Tropics. Belkema, Rotterdam, pp. 383–394. Killham, K., 1985. Assessment of stress to microbial biomass. In: Rowland, A.P. (Ed.), Chemical Analysis in Environmental Research. ITE 18, Institute of Terrestrial Ecology, pp. 79–83. Mahtab, F.U., Karim, Z., 1992. Population and agricultural
land use: towards a sustainable food production system in Bangladesh. Ambio 21, 50–55.
Mullar-Harvey, I., Juo, A.S.R., Wilde, A., 1985. Soil C, N and P after forest clearance: mineralization rates and spatial variability. J. Soil Sci. 36, 585–591.
Nardi, S., Cocheri, G., Dell’Agnola, G., 1996. Biological activity of humus. In: Piccolo, A. (Ed.), Humic Substances in Terrestrial Ecosystems. Elsevier, Amsterdam, pp. 361–406.
Powlson, D.S., Brooks, P.C., Christensen, B.T., 1987. Measurement of microbial biomass provides an early indication of changes in total soil organic matter due to straw incorporation. Soil Biol. Biochem. 19, 159–164.
Tisdale, J.M., Oades, J.M., 1982. Organic matter and water stable aggregates in soils. J. Soil Sci. 33, 141–161.
Van de Werf, H., Verstrate, W., 1987. Estimation of active microbial biomass by mathematical analysis of respiration curves: relation to conventional estimation of total biomass. Soil Biol. Biochem. 19, 267–271.
Wani, S.P., McGill, W.B., Haugen-Kozyra, K.L., Robertson, J.A., Thurston, J.J., 1994. Improved soil quality and barley yields with fababeans, manure, forages and crop rotation on Gray Luvisol. Can. J. Soil Sci. 74, 75–84.