ANALYSIS OF VISUAL INTERPRETATION OF SATELLITE DATA
H. Svatonova
Department of Geography, Masaryk University, Brno, Czech Republic – [email protected]
Commission ThS 16 – Percentual and cognitive experiment with images and 3 D models
KEY WORDS: Human factors, User experiments, Fitness for use, Usability, Visual analytics, Perception, Cognition
ABSTRACT:
Millions of people of all ages and expertise are using satellite and aerial data as an important input for their work in many different fields. Satellite data are also gradually finding a new place in education, especially in the fields of geography and in environmental issues. The article presents the results of an extensive research in the area of visual interpretation of image data carried out in the years 2013 - 2015 in the Czech Republic. The research was aimed at comparing the success rate of the interpretation of satellite data in relation to a) the substrates (to the selected colourfulness, the type of depicted landscape or special elements in the landscape) and b) to selected characteristics of users (expertise, gender, age). The results of the research showed that (1) false colour images have a slightly higher percentage of successful interpretation than natural colour images, (2) colourfulness of an element expected or rehearsed by the user (regardless of the real natural colour) increases the success rate of identifying the element (3) experts are faster in interpreting visual data than non-experts, with the same degree of accuracy of solving the task, and (4) men and women are equally successful in the interpretation of visual image data.
1. FROM SKETCHES AND MAPS TO DATA FROM SENSORS ON SATELLITES AND AIRPLANES
The development of technology and the Internet has opened up the opportunity to use aerial and satellite images to people of many disciplines and interests. By means of various servers, viewing image data from satellites and aircraft is becoming ever more user friendly. Image data are new material previously carefully classified but now available. Aerial images have been used for about 100 years, and satellite images for 50 years, which is why experience with the interpretation of image data is different to that of maps. In their origins, image data are inherently different to maps and they put different requirements on the reader. We cannot, therefore, automatically transfer the results of research on reading maps to reading images.
2. RESEARCH ON VISUAL INTERPRETATION OF IMAGE DATA BY NON-PROFESSIONALS
2.1 Visual interpretation of image data
Interpretation of aerial and satellite imagery is a method of obtaining information about objects and the landscape. It is a specific process of studying the geographical reality based on the detection, identification and spatial localization of individual objects and terrain shapes captured in aerial photographs and satellite image records. Interpreting the image means deciphering its multifaceted content from the point of view of the purpose which the surveyed knowledge serves (Svatoňová and Lauermann, 2010). The information that we are looking for in the images are encoded in various shades and textures. The interpretation of digital images is basically possible in two ways, usually referred to as visual interpretation and computer interpretation. The user is present
in both sub-processes but in each one they have a different task. Visual interpretation is a less controllable process, in which there are many factors.
The characteristics of the user always influence the visual interpretation of the result individually. Part of the process of interpretation is always the user or subject, whether they are experts or not. With computer interpretations, users get a classified image, which in many ways may even resemble a map. The basic task in the interpretation of aerial and satellite images is systematically "reading" their contents, which includes correct recognition and classification of individual objects, determining their properties, quantitative and qualitative characteristics, accurate spatial (positional) location of the detected objects, examination and evaluation of interrelationships and causalities between the displayed objects and the phenomena, analysing these linkages and identifying patterns characterizing the crucial ingredients and attributes of the pictured area. This is a condition for its identification and facilitates the decision making proces supported by the images (Hoskova-Mayerova et al, 2013).
"cartographic literacy" (Kovarik, 2014). Specialists (experts, interpreters) on the interpretation of images are prepared for their work for many years, and depending on their experience they indicate that it takes approximately ten years to become an excellent interpreter. Current research into the effectiveness of interpretations of maps and image data only looks at the problem of readability of these documents for non-experts to a limited extent. This research study is aimed at the interpretation of image data by non-professionals.
2.2 Characteristics of the individual in relation to the interpretation of images
Non-experts interpret the image more intuitively; they unconsciously work with a number of interpretive signs and their biological, psychological assumptions or experiences are reflected more. The study followed two individual characteristics: gender as a biological characteristic and experience as a gained social characteristic.
2.2.1 Gender: The research into spatial tasks also looked at the differences between men and women. Men showed somewhat better results in tests aimed at solving spatial tasks (Linn and Petersen, 1985; Voyer, Voyer and Bryden, 1995; Marmor and Zaback, 1976). Women recognized colours faster and better (Nowaczyk, 1982) and recalled the colours better (Pérez-Carpinelli, Baldoví, deFez and Castro, 1998). Experimental studies have also shown how far visual perception is affected by the environment: whether people living in urban environments interpret the objects that surround them better (in relation to our research, for example, buildings). Research comparing groups of probands living in the city and in a completely remote environment (tropical rain forests of Africa) failed to reach definite conclusions (Segall, Campbell and Herskovits, 1963; 1966). Hund and Gill (2014) investigated the effect of stimuli and memory on finding one’s way and looking for routes. They found that women are quicker if they have more stimuli usable for orientation, whereas with men there was no difference in how long it took them to find the way. The unique study by Campbell et al. (2014) examines the influence of age and gender on a mental topographical map of their own city. The research involved 63 adult respondents aged between 20 and 79 years in Sydney and its surroundings. Subtests included tasks relating to the identification of important elements in orientation of the landscape (landmarks), describing maps, plotting routes and evaluation of orientation. Middle-aged men had the best orientation, while women’s orientation deteriorated with age, i.e. gender and age influenced the orientation in a familiar environment, although other tests with tasks on the topographical memory of known sites did not show the differences between women, men and age. Lloyd, Hodgson and Stokes (2002), however, point out that in many studies on spatial abilities related to gender standardized tests are rarely used (Schaefer and Thomas, 1998; Stumpf, 1998; Dunn and Eliot, 1999).
2.2.2 Experience: The resultant interpretation of the visual scene is influenced by the experience with the stimulus (in
relation to our research with a map and images). Different knowledge and experience is manifested in various degrees of attention to certain details. In interpreting the images expectations of the form of the pictured object may play a role (in a vertical projection of a house we expect a rectangular shape rather than rhomboidal, etc.). In the interpretation experience in terms of knowledge of the type of territory is also positively reflected, as well as assumptions about what objects there could be in this region, i.e. expectations about the objects and the spatial context are very important for the process of visual interpretation (Hollingworth and Henderson, 1999; Chun, 2000, Kubicek et al, 2016). Experienced readers interpret the images faster, with more but shorter eye movements across each frame (Rayner, 1978). Research (Hollingworth and Henderson, 1999; Chun, 2000; Rosch, 1973; Rosch and Mervis, 1975; Lloyd, Patton and Cammack, 1996) confirms the need to have some basic experience of what the identified element should look like, what properties it has which can be expected to appear on the picture.This facilitates and is a condition for its identification.
2.3 Aim of the research
The aim of the work was to analyse the success rate of visual interpretation of satellite data among users – non-experts, based on the data: to compare satellite data in true colours and satellite data in false colours and also based on the users’ expertise, gender and age. It evaluated the success of interpretation in relation to untrained users and professionals, women and men, and according to their development in adolescence.
2.4 Methods
The comprehensibility of the data was evaluated by two parameters - success (in the sense of correctness or accuracy of the answers) and the speed of solving problems. Pair ratings of the evaluation of image data were conducted: the respondents had to solve an identical task on two comparable sets of data in two variants of the test. All the hypotheses were tested at a significance level of 0.05 (ie. in the received hypotheses a 95% probability applies), and p-values were calculated. The hypotheses were tested using non-parametric methods (Wilcoxon test) and parametric methods (t-test, binomial distribution parameter test, χ ^ 2 test, McNemar test). The hypothesis testing and data processing was done in the computing programme MATLAB 8.1, and the image processing of the results was done in the Statistics and MS Excel programmes.
2.5 Testing
index of the respondent, which then allows a compilation of a specific record of a single test to be done. The internal programmed structure of the test was hierarchically arranged in the Hypothesis from the basic components of the TEST - SUBTEST - TASK. The record of each task consists of: an assignment, a portrayal of the data, a recording of the solutions of the respondent, evaluation of the correctness compared to an example, and a record of the time of each operation. The large volume of recorded data then required extensive filtering.
2.6 Types of test tasks
In the test for evaluation of the interpretation of images the properties of the images were taken into account as a priority when selecting assignments – i.e. based on the image properties (selection of the types of tasks that can potentially be worked on with the images). Out of the possible tasks in interpreting the images I included classifying, identifying, quantifying and defining areas. Parameters were evaluated for the assignments - success, speed, accuracy as a form of success for certain tasks, where the tasks were assessed to be correct at an accuracy of 80 percent and higher in defining the correct shape of the identified object. Possible types of actions of the respondent when fulfilling the task were: closed response (forced choice), free response, identification of the object by clicking, selecting from multiple objects on a slide, on a map, identifying the shape - line, polygon, naming (by clicking with the mouse on the depicted shape of the object, its contour lines, etc.), and identification of areas - the boundary of the territory.
2.7 Research respondents
Overall there were 412 tests, of which 302 tests were valid. The results of 151 respondents’ paired tests who had completed both tests in a given period were taken in, so 302 tests were tested altogether. The choice of respondents was from a stratified selection, the objective of which was to provide a group of respondents (or sub-groups) to test the hypotheses in paired testing, which can generally be used to test a smaller group of respondents.
Structure of respondents by gender and education: The structure of the respondents by gender was relatively balanced: 56% were women, 44% were men. The structure of respondents by education: 76% of respondents who had completed secondary education were currently studying at university, 24% of respondents consisted of university graduates with a Bachelor’s, Master’s or Doctoral degree. Half of the respondents were educated in the fields of geography and cartography, and the second half of the respondents studied or worked outside these fields. For evaluation of interpretation of the test results the information about respondents' experience in reading images and maps is useful, as well as their interest in working with these documents. The respondents' answers indicate that the majority of them work with maps and images, and only a small number of respondents (11 respondents out of 151 images) said that they
do not work at all with this material. Most of the respondents work with maps at least once a month and in this sense we cannot talk about the group of respondents as complete non-experts with regard to reading maps and images.
2.8 The structure and content of the test
The test was structured into sections. The first section contained collection of individual data, followed by a subtest on colour vision. The third section was a practice part - the respondents worked with the key for image data in the tested colour combination looking at image data and filling in practice tasks. The fourth section contained a test for testing the data compared in pairs. At the end of the test, respondents filled out their own evaluation of the difficulty in interpreting documents.
2.9 Tested materials
For testing, data was selected that is accessible to the public; in this research it was data from the Landsat satellite. From the various false colours the 742z combination was chosen because of its world-wide free access to a mosaic of images in this colour combination in the years 2004 - 2013. (The NASA server was archived in 2013). The tested aspects were as follows: a satellite image in natural colours (Landsat 7, RGB 321), scale 1: 100,000, resolution 30 m and a satellite image in unnatural colours (Landsat 7, RGB 742), scale 1: 100,000, resolution 30 m.
2.10 Research results
The results yielded a lot of information about the success of visual interpretation of selected documents.
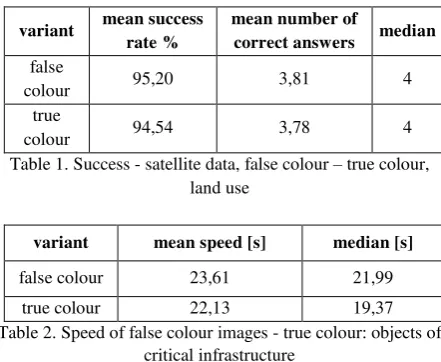
2.10.1 Results of identification of land use on satellite data: The first group of identified objects on the satellite data were different types of land use (fields, forests, urban development, rural development). The test results reveal a high success rate for the respondents. The respondents worked on tasks connected to image data in true and false colours equally - see Table 1 and Table 2.
variant mean success rate %
mean number of
correct answers median false
colour 95,20 3,81 4
true
colour 94,54 3,78 4
Table 1. Success - satellite data, false colour – true colour, land use
variant mean speed [s] median [s]
false colour 23,61 21,99
true colour 22,13 19,37
2.10.2 Results of identification of objects of critical infrastructure on satellite data: The second group of identified objects consisted of objects of critical infrastructure (motorways, roads and intersections, identification of the course of national borders and communications, nuclear power, military airports, military training grounds). The success of their identification was the same for both the data, but slightly faster for the images in false colours – see Tables 3 and 4.
Table 3. Success of the images - false colour - true colour: objects of critical infrastructure
variant mean speed [s] median [s]
false colour 176,21 171,36
true colour 147,28 136,50
Table 4. Speed of false colour images - true colour: objects of critical infrastructure
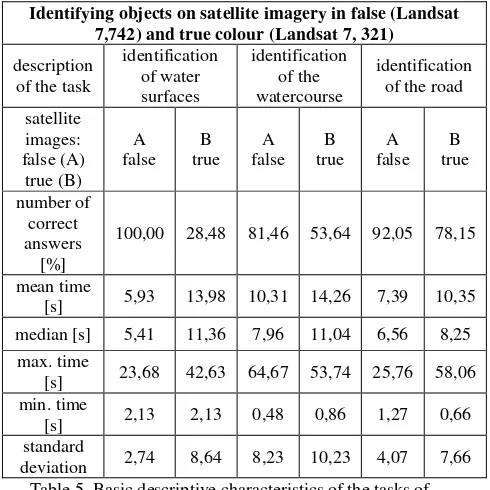
2.10.3 The results of the identification of selected objects: For more detailed identification of the selected objects the results where the solution appeared to be interesting are described either because of big disparity in the success (water surfaces and watercourses) or a high level of agreement (nuclear power plant). For comparison of identification, with the watercourse the results of identification of roads are also presented, and for comparison with the nuclear power station as the military training ground was used as a compound.
Identification of water surfaces: On one pair of images water surfaces and watercourses look completely different colour-wise in unnatural and natural colours. While in the coloured synthesis RGB 742 looks like a blue surface or lines contrasting enough with the surroundings, in natural colours it has basically its real colour: a green or brown pond, and the same with the river – in the landscape, therefore, the image contrasts less with the surroundings. Analysis of the tasks with "water" showed that respondents had a big problem recognizing watercourses and water surfaces with natural colours and they made a series of errors. The success rate on the image with natural colours was only 28.48%. In addition to this, they needed more than twice the time to respond than for the image in false colours. Water surfaces on the image in the test colour combination were recognized by all the respondents.
Identification of watercourse: The problem to be solved is essentially identical to the previous task (identification of water surfaces in the landscape). The shape of a river, a line, remains visible and the number of mistakes is thus reduced. Even so, the success of the image in its true colours was only 53.6%. The respondents also suggested their solutions to the
image in true colour more slowly. Problems with distinguishing watercourses may indicate the overall problem of orientation from a height – watercourses form a kind of structure of the landscape and are important landmarks. Difficulty with recognition of watercourses then complicates the overall localization of the place in the next step.
Table 5. Basic descriptive characteristics of the tasks of identifying objects on an image in false colours and true
colours
Identification of a nuclear power plant: The result was interesting in its concurrence – the respondents achieved the same result in the accuracy of the identification and virtually at the same time. The nuclear power station is a heterogenous element and it can only be assumed that the main identifying factor was mainly the overall composition of the buildings in the picture. To identify the nuclear power station you also need to have a basic knowledge of what a plant looks like and what is typical of it.
Table 6. Basic descriptive characteristics for the tasks of identifying objects on a slide in false and true colours Identifying objects on satellite imagery in false (Landsat
7,742) and true colour (Landsat 7, 321)
description
Identifying objects on satellite imagery in false (Landsat 7,742) and true colours (Landsat 7, 321)
description of the
Identification of military training ground: The respondents were more successful and faster with the image in its true colours. A training ground for driving heavy machinery looks like interwoven bright lines sufficiently contrasting against the dark surrounding woods. In the pictures with the false colours the paths contrast less compared to the surroundings and are less recognizable.
2.10.4 The results of the interpretation of satellite data by the characteristics of respondents (gender, expertise): Men and women worked out the tested tasks as successfully and as quickly as each other. Research has not demonstrated any difference in solving the tasks by gender. The relation between expert women and expert men was also tested, but there was also no statistically significant difference. The group of experts and non-experts worked out a problem of a general character as quickly and successfully as each other. In the area of expertise of the respondent, when working out tasks (in crisis management), the experts were significantly faster - see Table 7.
Table 7. The speed of solving problems related to crisis management based on the expert experience of respondents -
soldiers, non-soldiers
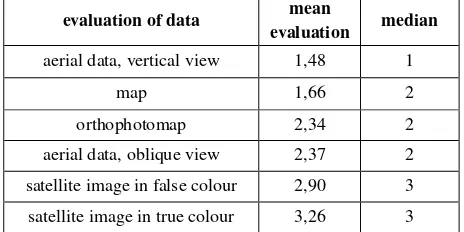
2.10.5 Subjective evaluation of the respondents regarding the difficulty of interpretation in relation to other materials: Satellite images were subjectively rated as the most difficult in comparison with the other data. Subjectively, the false-coloured image seems to be easier. The respondents assessed the vertical aerial photograph as the easiest closely followed by the map. Table 8 shows an overview of the mean and median scores.
Table 8. Subjective evaluation of images and maps
3. CONCLUSION
Research on the visual interpretation of aerial and satellite images by nonexperts was undertaken in the period 2013 -2015. 151 pairs of results were included in the final evaluation. The tasks were structured in such a way as make it possible to resolve them successfully on both data. The hypothesis testing
and analysis of tasks revealed that the accuracy and speed of interpretation of the image data differs: the objects pictured on them are identified with varying success and speed. On the satellite images in true and false colours identification of the selected objects was equally successful. Detailed analysis of the tasks showed differing extents of success in identification of water bodies and watercourses. Water bodies and watercourses were more easily read when the image was in false colours (when the selected combination appeared in blue), and when contrasting with the surrounding elements and their colours.
This suggests that it is the colour contrast against the surroundings that accelerates good interpretability of the objects as well as associations - i.e. blue represents water. False-coloured images thus behave like a map, a certain coloured model of reality, which allows good readability of certain elements which, despite having true colours, has little contrast appearing on the slide in natural colours (a greenish pond surrounded by meadows and fields was identified by only one fifth of the respondents, whereas the same pond in false blue was identified by almost 100% of respondents). The significance of colour as a basic interpretive sign was discussed in the work, including references to research such as Majidi et al. (2014), Jenny and Kelso (2007), Brewer (1997), Olson and Brewer (1997). The contrast of colour to the surroundings and possibly good association support a successful and rapid interpretation of images. But if respondents were supposed to identify a compound of several identical objects (nuclear power station as a compound: buildings and cooling towers; military training ground: like a cluster of intertwined lines), then the contrasts of colour played a role; the result was better for image data in false colours (the object was discovered sooner and subsequently identified). Another frequently discussed biological characteristic in relation to optical perception is gender. The test did not show any differences between men and women. The tasks were set up in such as way as to work for both the image data and maps, i.e. success by gender in relation to e.g. work with an abstract model of the landscape cannot be monitored. A number of psychologists point to the overestimation of the role of the "male" and "female" brain. According to Šikl (2012, p. 31) “visual perception is one of the few activities of the mind for which there are no widely accepted stereotypes regarding the difference between men and women.”
In many studies the differences in the average outcome between the groups were smaller than the variance of the results of one group by gender (Mather, 2006). Experience and expertise had an impact on the speed of solving crisis tasks on satellite imagery; the task of identifying a fire threatening the city was resolved more quickly by soldiers and workers in crisis management, including soldiers and policemen. Experience and expertise help in the effective structuring of information (Šimeček and Šikl ,2011). Also, interpretation in utilizing the characteristics of objects is accompanied by experience - what features can be assumed for a common
satellite image in false colour 2,90 3
object (Rosch, 1973; Rosch and Mervis, 1975; Lloyd, Patton and Cammack, 1996).
The research is a contribution to the current knowledge on non-experts with regard to satellite data. Overall, we can state that non-experts can interpret satellite data in false colours very well. To identify an object on satellite data accuracy of the reality is not as important as contrasts of colour to the surroundings or rehearsed (estimated) colour of the identified object. It is a pity, therefore, that NASA and Google present the majority of satellite data to the public in natural colours. It does not make it easier for non-experts to identify various elements either.
4. ACKNOWLEDGEMENTS
This research has been supported by funding from the project of Masaryk University under the grant agreement No. MUNI/M/0846/2015, which is called ‘Influence of cartographic visualization methods on the success of solving practical and educational spatial tasks’.
5. REFERENCES
Brewer, C. A., 1997. Spectral schemes: Controversial color use on maps. Cartography and Geographic Information Systems, vol. 24, pp. 203–220.
Campbell, J. B., 2007. Introduction to remote sensing. 4th edn., The Guilford Press, New York.
Campbell. J. I., Hepner, I. J. and Miller, L. A., 2014. The influence of age and sex on memory for a familiar environment. Journal of Environmental Psychology, vol. 40, pp. 1–8.
Hoskova-Mayerova, Š., Talhofer, V., Hofmann, A., Kubíček, P, 2013. Mathematical model used in decision-making process with respect to the reliability of geodatabase. Studies in Computational Intelligence , 448, pp. 127-142
Chun, M., 2000. Contextual cueing of visual attention. Trends in Cognitive Science, vol. 4, pp. 170–178.
Dunn, A. and Eliot, J., 1999. An exploratory study of undergraduates' attributions of success or failure on spatial tests. Perception and Motor Skills, vol. 89, pp. 695–702.
Hollingworth, A. and Henderson, J., 1999. Object identification is isolated from scene semantic constrain: Evidence from object type and token discrimination. Acta Psychological Sciences, vol. 10, pp. 319–343.
Hund, A. M. and Gill, D. M., 2014. What constitutes effective wayfinding directions: The role of descriptive cues and task demands. Journal of Environmental Psychology, vol. 38, pp. 217–224.
Jenny, B. and Kelso, N. V., 2007. Color design for the color vision impaired. Cartographic perspectives, vol. 57, pp. 61– 67.
Kovarik, V. and Marsa, J., 2014. Specifics of thematic map production within geospatial support at a politico-strategic level. Geographia Technica., vol. 9, No. 1, pp. 52-65.
Kubicek, P., Sasinka, C, Stachon, Z., Sterba, Z., Apeltauer, J and Urbánek, T. 2016. Cartographic Design and Usability of Visual Variables for Linear Features. The Cartographic Journal, vol. 1/2016, pp. 1-11.
Linn, M. C. and Petersen, A. C., 1985. Emergence and characterization of sex differences in spatial ability: A meta-analysis. Child Development, vol. 56, pp. 1479–1498.
Lloyd, R., Patton, D. and Cammack, R., 1996. Basic-level geographic categories. The Professional Geographer, vol. 48, pp. 181–194.
Lloyd, R., Hodgson, M. E. and Stokes, A., 2002. Visual categorization with aerial photographs. Annals of the Association of American Geographers, vol. 92, pp. 241–266.
Majidi, B., Patra, J. C. and Zheng, J., 2014. Modular interpretation of low altitude aerial images of non-urban environment. Digital Signal Processing, vol. 26, pp. 127–141.
Marmor, G. and Zaback, L., 1976. Mental rotation by the blind: Does mental station depend on visual imagery? Journal of Experimental Psychology: Human Perception and Performance, vol. 2, pp. 515–521.
Maruff, P., Danckert, J., Camplin, G. and Currie, J., 1999. Behavioral goals constrain the selection of visual information.
Psychological Science, vol. 10, pp. 522–525.
Mather, G., 2006. Foundations of Perception. Psychology Press, Hove, UK.
Nowaczyk, R. H., 1982. Sex-related differences in the color lexicon. Language and Speech, vol. 25, pp. 257–265.
Olson, J. M. and Brewer, C. A., 1997. An evaluation of color selections to accommodate map users with color-vision impairments. Annals of the Association of American Geographers, vol. 87, pp. 103–134.
Pérez-Carpinell, J., Baldoví, R., de Fez, M. D. and Castro, J., 1998. Color memory matching: Time effect and other factors.
Color Research and Applications, vol. 23, pp. 234–247.
Rayner, K., 1978. Eye movements in reading and information processing. Psychological Bulletin, vol.85, pp. 618–660.
Rosch, E., 1973. Natural categories. Cognitive Psychology, vol. 4, pp. 328–350.
Schaefer, P. and Thomas, J., 1998. Difficulty of spatial task and sex differences in gains from practice. Perceptual and Motor Skills, vol. 87, pp. 56–58.
Segall, M. H., Campbell, D. T. and Herskovits, M. J., 1963. Cultural differences in perception of geometric illusions.
Science, vol. 139, pp. 769–771.
Segall, M. H., Campbell, D. T. and Herskovits, M. J., 1966.
The influence of culture on visual perception. Bobs-Merrill, New York.
Šimeček, M. and Šikl, R., 2011. How we estimate the relative size of human figures when seen on a photography. Perception. Vol. 40, pp 148 – 148.
Šikl, R., 2012. Zrakové vnímání. Grada Publishing, Praha.
Stumpf, H., 1998. Gender-related differences in academically talented student's test scores and use of time on tests of spatial ability. Gifted Child Quarterly, vol. 42, pp. 157–171.
Svatoňová, H. and Lauermann, L., 2010. Dálkový průzkum
Země –aktuální zdroj geografických informací. Masarykova
univerzita, Brno.