EVALUATING THE POTENTIAL OF SATELLITE HYPERSPECTRAL RESURS-P
DATA FOR FOREST SPECIES CLASSIFICATION
O.Brovkinaa, J.Hanuša, F.Zemeka, V.Mochalovb, O.Grigorievab, M. Pikla
aGlobal Change Research Institute, 60300 Brno, Czech Republic – (brovkina.o, zemek.f, hanus.j, pikl.m)@czechglobe.cz bSt.Petersburg Institute for Informatics and Automation of Russian Academy of Science, 199178 St.Petersburg, Russia –
Commission I, WG I/5
KEY WORDS: satellite, airborne, hyperspectral, forest species
ABSTRACT:
Satellite-based hyperspectral sensors provide spectroscopic information in relatively narrow contiguous spectral bands over a large area which can be useful in forestry applications. This study evaluates the potential of satellite hyperspectral Resurs-P data for forest species mapping. Firstly, a comparative study between top of canopy reflectance obtained from the Resurs-P, from the airborne hyperspectral scanner CASI and from field measurement (FieldSpec ASD 4) on selected vegetation cover types is conducted. Secondly, Resurs-P data is tested in classification and verification of different forest species compartments. The results demonstrate that satellite hyperspectral Resurs-P sensor can produce useful informational and show good performance for forest species classification comparable both with forestry map and classification from airborne CASI data, but also indicate that developments in pre-processing steps are still required to improve the mapping level.
1. INTRODUCTION
One of the main applications of remote sensing in the last decade is monitoring of forest cover (Xie et al., 2008). Classification and discrimination of forest types from local to global scales at a given time point or over a continuous period need high spectral and spatial resolution images generated by remote sensors. Satellite-based hyperspectral sensors provide spectroscopic information in relatively narrow contiguous spectral bands over a large area and offer new opportunities for better classification, increased reliability and enhanced visual quality.
The use of satellite hyperspectral images (e.g., Hyperion EO-1 and CHRIS PROBA) has been discussed extensively in the literature for identification of forest cover features, managing and conserving a biodiversity of forest areas (Thenkabail et al., 2004; Walsh et al., 2008; Kattenborn et al., 2015). Several studies revealed that forest application results from satellite hyperspectral data had a good match with results from airborne hyperspectral data (Townsend & Foster, 2002; Smith 2003). However, some authors stressed that hyperspectral satellite data demonstrated poor performance related to airborne data in such tasks as forest species mapping and canopy water content (Ustin et al., 2002; Ceballos et al., 2015).
The satellite hyperspectral sensor Resurs-P is a new mission that was launched in December 2014. The main purpose of the mission is region and local monitoring of natural resources: determining the type and state of the vegetation and soils, and identifying environmental pollution and water monitoring. The quality of Resurs-P data and its potential for various applications has not yet been fully explored. Considering these, a study was initiated to evaluate the data quality and compare the potential of hyperspectral Resurs-P images for forest application. More specifically, the objectives of the study were: 1/ to compare spectral response between Resurs-P, CASI and ASD data, and 2/ to test whether the classification of hyperspectral Resurs-P satellite data can reveal approximately the same forest species achieved from airborne hyperspectral CASI data.
2. METHODS
2.1 Study area
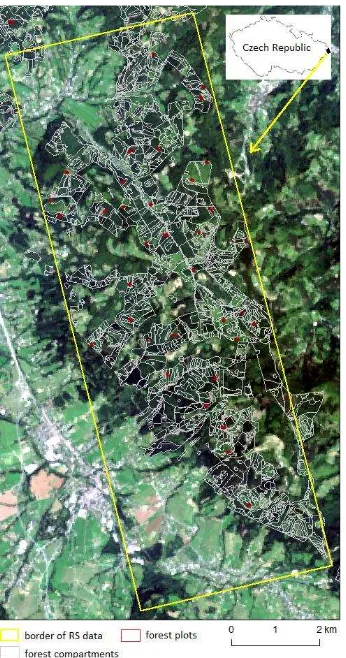
The study site is located in the Moravian-Silesian Beskydy Mountain ranges of the Czech Republic (Figure 1). The site (180 47’ E, 490 37’ N, at an altitude of 500–900 m ASL) is covered by managed forest stands of ages approximately 25 to 65 years, with Norway spruce (Picea abies) and European beech (Fagus sylvatica) as the dominant tree species and scattered admixture of Scots pine (Pinus sylvestris), silver fir (Abies alba) and European larch (Larix decidua). Study area (54 km2) is limited by availability of both remote sensing and field data.
Figure 1. Location of study area. Spatial extent of remote sensing and field data
2.2 Data
2.2.1 Remote sensing data: A satellite hyperspectral Resurs-P image has been acquired by Research Center for Earth Operative Monitoring of Russian Federation Space Agency in spectral range of 461 – 1000 nm with spatial resolution of 30 m on June 6th 2015. The radiometric and geometric correction of the Resurs-P image was performed by the vendor. The atmospheric correction is described in 2.3. An airborne hyperspectral CASI image was acquired in spectral range of 368 – 1041 nm with spatial resolution of 1 m on June 5th 2015 (Table 1). The radiometric correction of the airborne image was performed using CaliGeo 4.6.4 (Spacim) software and ENVI 4.4. The atmospheric correction was done in ATCOR4 6.0 (ReSe Applications Schlaepfer) and the georectification was done in PARGE 3.2.
Table 1. Hyperspectral sensor characteristics. FWHM – full width at half maximum
2.2.2 Field data: Field spectral reflectance have been collected by the FieldSpec®4 spectroradiometer (ASD) in spectral range of 350 – 2500 nm on June 5th 2015. Elements of the landscape having a homogenous surface and unchanged physical characteristics during the day were selected for collecting spectra. Field spectral reflectance were used for atmospheric correction of remote sensing data and for evaluation of the reliability of transmission of test surface spectral properties from Resurs-P data. The total ozone column, water vapor column and aerosol optical thickness were measured during the airborne and satellite data acquisition by multi-band sun photometer MICROTOPS II on June 5th and June 6th 2015.
Field data of forest species distribution were collected by the Institute of Forest Ecosystem Research (IFER, www.ifer.cz) in 2013 included an inventory field plots scattered across the study area with a distance of about 1 km. The sampling plots were circular with an area of 500 m2 (radius of 12.62 m). We used 68 sampling plots (39 spruce, 14 beech and 15 mixed (spruce and beech)) for ROIs assignment in species classification of Resurs-P and CASI data and validation of classification.
A vector forest inventory map was provided by the Institute of Forest Management Brandys nad Labem of Agriculture of the Czech Republic (http://www.uhul.cz/kdo-jsme/o-uhul). The map contained forest management planning data that had been revised in 2010. These data were collected according to the Czech forest management planning standard (Stanek et al., 1997). Forest inventory data contained for each compartment more than 30 characteristics about the species composition, area, age and heights of trees, type of forest, merchantable biomass, forest tier and others. Based on information from forest inventory map about tree species and share of tree species, we classified 1600 forest compartments from the study area on 6 classes: spruce (more than 85 % of spruce), beech (more than 85 % of beech), mixed 1 (50 % spruce, 50 % beech), mixed 2 (70 % spruce, 30 % beech), mixed 3 (30% spruce, 70 % beech) and mixed 4 (spruce 70%, pine 30 %). The classified forest compartments were used for validation of Resurs-P and CASI classification.
2.3 Atmospheric correction of Resurs-P image
Two steps preceded the atmospheric correction of Resurs-P image: 1/ deriving a radiometric correction coefficients, and 2/ approximation of spectral signature.
2.3.1 Deriving a radiometric correction coefficients: Radiometric correction coefficients (K) were derived for Resurs-P image to adjust the radiometric correction:
� = ���
� ��� /���
� � (1) where radsatellite is a top of the atmosphere (TOA) radiance in eachspectral band of Resurs-P image, radfield– TOA of ASD data. To
recalculate field spectral top of canopy radiance (from ASD) to TOA radiance the model of atmospheric transmittance MODTRAN 5.3 was used. The input parameters for the model were obtained from nearby weather stations and field measurements of the sun photometer. A filter response function file with information about spectral bands, FWHM and spectral sensitivity of the sensor was generated for the model.
2.3.2 Approximation of spectral signature: The junction of arrays of hyperspectral data from two receiving detectors has caused the presence of "comb" structure of the spectrum in the wavelength range of 631-635 nm. A Savitzky–Golay filter (Savitzky & Golay, 1964) was applied to a data set to smooth the data and to increase the signal-to-noise ratio without greatly distorting the signal. Spectral bands from 405 to 456 nm were excluded from further analysis due to very low signal-to-noise ratio.
2.3.3 Atmospheric correction: The atmospheric correction was done in FLAASH model using the following main parameters: rural aerosol model, mid-latitude summer atmospheric model, and initial visibility of 30 km.
2.4 Evaluation of the reliability of transmission of surface spectral properties from Resurs-P data
Because the spectral resolution of Resurs-P, CASI and ASD vary, the recalculation of reflectance values was implemented (subsection 2.4.1). To evaluate the reliability of transmission of surface spectral properties from satellite image we compared recalculated top of canopy reflectance of several landscape surfaces from Resurs-P, CASI and ASD. The satellite Resurs-P imaging platform has resolution of 30 m causing most of pixels to be a mixture of several materials. We used two vegetation surfaces which take more than 4 pixels on the satellite image (play field and grassland, subsection 2.4.2) and two asphalt surfaces which take around 40 % of pixel on the satellite image (subsection 2.4.3).
2.4.1 Recalculation of reflectance values:
The spectral resolution of ASD is higher than the spectral resolution of Resurs-P. The integration of ASD reflectance within the wave delta of Resurs-P was implemented as:
�
� �=
The coefficients (k) for each CASI spectral band corresponding to Resurs-P spectral bands were found to recalculate CASI vegetation surfaces: The vegetation sites (play field and grassland) for reflectance comparison were assigned based on relative homogeneity of the surface and square of more than 0.6 ha to minimize a mixing spectra of adjacent surfaces due to the effect of point spread function (PSF).
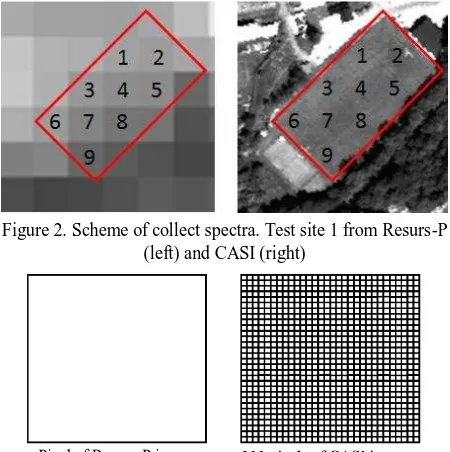
Figure 2. Scheme of collect spectra. Test site 1 from Resurs-P (left) and CASI (right)
Figure 3. Relation of pixels from Resurs-P and CASI sensors
For test site 1 (Figure 2) we collected 9 reflectance spectra from each of Resurs-P, CASI and ASD data in corresponded points. While reflectance spectra of Resurs-P data have been collected in each of 9 pixels of the site, reflectance spectra of CASI data have been averaged and collected in the window of 30x30 pixels for each of 9 points of the site 1 (Fig. 3). Test site 2 occupied 6 pixels on the Resurs-P image. The same procedure of collecting spectra was implemented for 6 reflectance spectra from each data source. The absolute differences (AbsDif) in reflectance spectra between Resurs-P and CASI, and between Resurs-P and ASD, and the standard deviation of AbsDif (StDv) were calculated over the entire spectral range 461-1000 nm.
2.5 Classification of tree species
Object-oriented analysis of Resurs-P and CASI data was applied for tree species classification (eCognition Developer 8.9). The process was split into a segmentation and classification. The segmentation of the image into objects (group of pixels) included two levels with different parameters of scale, shape and compactness influencing the segmentation (Willhauck et al., 2000). The weighting of these parameters established the homogeneity criterion for the object primitives. A visual inspection of the objects resulting from variations in the weightings was used to determine the overall values for the parameter weighting at each scale level. The following objects futures were applied for classification: mean layer values, ratio layer values, Red Edge Normalized Vegetation Index (reNDVI) (Gitelson and Merzlyak, 1994) and Red Green Ratio Index (RGRI) (Gamon and Surfus, 1999).
The Resurs-P image was classified into the follow classes: settlements, fields, roads, spruce, beech, mixed 1, mixed 2, mixed 3 and mixed 4. The CASI image was classified into the following classes: settlements, fields, roads, spruce, beech, pine. Classified pixels from forest classes were aggregated in forest compartment according to the forestry map. Finally, the compartments were separated into “spruce”, “beech”, “mixed 1”, “mixed 2”, “mixed 3” and “mixed 4” classes based on pixel class assigned by object -oriented analysis.
3. RESULTS
3.1 Atmospheric correction of Resurs-P data
A radiometric correction coefficients (K) (Figure 4) were applied to Resurs-P image before the atmospheric correction (Figure 5).
Figure 4. Radiometric correction coefficients for Resurs-P image
Figure 5. Spectre of grassland from Resurs-P before (left) and after (right) atmospheric correction
3.2 Evaluation of reliability of transmission of surface spectral properties from Resurs-P image
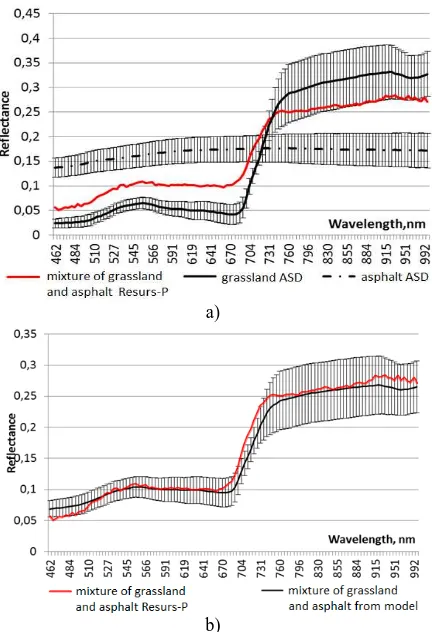
Comparisons between top of canopy reflectance of vegetation surfaces from CASI, ASD and Resurs-P (Figure 6) and artificial surfaces from ASD and Resurs-P (Figure 7) were performed.
a)
b)
Figure 6. Average reflectance of grassland from Resurs-P, CASI and ASD data for test site 1 (a). Average absolute differences (AbsDif) in reflectance spectra between ASD and Resurs-P, and between CASI and Resurs-P (b). Confidence level of 95%.
a)
b)
Figure. 7 Reflectance of asphalt and vegetation (a) and modelling reflectance of mixture of asphalt and vegetation (b)
3.3 Classification results
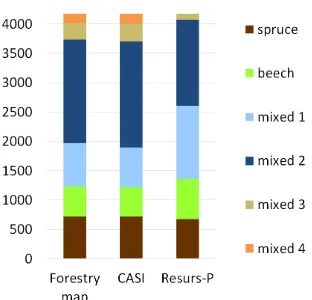
The accuracies of the classification from satellite and airborne data were estimated by comparing the classification results with ground truth via a confusion matrix. The result for Resurs-P demonstrated an overall accuracy of 67% and Kappa coefficient of 0.78. The species classification from Resurs-P omitted the “mixed 4” class with pine and spruce mixture. The result for CASI demonstrated an overall accuracy of 87% and Kappa coefficient of 0.82. We aggregated classified pixels of satellite and airborne images into forest compartment according to a mask from forestry map to compare the distribution of forest classes for study area (Figure 8).
Figure 8. Distribution of forest classes in forestry map, and in CASI and Resurs-P classification result (mixed 1 - 50 % spruce, 50 % beech; mixed 2 - 70 % spruce, 30 % beech; mixed 3 - 30% spruce, 70 % beech; mixed 4 - spruce 70%, pine 30 %)
4. DISCUSSION
4.1 Evaluation of reliability of transmission of surface spectral properties from Resurs-P data
Retrieved and analysed reflectance spectra from Resurs-P, CASI and ASD had similar shape. Radiometric correction eliminated a divergence of Resurs-P spectra from ASD spectra in the spectral region of 461 – 472 nm. Reflectance of grassland from Resurs-P are within the absolute error of ground measurements, which suggests the reliability of the spectral characteristics of vegetation from satellite image. The absolute difference in spectral reflectance of grassland was in 3-4 times larger in the region of 840 – 1000 nm than in the region of 461 to 838 nm between both ASD and Resurs-P, and CASI and Resurs-P. The largest difference in spectral reflectance of Resurs-P and modelled spectral reflectance of mixed surfaces (asphalt and grassland) is observed in the red-edge near-infrared region. The relative error of mixed reflectance from Resurs-P was determined as 10-20% for wavelengths up to 500 nm and near 5% for wavelengths after 500 nm. Based on evaluation of surface spectral properties, we can state, that an improvement of radiometric correction of Resurs-P data is needed to reduce the level of errors and uncertainties.
4.2 Classification of tree species
Satellite and airborne images had the same acquisition conditions. This notably facilitated the direct comparison of the classifications using data from the two sensors because no inter-annual or seasonal differences were expected. Results of species classification from Resurs-P data were comparable with the forestry map and CASI classification distribution and area of forest classes. The airborne hyperspectral image with lower spectral resolution (62 spectral bands of CASI against 116 of Resurs-P) and higher spatial resolution (1 m of CASI against 30 m of Resurs-P) yielded the best classification accuracies (CASI overall accuracy of 87% against Resurs-P overall accuracy of 67%). This confirms a recent study (Goodenough et al., 2004) showing that airborne hyperspectral data can be used in species classification with higher accuracy than satellite hyperspectral data. However, Townsend and Foster (2002) demonstrated the classification using satellite Hyperion data was superior to that using airborne AVIRIS data for pine and maple forest.
Classification results indicated that the lower spatial resolution of the Resur-P data (30 m) affected the ability to identify individual pine forest stands in spruce forest with an area near 0.004 ha.
Dalponte et al. (2013) stressed that the spatial resolution had a strong effect on the classification accuracy in spruce, pine and birch mixed forest. The effect of spatial degradation of hyperspectral imaging for tree species classification was found in Pena et al. (2013). Their result indicated that pixels somewhat smaller than the tree canopy diameters were the most appropriate to represent the spatial variability of tree species in natural forest. Classification results showed that Resurs-P provides good ability to remotely map basic forest species and their mixture.
5. CONCLUSIONS
The study analysis demonstrated that the satellite hyperspectral sensor Resurs-P can produce useful informational and showed good performance relative to airborne CASI data for forest species classification, but also indicated that developments in pre-processing steps are still required to improve the mapping accuracy. Resurs-P can be helpful as a mean of extending forest mapping to large areas and areas not accessible to aircraft sensors.
ACKNOWLEDGEMENTS
This research is supported by the Ministry of Education, Youth and Sports of the Czech Republic within the National Sustainability Program I (NPU I) (grant number LO1415)
REFERENCES
Ceballos, A., Hernandez, J., Corvalan, P., Galleguillos, M. 2015. Comparison of airborne LiDAR and satellite hyperspectral remote sensing to estimate plant richness in deciduous Mediterranean forests of central Chile. Remote Sensing, 7 (3).
Dalponte, M., Orka, O., Gobakken, T., Naesset, E. 2013. Tree species classification in boresl forests with hyperspectral data. IEEE Transactions on Geoscience and remote Sensing 51 (5).
Gamon, J., and J. Surfus. Assessing Leaf Pigment Content and Activity With a Reflectometer. New Phytologist 143 (1999): 105-117.
Gitelson, A., and M. Merzlyak. Spectral Reflectance Changes Associated with Autumn Senescence of Aesculus Hippocastanum L. and Acer Platanoides L. Leaves. Journal of Plant Physiology 143 (1994): 286 292.
Goodenough, D., Pearlman, J., Chen, H., and other. 2004. Forest information from hyperspectral sensing. In Proceedings: Geoscience and Remote Sensing Symposium, IGARSS IEEE International, 4.
Kattenborn, T., Maack, J., Faßnacht, F., Enßle, F., Ermert, J., Koch, B. 2015. Mapping forest biomass from space – Fusion of hyperspectral EO1-hyperion data and Tandem-X and WorldView-2 canopy height models. International Journal of Applied Earth Observation and Geoinformation, 35.
Pena, M., Cruz, P., Roig, M. 2013. The effect of spectral and spatial degradation of hyperspectral imagery for the Sclerophyll tree species classification. International Journal of remote Sensing 34 (20).
Schowengerdt, R. A. Remote Sensing, Third Edition: Models and Methods for Image Processing. 2007. Burlington, MA : Academic Press, 2007. 515 p.
Savitzky, A.; Golay, M.J.E. (1964). "Smoothing and Differentiation of Data by Simplified Least Squares Procedures".
Analytical Chemistry 36 (8): 1627–39. doi:10.1021/ac60214a047.
Smith, M.L. 2003. Analysis of hyperspectral data for estimation of temperate forest canopy nitrogen concentration: comparison between an airborne (AVIRIS) and a spaceborne (Hyperion) sensor. IEEE Transactions on Geoscience and Remote Sensing, 41 (6).
Stanek, J., Zatloukal, V., Kubu, M., Matejcek, J., Skoblik, J., Vasicek, J., Kopecny, K. 1997 Lesni zakon v teorii a praxi. Uplne zneni provadecich predpisu s komentarem. Matice lesnicka, 229-392 (in Czech).
Thenkabail, S. P., Enclona, E. A., Ashton, M., & Van Der Meer, B. (2004). Accuracy assessments of hyperspectral waveband performance for vegetation analysis applications. Remote Sensing of Environment, 91(3–4), 354−376.
Townsend, P.A. and Foster, J.R. 2002. Comparison of EO-1 Hyperion to AVIRIS for mapping forest composition in the Appalachian Mountains, USA. In Proceeding: Geoscience and Remote Sensing Symposium, IGARSS IEEE International, 2.
Ustin, S.L., Roberts, D.A., Gardner, M., Dennison, P. 2002. Evaluation of the potential of Hyperion data to estimate wildfire hazard in the Santa Ynez front range, Santa Barbara, California. In Proceeding: Geoscience and remote Sensing Symposium, IGARSS IEEE international, 2.
Walsh, S.J., Shao, Y., Mena, C.F., McCleary, A.L. 2008. Integration of Hyperion Satellite Data and A Household Social Survey to Characterize the Causes and Consequences of Reforestation Patterns in the Northern Ecuadorian Amazon. Photogrammetric Engineering & Remote Sensing.
Willhauck, G., Schneider, T., De Kok, R., & Ammer, U., (2000), Comparison of bjectoriented classification techniques and standard image analysis for the use of change detection betweeen SPOT multispectral satellite images and aerial photos. Proceedings of XIX ISPRS Congress, 16-22 July, Amsterdam.
Xie, Y.; Sha, Z.; Yu, M. Remote Sensing Imagery in Vegetation Mapping: A review. J. Plant.Ecol. 2008, 1, 9–23.