INTEGRATION OF GEOMATIC TECHNIQUES FOR THE URBAN CAVITY SURVEY
M. Deidda a,G. Sannaa
a
Dept. of Civil and Environmental Engineering and Architecture, University of Cagliari, Marengo Street Cagliari
(
[email protected],
[email protected])KEY WORDS: laser scanning, surveying, error, orthoimage, georeferencing, accuracy
ABSTRACT:
Cagliari, county seat of Sardinia Region (Italy), situated in the southern part of the island, is characterized by a subsoil full of cavities. The excavations in fact, which lasted more than 4000 years, had a great development due also to the special geological characteristics of the city subsoil. The underground voids, which the city is rich in, belong to different classes such as hydraulic structures (aqueducts, cisterns, wells, etc.), settlement works (tunnels, bomb shelters, tombs etc.) and various works (quarries, natural caves, etc.). This paper describes the phases of the survey of a large cavity below a high-traffic square near the Faculty of Engineering in the city of Cagliari, where the research team works.. The cave, which is part of a larger complex, is important because it was used in the thirteenth century (known as the Pisan age) as a stone quarry. There are traces of this activity that have to be protected. Moreover, during the last forty years the continuous crossover of vehicles cracked the roof of the cave compromising the stability of the entire area. Consequently a plan was developed to make the whole cavity safe and usable for visits. The study of the safety of the cave has involved different professionals among which geologists, engineers, constructors. The goal of the University of Cagliari geomatic team was to solve two problems: to obtain geometrical information about the void and correctly place the cave in the context of existing maps. The survey and the products, useful for the investigation of the technicians involved, had to comply with tolerances of 3 cm in the horizontal and 5 cm in the vertical component. The approach chosen for this purpose was to integrate different geomatic techniques. The cave was surveyed using a laser scanner (Faro Photon 80) in order to obtain a 3D model of the cave from which all the geometrical information was derived, while both classic topography and GPS techniques were used to include the cave in the city map.
1. INTRODUCTION
1.1 Purpose of this work
Among the available techniques for the study of underground cavities, as long as they are accessible, first place goes to the topographic technique. This is because it produces geometric spatial information which is geo-referenced according to the official reference frame, thus correctly placing the cavity on the urban map both horizontally and vertically. In the context of a study involving experts of different fields, such as geologists, geotechnicians, structural engineers etc., a topographer's job is to produce valid documentation that can be used by each of them. We have therefore a range of products such as traditional maps, vertical and horizontal sections, 3D models of the cavity and the corresponding streets above-ground, textured with photographic images. The first two allow us to determine high precision areas, volumes, heights etc., as needed in order to design and carry out the consolidation and restoration works of the cavity. The latter, on the other hand, permits a visual inspection of the object under investigation and to measure distances without physically accessing it, being a valuable tool for both direct inspection of the cavity and validation of other techniques. If the void is located in a urban area, the contractors of the stabilization works face further problems both in the design phase and in securing a site for the campaign operations: placing the boundaries of the underlying cavity on the map, performing excavations without interfering with the underground utility networks, and locating the area for the working site and the heavy equipment. The realization of products responding to these needs requires the integration of
different geomatic survey methods such as remote sensing, traditional topography, photogrammetry, and laser scanning. These requirements have been evidenced in other papers as in Grussenmeyer P. et al. (2010) and examined by us in the survey of a cavity called "of the collapse" located under the Piazza d'Armi square next to the department of Civil and Environmental Engineering and Architecture (DICAAR) of the University of Cagliari (Italy), working place of the research group. The cavity is part of a complex of four natural and artificial caves and ancient water tanks, including a second cavity, named "Su Stìddiu" ("The Drop"), located below the same square.
The stability problems caused by the presence of the cavity, have prompted the authorities to investigate the area in depth obtaining information related both to the geometry, in particular shape and size, and to the geotechnical aspects. The issues which had to be addressed were many and related to the knowledge of the correct horizontal positioning of the cave, of its positioning relative to the square ground level and finally the positioning compared to other cavities next to it, like Su Stiddiu. As an example, for the geotechnical studies, the technicians needed to perform the boreholes that, if executed prior to the georeferencing, could end up in areas not affected by the cave or related to voids not connected to those under investigation.
The useful products to study the cavity are listed below: 1. a map showing the boundaries of the cave in the ROMA40-Gauss-Boaga national mapping system, in order to overlap it with the map of the telecommunication, electrical, water supply networks;
2. Volume of the cavity;
Sections in both North-South and East-West directions; ISPRS Annals of the Photogrammetry, Remote Sensing and Spatial Information Sciences, Volume II-5/W1, 2013
3. Global 3D model of the cavity, enabling the study of the cave without having to enter it, thus removing the hazardous risks for the geologist;
4. Boreholes location, performed in 1987 and in 2011, in the national reference frame.
The survey and the products, useful for the investigation of the technicians involved, had to comply with tolerances of 3 cm in the horizontal and 5 cm in the vertical component. The procedure which was put into effect to meet the demands and obtain the products listed above, is described hereinafter. In particular, after a short description of the places, the chapter two is dedicated to the description of both surveys, topographic and laser scanner, and their relative data processing. Furthermore, in the same chapter the description of the results of the analysis can be found. In chapter three the products are described and finally in chapter four the conclusions are drawn.
1.2 Study Area
From the nineteenth century the area was used as a quarry of
pietra cantone stone, an excellent building material with which
many houses in the city were built. That activity, towards the end of the first half of the twentieth century had been abandoned (Cilla, 2012). The development of Cagliari, mainly after World War II, caused the caves to be incorporated into the urban fabric, so that in the present day the cavity expands under a strategic road junction constantly crossed by vehicles and buses. Moreover, many trucks pass through the square, also directed to the compound of the faculty of engineering, at the pavilion for the models of large structure where tests with heavy loads are often performed.
During the last forty years the continuous crossover of vehicles has cracked the roof of the cave compromising the stability of the entire area, to such an extent that since the last year, for safety reasons, transit for heavy vehicles has been forbidden. The cavity is nowadays accessed through a manhole located on the pavement in Via Is Mirrionis, heading towards Piazza d'Armi. After a short stretch of concrete encasement and regular stairs, recently built to access the cave, the corridor continues for about 31 meters, with both floor and walls made of natural material and variable heights of around 1.5 m. The passage opens into an atrium which works as a hallway to two areas under Piazza d’Armi square. The first one towards the Faculty of Humanities consists of two chambers separated by a stone slab not less than 3 m thick supported down the hall by two pillars of variable cross-section of around 1.5 m, which extend over an area of about 32x15 m2. The first room on the ground floor is partially under water while the upper floor (second room) is interrupted by a retaining wall, from which we understand that the cavity continues beyond the explored area.
Figure 1. View of the two rooms toward Faculty of Art from the atrium (image produced by the laser scanner)
Turning left from the hallway one arrives to the wide cavity,
hence called the third room, occupying the largest part beneath Piazza d’Armi square and skimming the Faculty of Engineering. In this room, extending to an area of about 25x40 m2, a large collapse of the dome is present, which obstructs the entrance. Therefore, it is possible to enter through two passages; one under Via Marengo and the other under the square. As in the second room, here too a retaining wall is present whereby we understand that the cave also extends towards the center of the square. Furthermore, immediately after entrance into this room, there is an opening in the base of the wall, revealing the presence of a fourth room, whose entrance is almost entirely obstructed. A rough survey with a Disto D8 showed that the room extends non more than 7 metres towards the square. The ceiling of this fourth room is more or less at the same level of the third room’s basement , so that we deduce that there’s at least one other layer below the current one, filled with sediments. Overall, the cavity expands for about 48 m to the east, 53 m to the north direction and with a height difference of 21 m, the bottom cave being at 59.40 m above the mean sea level.
2. SURVEY AND PROCESSING DESCRIPTION
The complete survey of the cave of Piazza d’Armi was carried out by the team of the researchers and technicians of the DICAAR. Prior to the survey operations, two inspections were conducted to assess the extent and shape of the cave in order to properly design the number and location of the laser scanning and the topographic survey design. Moreover we had to choose the kind of the targets necessary for the recognition of homologous points of the laser scanner point clouds since the walls in the cave didn’t have adequate natural point recognizable. We had to understand how to attach them to the walls, the number of these targets and finally the approximate location of the stations of the topographic reference network.
Figure 2. Corridor entry to the third room
The survey operations took 6 days: on the first and second day both the laser scanner and detailed topographic measures of the cave were carried out. On the third day the laser scanner measures of the square were made, for which it was necessary to close the entire area to traffic, and on the fourth day the topographic survey was finished by sighting the points inside the cavity though the boreholes. The latter operation allowed us to evaluate the misclosure of the topographic traverse. Finally on the fifth and the sixth day the GPS survey of the points on the square and the traverse had to be connected to those inside the cave.
The survey is divided in two parts:
1. Laser scanner survey of both the cave and the Piazza d’Armi square;
2. Topographic survey of the network for georeferencing the single scans and all derived products.
2.1 Laser scanner survey
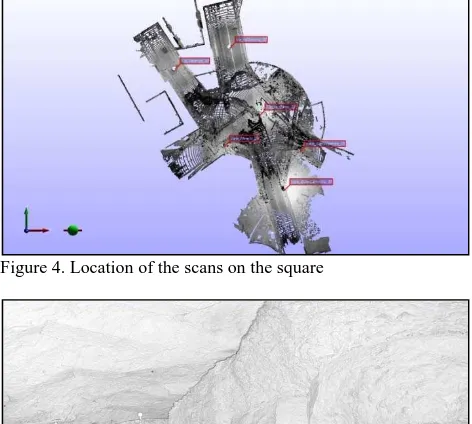
The laser survey was performed using a Faro Photon 80 (Faro, 2008) scanner, whose characteristics are summarized in the table 1. For all scans a sampling configuration with spacing between the points, both in horizontal and vertical direction, was adopted, of about 6 mm to 10 m (largest distance between the points of the cave and the laser station). Twelve scans were performed within the cavity and six scans on the Piazza d'Armi square. The following images in Figure 3 and Figure 4 show the position of the stations of every scan. It was not possible to detect the floor of the first room toward the Faculty of Humanities because of the presence of standing water.
Ranging unit
Distance 0.6 -76 m
Resolution 0.6 mm – 17 bit/range Speed measure 120000 points/sec Error distance ±2 mm a 25 m
Deflector
V F.O.V 320°
H F.O.V 360°
V Res 0,009°
H Res 0,00076°
Ang. Res ±0,009°
Scan Time a 3 mln of points 30 sec Laser
Power 20 mW (Class 3R)
Wavelength 785 nm
Beam divergence 0,16 mrad (0,009°) Diameter of the beam 3,3 mm (circular)
Table 1. Characteristics of the laser scanner used for the survey
The survey phase of the scans was preceded by the positioning of the targets, useful for the subsequent pre-alignment between adjacent scans and the georeferentiation. The signalization was done by placing polystyrene spheres of 5 cm and 12 cm in diameter along the walls, on the dome and on the bottom of the cave (Figure 5). Each 12 cm sphere was assigned a unique number which was then written on it, in order for it to be identified on the scans.
Altogether 85 spheres of 5 cm in diameter were positioned, coupled to an equal number of 12 cm in diameter.
Figure 3. Location of the scans inside the cave
2.2 Scans processing
As explained in Vacca et al. (2012), all data processing was performed in the JRC Reconstructor 2 software (ver. 2.7.0.164) (Gexcel, 2007, Sgrenzaroli et al. 2007). The scans processing was performed according to the following sequence:
-Filtering and editing of each scan;
-Pre-alignment and union of the scans to obtain a single cloud of points;
-Creating the mesh to obtain the cavity and the square surfaces;
-Globally georeferencing scans and mesh in the Gauss-Boaga Reference System and elevations;
-Generations of delivery products contained in the project.
2.3 Filtering and editing of the scans
The filtering step allows us to delete the points which do not meet the conditions of precision fixed in the survey phase, mainly due to the fact that the surfaces on which the laser beam falls are not sufficiently reflective (do not return enough energy) to provide a reliable measure. Once the filtering parameters have been set, this step is performed automatically by the software.
Figure 4. Location of the scans on the square
Figure 5. Targets arrangement
The editing phase was instead carried out manually, by cutting out those parts those that were not useful for the knowledge of the object. This operation concerned mainly the point clouds of the square where branches of the trees, trolley wires or other disturbances were eliminated.
2.4 Alignment and union of the scans
Each scan is related to its local origin, therefore, to be able to get the object in a single "cloud" of points it was necessary to align the scans to each other. In advance the alignment was obtained collimating the homologous points in the adjacent scans which, as said before, were constituted by polystyrene spheres visible in both scans. Through the recognition of the spheres it was possible to perform the pre-alignment with an average deviation of 3-4 cm. the following alignment phase, carried out automatically by the software, produced the results summarized in Table 2. The process of alignment was ISPRS Annals of the Photogrammetry, Remote Sensing and Spatial Information Sciences, Volume II-5/W1, 2013
conducted on a step by step basis. The central scan (located near the hallway) has been left fixed and all the others have been referred to it. The scans have been aligned one by one, adding them to the cloud formed by the scans already aligned. Each time a scan was added the process of alignment was repeated. The number of iteration, for each alignment, depends on the threshold imposed to the residuals and on the minimum number of homologues points the software has to consider. Both for the cave and the square alignment a value of 0.01 m was set for residuals and a value of 1000 was set for the number of homologues points. To complete the process, 17 iterations to align the scans in the cave and 13 iterations to align those on the square, in average were necessary.
The mean residual of 9.02 mm on the square is almost an order of magnitude larger than in the cave, equal to 1.79 mm, due to the distances involved. In fact the average distance between scanner and points on the square was about 25 m. while in the cave was about 7 m, leading in the last case to denser clouds, which in turn leads to a better alignment.
After the alignment, all scans were related to a single reference frame corresponding to that of the first.
The subsequent georeferencing of the cave, in the Gauss-Boaga mapping reference frame, was performed through a 7-parameters transformation that does not deform the cave. From now on, it was possible to merge the scans and create different meshes both for the cave and for the square above.
Block of scans cave square
Average of the homologous point used 1528 1473 Average of the iterations number 17 13
Average error (mm) 1,79 9,02
Table 2. Scans alignment deviations
2.5 Surveying the Local Topographic Network
The local topographic network was built in order to determine the coordinates of the targets placed inside the cave and on the square, so as to place the whole laser survey in the official reference frame.
The network was built by materializing and surveying points both on the square and inside the cave, connected to each other through a closed traverse developing down through the cave's access path and then back up to the square through the boreholes.
2.6 Survey on the square
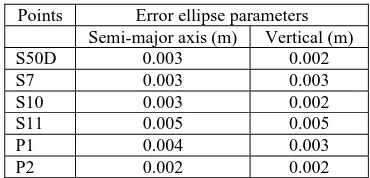
On the square's pavement six stations were monumented, named P1 (near the manhole acting as entrance to the cave), P2 (as reference direction at the opposite side of the square), S50D, S7, S10, S11,placed on the boreholes with the same names, materialized by making a 4 mm hole in the borehole covers. The stations, acting as control points for the network inside the cave, were observed with a static GPS survey, with an occupation time of 30 minutes for each point, taking as a known point the GCAG permanent station of the SARNET (reference) active network, coherent with the ETRS89 reference frame and about 3 km away from Piazza d'Armi square. The error ellipse parameters are shown in the following table 3.
2.7 Surveying the Boreholes
From the points S50D, S7, S10, S11, through the boreholes, four near vertical courses of a traverse were run in order to survey on the square as many points as in the cave. The TG2b theodolite by Galileo, with a precision of 10'' and the ability to measure near-nadiral angles, was used for this operation. The
Points Error ellipse parameters Semi-major axis (m) Vertical (m)
S50D 0.003 0.002
Table 3. Error ellipse parameters of the GPS point surveyed on the square
observed points were monumented using topographic spikes. The slope distance between points was measured by using a 25 m steel tape.
2.8 Network inside the cave
Independently from the survey on the boreholes, a traverse was run starting from station P1 and developed along the path leading down to the three explored rooms of the cave. Three more points were monumented (ST1, ST2 and ST3) in order to survey the four points observed from the square. Moreover fifty-four targets, out of eighty-five used for the scans alignment, were then surveyed as shots at each of the stations ST1, ST2 and ST3 from which they were visible, in order to perform the point clouds georeferencing. The survey operations were performed using a Nikon DTM-410 total station (with an angular precision of 5'' and a distance measurement precision of 3 mm + 5 ppm).
Summarizing 14 stations were set, 8 of which free, and 19 slope distances, 19 zenith observations, 33 direction observation were collected. The ratio between measurements and unknowns was of 2.96. The Table 4 shows the results of the adjustment while the Figure 6 is a sketch of the network, of the measurements and of the error ellipses.
Table 4. Error ellipses parameters after adjustment
2.9 Georeferencing of the points cloud in the ROMA40 national reference system
Given that the cave had to be positioned in the local reference system, the coordinates of the target were converted from the ETRF1989 to the ROMA40 reference frame using the official utility provided by the IGM (Istituto Geografico Militare, the official Italian cartographic agency) (Ministero dell’Ambiente della Tutela dell’Ambiente e del Mare, 2013), applying the conversion grid corresponding to the Cagliari section. Also, the elevations were converted from ellipsoidal to orthometric ones. Once the coordinates of the spheres on the map coordinate system were obtained, the points, together with those surveyed on the square, were imported into the JRC Reconstructor software and collimated in the scans' reference frame, obtaining
Station Semi-Major
car_S50D 0.014 0.013 185.15 0.019
car_S7 0.028 0.022 123.99 0.019
Figure 6. Sketch of the local network
a set of double coordinates. This allowed us to determine the Helmert transformation parameters, useful to convert the point clouds coordinates from the scans reference frame to the ROMA40 one.
To estimate the parameters 21 out of the 54 target surveyed inside the cave, and 3 points surveyed on the square were used. The collimations were performed on the small spheres, the larger one, coupled to the smaller, had the purpose of favoring the collimation where the latter would not have been visible enough.
The residuals of the processing on the double points have a rms of 0.012 m eastbound, 0.018 m northbound and 0.027m in elevation.
The 33 points in the cave not used for the transformation were used as check points. After the georeferencing, the coordinates of each point were extracted from the cloud and compared with those measured topographically. An rms of 0.025 m horizontally, 0.011 in elevation were found. Since this was within the tolerance (3 cm in horizontal, 5 cm in vertical), all the coordinates of the scans were converted to the state plane coordinate of the Gauss-Boaga mapping system. Similar results have been obtained in works analogous to our work such us in the survey of the Dachstein South Face Cave in Styria (Austria) (M.F. Buchroithner et al., 2009).
2.10The products
The requirements described above were answered through the creation of a three-dimensional model (Figure 7 and Figure 8). The cave was also included in the cartography and in the subservice network. Also the complete 3D model allowed geologists to exclude the ‘Su Stiddiu’ cave from the study to make the area safe; in fact, this cavity falls mainly off the road in a part that is not accessible and which has been converted into a green area.
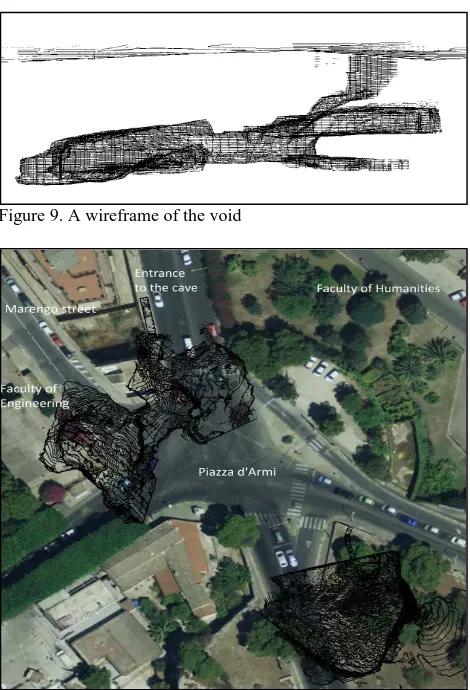
All the information related to geometry, such as area and partial and global volumes, were assessed by means of a simplified cloud and a wireframe model obtained sampling points on a 1.0 m spacing (Figure 9).
The georeferencing of the cave on the orthophoto was done with a scale of 1:2000 (Figure 10) and, in order to answer to the issues related to the study of the geometry of the cavity and of the interconnections with the other cavities, the orthophoto of the dome was realized (e.g. Figure 11). This allowed the geologists to carry out the visual analysis needed to identify and trace the faults safely.
Figure 7. Model of the Piazza d’Armi square
Figure 8. Global 3D Model: in the left side is shown Su Stiddiu cave
Figure 9. A wireframe of the void
Figure 10. Contour lines of the cavities superimposed on the orthophoto at the 1:2000 scale. The cave under investigation is on the north-west side, while the great cave ‘Su Stiddiu’ is on the south-east side of the picture. The boundaries of both caves are uncertain due to the impossibility to explore some rooms. ISPRS Annals of the Photogrammetry, Remote Sensing and Spatial Information Sciences, Volume II-5/W1, 2013
Figure 11. Orthophoto of the cave dome (looking upward from inside): cracks on the ceiling.
3. CONCLUSION
All the operations described above have allowed us to achieve the complete model of the area in which the Piazza d'Armi cave lies. The specific conditions of the cavity required a careful design of the survey both in the number and in the position of the scanning points and in relation to the type of target used. The creation of the 3D model and the georeferencing of the cave in the cartography has been an aid in studies made with other disciplines. All operations performed have allowed us to obtain and to check the declared precision of 3 centimeters in horizontal and 5 cm in elevation. The laser scanning technique turned out to be the best choice, compared to the traditional topographic survey, as we were able to obtain all the required products. This conclusion is in according to another experience analogous to our own such as that already mentioned.
The correct positioning both horizontally and vertically, together with the analysis of the boreholes, has allowed the reopening of the traffic and the tracing of the routes of the heavy vehicles in order to keep them inside those areas where the load-bearing capacity of the underlying rock has been deemed suitable.
The further survey and the georeferencing of the cave of Su Stiddiu, cavity close to the cave of Piazza d'Armi, responded to the question relating to the supposed interconnection of the two cavities in a single system of voids.
In relation to the need to secure the cavity and safeguard the technicians and operators who accessed it for their studies, the cave was declared unfit for use until all examinations were complete in order to make it available for tourist use. After the study it was decided to fill cave, partially at least, meaning that the laser scanner survey remains the only memory of this ancient man activity.
This case study has demonstrated that using a single geomatic technique is not sufficient in order to obtain the required products.
Some of the adopted solutions, such as the nadiral sighting (commonly used in mining surveys), the handling of multiple (local and global) reference systems, and the data management of a GIS, vouch for the importance of integrating the various geomatic techniques so that the final products are actually complete and effectively usable as required by other technicians.
4. BIBLIOGRAPHY
References from Journals:
M.F. Buchroithner, T. Gaisecker, D. Gaisecker, Horn, Österreich, 2009. Terrestrial Laser Scanning for a visualization of a complex dome in extreme alpine cave system,
GeoInformation, 4-2009, pp. 329-339
Cilla C., Vargiu M., Migliorini A., Sarritzu L., Sanna R., Randaccio F., Piras G., 2012. Mappatura delle cavità artificiali del sottosulo cagliaritano (Sardegna), Opera Ipogea, 2-2012, pp.43-55.
References from Books:
Sgrenzaroli M., Vassena G. (2007). Tecniche di rilevamento tridimensionale tramite laser scanner. Collana Topografia e
Cartografia Starrylink Editrice Brescia ISBN:
978-88-89720-73-8
References from Other Literature
Faro Photon Laser Scanner 20/80, 2008. User Manual, Faro Scanner Production GmbH.
Grussenmeyer, P., Landes, T., Alby, E., Carozza, L. (2010). High Resolution 3D Recording and Modelling of the Bronze Age Cave « Les Fraux » in Périgord (France). In: International
Archives of Photogrammetry, Remote Sensing and Spatial Information Sciences, Vol. XXXVIII, Part 5, Commission V
Symposium, Newcastle upon Tyne, UK. 2010, ISSN 1682-1777, pp. 262-267.
Vacca G., Deidda M., Dessì A. Marras M., J., 2012. Laser Scanner Survey To Cultural Heritage Conservation And Restoration, XXII ISPRS Congress, Melbourne, Australia, Volume XXXIX-B5, pp. 589-594.
References from websites:
Ministero dell’Ambiente e della Tutela del Territorio e del Mare, 2013. Report of Italian Geoportal “Specifiche tecniche del servizio di trasformazione di coordinate”,
http://www.pcn.minambiente.it
Gexcel, 2007, JRC Reconstructor software, www.gexcel.it ISPRS Annals of the Photogrammetry, Remote Sensing and Spatial Information Sciences, Volume II-5/W1, 2013