MEASUREMENT OF SUN INDUCED CHLOROPHYLL FLUORESCENCE USING
HYPERSPECTRAL SATELLITE IMAGERY
S.M. Irteza a, *, J.E. Nichol a
a Department of Land Surveying and Geo-Informatics, The Hong Kong Polytechnic University, Kowloon, Hong Kong – syedmirteza@gmail.com
Commission WG VIII/8
KEY WORDS: Forest stress analysis, Hyperspectral Image analysis, Sun Induced Chlorophyll Fluorescence, Hong Kong, Hyperion satellite images, Vegetation Indices
ABSTRACT:
Solar Induced Chlorophyll Fluorescence (SIF), can be used as an indicator of stress in vegetation. Several scientific approaches have been made and there is considerable evidence that steady state Chlorophyll fluorescence is an accurate indicator of plant stress hence a reliable tool to monitor vegetation health status. Retrieval of Chlorophyll fluorescence provides an insight into photochemical and carbon sequestration processes within vegetation. Detection of Chlorophyll fluorescence has been well understood in the laboratory and field measurement. Fluorescence retrieval methods were applied in and around the atmospheric absorption bands 02B (Red wavelength) approximately 690 nm and 02A (Far red wavelengths) 740 nm. Hyperion satellite images were acquired for the years 2012 to 2015 in different seasons. Atmospheric corrections were applied using the 6S Model. The Fraunhofer Line Discrimanator (FLD) method was applied for retrieval of SIF from the Hyperion images by measuring the signal around the absorption bands in both vegetated and non vegetated land cover types. Absorption values were extracted in all the selected bands and the fluorescence signal was detected. The relationships between NDVI and Fluorescence derived from the satellite images are investigated to understand vegetation response within the absorption bands.
1. INTRODUCTION
Retrieval of fluorescence signal provides a unique understanding of global vegetation photosynthesis cycle as there is no specific space based observation platform measuring vegetation fluorescence (Moreno et al., 2006). Particularly, SIF is the direct indicator of canopy photosynthesis and gives quantitative measure of carbon sinks (Coops, 2015). SIF technique consider to be very fast and sensitive approach for the detection of physiological response of vegetation cover (Guanter et al., 2014). Red and far red fluorescence bands are more suitable to measure vegetation health. In Frauhonfer Line Depth (FLD) method, SIF is calculated in radiance unit by considering the Sun irradiance. Radiative properties of the leaves of the plant affect the reflectance from canopies of vegetation. Fluorescence signal can be detected in the atmospheric absorption bands (Guanter et al., 2007).
Healthy green vegetation emits chlorophyll fluorescence signal maxima in the red and far red around 690 nm and 740 nm, respectively. Fruanhofer lines or oxygen absorption lines such as O2-A and O2-B bands provide the main fluorescence bands. Recent studies (Goetz, 2009, Raychaudhuri, 2014a) have shown that retrieval of SIF is possible using hyperspectral images such as from the Hyperion satellite. We applied the modified FLD method using O2-A and O2-B band of Hyperion satellite images. In this study only comparisons of O2-A with the NDVI values are presented.
2. DATA USED 2.1 Satellite Data
For this project, a request for cloud free Hyperion images was submitted and eight Hyperion images were obtained (Table 1).
Table 1: Hyperion Satellite images acquired for the retrieval of fluorescence signal.
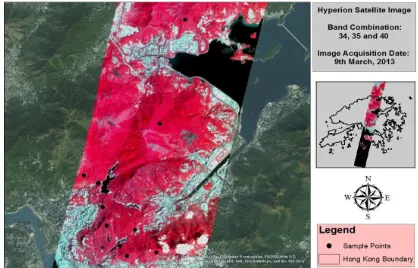
Figure 1 shows the Hyperion image over Hong Kong region. 10 sample sites were also shown over the image at different sites in the Hong Kong country parks.
Date Cloud Cover (%)
Solar Elevation
Solar Azimuth
Look Angle
3-Nov-12 40 44.514 143.129 -7.697 3-Dec-13 20 35.365 142.179 -9.748 9-Mar-13 10 46.756 124.254 -10.550 22-Sep-14 20 47.489 115.903 -2.317 8-Oct-14 20 44.202 123.550 -6.360 14-Feb-15 30 44.202 123.550 -6.360 17-Apr-15 20 46.471 98.922 -6.104 6-Aug-15 20 45.040 88.266 -3.684
Figure 1: Hyperion Image of Hong Kong Region
The International Archives of the Photogrammetry, Remote Sensing and Spatial Information Sciences, Volume XLI-B8, 2016 XXIII ISPRS Congress, 12–19 July 2016, Prague, Czech Republic
This contribution has been peer-reviewed.
3. METHODOLOGY 3.1 Satellite Data Pre-processing
To investigate the fluorescence, L1Gst Product o converted into surface reflectance using Atmospheric correction model 6S proved to giv results over all surfaces in the Hong Kong regio 2014). For SIF based fluorescence retrieval, bands. For O2-fluorescence retrieval B33, B34, as shown in Table 2.
Table 2: Hyperion Selected Band Central Wavel
3.2 Retrieval of Sun Induced Fluorescence (S SIF in the O2-A and O2-B spectral waveleng retrieved using the FLD method after applyin tasks. For this we selected 10 sites based on can of forest (CC > 75%). A total of 10 non vegeta the vegetated sites were also selected.
The fluorescence signal was retrieved from bot non vegetated sites by calculating difference at inside and outside for the O2-A and O2-B absor and which can be expressed as three wavelen outside the band (Equation 1) (Raychaudhuri, 20
D = ωLLL + ωRLR - LF LF= Radiance corresponding to the wavelength
and are the relative weights of the absor represented by the following equations (2) and e
and
On each sample site windows of 5 X 5 pixels and the average was taken. Fluorescence value as a percentage i.e the fluorescence emission vegetation, estimated as a percentage of the a radiance for vegetation outside the absorption reported results are normalized for compariso comparing the fluorescence retrieved value wi value in different seasons and in differ
understanding of fluorescence retrieval m has been presented.
4. RESULTS 4.1 NDVI Extraction
We summarize our results according to fou
(a) December, January, February (W
(b) March, April, May (Spring, MA
(c) June, July, August (Summer, JJA
(d) September, October, November
All ten vegetated sites were selected i showed NDVI values greater than 0.5. F winter and spring season, NDVI value wa than 0.6 in most of sites.
Figure 2: Normalized Difference Vege calculated for the Hyperion images acq seasons (a) - Winter (DJF), (b) - Spring (M
4.2 O2A Fluorescence
The pattern of fluorescence signal is shown A band for all the months at 10 different si
For Winter (DJF) decreased fluorescence throughout the O2-A band except at sit sudden increase in fluorescence signal i (MAM) the fluorescence signal shows sim all the selected sites in O2-A except at increase in O2-A band was detected. Fo increase in fluorescence for O2-A band at Autumn season (SON) at site 3 ther fluorescence signal in O2-A Band.
Figure 3: Chlorophyll fluorescence in seasons obtained from O2-A bands of Hyp Spatial
four seasons which are;
(Winter season, DJF) acquired over different (MAM)
intensity for different yperion.
The International Archives of the Photogrammetry, Remote Sensing and Spatial Information Sciences, Volume XLI-B8, 2016 XXIII ISPRS Congress, 12–19 July 2016, Prague, Czech Republic
This contribution has been peer-reviewed.
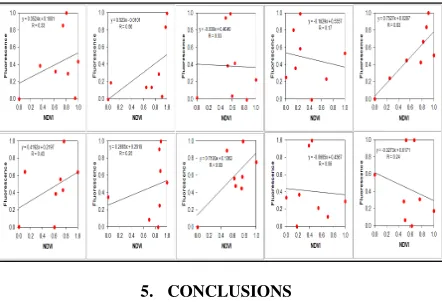
4.3 Relationship Between NDVI and SIF for O2A Band
For the purpose of the validation of the fluorescence value and to observe the trend of both NDVI and fluorescence, a comparison between NDVI and Fluorescence were also performed as shown in Figure 4. It showed that at site 3 and site 9 correlation between both NDVI and fluorescence is around 0.03 and 0.06 respectively which is very low despite of the fact that the highest NDVI value is detected on both sites. For site 5 and site 8 highest correlations were detected between NDVI and fluorescence. Some other factors might affect the retrieved fluorescence value. Those reasons might include AOD high values, soil contamination and any other variable effecting the retrieval of fluorescence value.
Figure 4: Relationship between NDVI and Fluorescence derived using O2A bands of Hyperion from 2012 to 2015 for sites ten vegetation sites
5. CONCLUSIONS
Retrieval of chlorophyll fluorescence was performed by applying the FLD method. The fluorescence results were then compared with the NDVI values. Based on the established theory, fluorescence should behave linearly with the NDVI values but error should be expected if atmospheric parameters such as water vapour and aerosols were not eliminated with great care and accurate measured values. Preliminary results suggest that SIF correlates highly with NDVI at some selected sites and on some sites, a very low correlation exhibit between SIF and NDVI. Next phase of this study will consider possibility of analyzing rainfall data and field spectrometer data to see any possible cause of these variations. Fluorescence retrieval from O2-A bands from the Hyperion image and its relation between NDVI values shows that the correlation is within acceptable range which solidified the basic methodology.
REFERENCES
Coops, N. C., 2015. Characterizing Forest Growth and Productivity Using Remotely Sensed Data. Current Forestry Reports.
Goetz, A. F. H., 2009. Three decades of hyperspectral remote sensing of the Earth: A personal view. Remote Sensing of Environment, 113(2009), S5–S16.
Guanter, L., Alonso, L., Gómez-Chova, L., Amorós-López, J., Vila, J., & Moreno, J., 2007. Estimation of solar-induced vegetation fluorescence from space measurements. Geophysical Research Letters, 34(8), L08401.
Guanter, L., Zhang, Y., Jung, M., Joiner, J., Voigt, M., Berry, J. a, … Griffis, T. J., 2014. Global and time-resolved monitoring of crop photosynthesis with chlorophyll fluorescence.
Proceedings of the National Academy of Sciences of the United States of America, 111(14), E1327–33.
Moreno, J. F., Asner, G. P., Bach, H., Belenguer, T., Bell, A., Buschmann, C., … Court, A., 2006. FLuorescence EXplorer ( FLEX ): mapping vegetation photosynthesis from space, pp. 832–837.
Nazeer, M., Nichol, J. E., & Yung, Y., 2014. Evaluation of atmospheric correction models and Landsat surface reflectance product in an urban coastal environment. International Journal of Remote Sensing, (April 2015), pp. 37–41.
Raychaudhuri, B., 2014a. Solar-induced fluorescence of terrestrial chlorophyll derived from the O 2 -A band of Hyperion hyperspectral images. Remote Sensing Letters, 5(11), pp. 941–950.
The International Archives of the Photogrammetry, Remote Sensing and Spatial Information Sciences, Volume XLI-B8, 2016 XXIII ISPRS Congress, 12–19 July 2016, Prague, Czech Republic
This contribution has been peer-reviewed.