Soltanpour, P.N., G.W. Johnson, S.M. Workman, J. B. Jones Jr., and Wells, B.R. 1980. Zinc nutrition of rice growing on Arkansas soils. R.O. Miller. 1996. Inductively coupled plasma emission spectrome- Ark. Agric. Exp. Stn Bull. 848. Univ. of Arkansas, Fayetteville, AR. try and inductively coupled plasma-mass-spectroscopy. p. 91–140. Yilmaz, A., H. Ekiz, B. Torun, I. Gultekin, S. Karanlik, S.A. Bagci, InD.L. Sparks (ed.) Methods of soil analysis: III. SSSA Book Ser. and I. Cakmak. 1997. Effect of different zinc application methods
5. SSSA, Madison, WI. on grain yield and zinc concentration in wheat cultivars grown on
Thompson, L.F., and N.R. Kasireddy. 1975. Zinc fertilization of rice zinc-deficient calcareous soils. J. Plant Nutr. 20:461–471. by seed coating. Rice J. 78:28–29.
Nitrogen Fertilization of No-Till Cotton on Loess-Derived Soils
Donald D. Howard,* C. Owen Gwathmey, Michael E. Essington, Roland K. Roberts, and Mike D. Mullen
ABSTRACT mature senescence and reduced yields (McConnell et
al., 1995).
Information on nitrogen (N) fertilization of no-till (NT) cotton
Research conducted within the mid-South shows that
(Gossypium hirsutumL.) is needed to optimize lint yields and
earli-the optimum N rate for cotton production varies with
ness. We evaluated five N rates and three application methods for
NT cotton production on Loring silt loam (fine-silty, mixed, active, location, soil type, tillage system, winter cover, and
ap-thermic Oxyaquic Fragiudalfs) with natural winter annuals as a cover; plication method. On conventionally tilled (CT) Dun-and on Memphis silt loam (fine-silty, mixed, active, thermic Typic dee very fine sandy loam (fine-silty, mixed, active, ther-Hapludalfs) having corn (Zea mays L.) stover as a cover and on mic Typic Endoaqualfs), Ebelhar and Welch (1996) Lexington silt loam (fine-silty, mixed, active, thermic Utlic Hapludalfs) reported optimum yields from banding 50% of the N having winter wheat (Triticum aestivumL.) as a cover. Nitrogen rates
at planting followed by banding 50% at pinhead square.
of 0, 34, 67, 101, and 134 kg ha21were either broadcasted as
ammon-Their evaluation included N rates (67–168 kg ha21) and
ium nitrate (AN) or injected as urea–ammonium nitrate (UAN) at
application timing (at planting and three splits) from
planting. Additional treatments included broadcasting 67 kg N ha21
which they concluded that the 50–50 split application
as AN at planting with either 34 or 67 kg N ha21banded 6 wk later.
of 101 kg N ha21 resulted in the highest yields. In an
Relative to no N, broadcasting 67 kg N ha21as AN increased 4-yr
average NT lint yields on Loring silt loam from 739 to 1281 kg lint additional study, Ebelhar et al. (1996) showed that in-ha21and 2-yr average yields on Lexington silt loam from 1086 to 1535 jecting a 50–50 split (at planting and pinhead) at a higher
kg ha21. A higher N rate (101 kg N ha21) was needed to increase
2-rate (134 kg N ha21) resulted in maximum cotton yields
yr average yields on Memphis silt loam from 821 to 1169 kg ha21.
on CT Bosket very fine sandy loam (fine-silty, mixed,
Broadcasting AN was a satisfactory placement method producing active, thermic Typic Hapludalfs) and Dubbs silt loam yields equal to or higher than injecting UAN or splitting AN for
(fine-silty, mixed, active, thermic Typic Hapludalfs). In
NT cotton produced on these loessial soils despite different covers
Mississippi, Thompson and Varco (1996) reported that
and residues.
broadcasting 121 kg N ha21as ammonium nitrate (AN) and injecting 110 kg N ha21as urea–ammonium nitrate (UAN) produced maximum NT cotton yields on
Mari-N
itrogen(N) fertilization affects yield, maturity, andetta fine sandy loam (fine-loamy, siliceous, active, ther-lint quality of cotton. Evaluating N rates, sources,
mic Fluvaquentic Eutrudepts). Hutchinson et al. (1995) and application timing for optimum lint production has
reported the need for a higher N rate for both CT and been a major research emphasis within the cotton
pro-NT cotton production on Gigger silt loam (fine-silty, ducing states. For cotton, applying an optimum N rate
mixed, active, thermic Typic Fragiudalfs) having a win-is essential and may differ within the production areas
ter wheat cover. Their research indicated that NT yields due to climatic or soil differences. An optimum N rate
were increased with injected N up to 78 kg ha21when should maximize yields, while excessive or inadequate
native winter vegetation was the cover, while yields were N applications may reduce cotton yields (Maples and
increased with N rates up to 118 kg ha21 with winter Keogh, 1971). High N fertilization may produce
exces-wheat. sive vegetation that delays maturity and harvest, and
In Tennessee, cotton yields were maximized at lower these conditions may reduce yields and lint quality
dur-N rates than were reported for surrounding states. Yield ing years of early frost or prolonged fall rain
(Hutchin-response to N fertilization by CT cotton on well-drained son et al., 1995; McConnell et al., 1995). Crop maturity is
loessial upland soils ranged from 34 kg N ha21(Overton a critical production consideration for cotton producers
and Long, 1969) to 67 kg N ha21 (Howard and Hos-along the northern edge of the U.S. Cotton Belt
(Gwath-kinson, 1986). From a review of Tennessee research, mey and Howard, 1998). Nitrogen deficiency causes
pre-Howard and Hoskinson (1990) reported that CT cotton yield responses to N fertilization varied with soil and physiographic position. The current N recommendation D.D. Howard and C.O. Gwathmey, Plant and Soil Sciences Dep.,
Univ. of Tennessee, West Tennessee Exp. Stn., Jackson, TN 38301; for Tennessee cotton production, regardless of tillage, M.E. Essington and M.D. Mullen, Plant and Soil Sciences Dep., Univ. is to apply 34 to 67 kg N ha21 to alluvial soils and 67 of Tennessee, P.O. Box 1071, Knoxville, TN 37901-1071; and R.K. to 90 kg N ha21 for upland soils (Univ. of Tennessee, Roberts, Agric. Economics and Rural Sociology Dep., Univ. of
Ten-2000). These ranges allow the producer to select an nessee, P.O. Box 1071, Knoxville, TN 37901-1071. Received 26 Jan.
2000. *Corresponding author ([email protected]).
The experimental design was a randomized complete block
N rate based on knowledge of cropping history and
with five replications. Nitrogen rates of 0, 34, 67, 101, and 134
previous fertilization.
kg N ha21were either broadcast as AN (34% N) or injected
Most of the previous research in the mid-South was
as urea–ammonium nitrate (UAN, 32% N) immediately after
conducted using CT production with soil N
incorpora-planting. These two N sources were selected because of the
tion immediately after application. Current information ease and accuracy of injecting liquids relative to dry fertilizers on N fertilization rates and application methods for NT and the potential problems associated with broadcasting UAN cotton production on highly erodible loess-derived soils for NT production (Howard and Essington, 1998). The N rate is limited. Conservation tillage systems such as NT with range was selected to encompass current N rates
recom-winter cover crop are recommended for erosion control mended for cotton production in Tennessee (Univ. of Tennes-see, 2000). Treatments were applied to the same plots each
on a large portion of western Tennessee cotton land
year.
area (Shelby and Bradley, 1996). When cropped, these
Broadcast AN treatments were hand-applied, while the
in-loess-derived soils historically have had high soil erosion
jected treatments were applied using a four-row applicator.
rates (Langdale et al., 1985) reducing productivity,
espe-Urea–ammonium nitrate was injected 5 cm deep and 10 cm
cially if root-restrictive fragipans were present (Flowers
to the side of the row and metered through a straight stream
et al., 1964). Fertilizers are generally surface-applied metering orifice attached to a knife configured behind a rolling when CT systems are used. Surface broadcasting urea- coulter. The N rates were applied using a CO
2 pressurized
containing fertilizers may result in N losses from im- system. Injected N rates were established by varying applica-mobilization and volatilization (Reeves et al., 1993). tion speed and/or orifice size. Additional treatments included
Howard and Essington (1998) reported that N immobili- broadcasting AN at 67 kg N ha21at planting followed by
side-dressing either 34 or 67 kg N ha216 wk after planting (split
zation by microorganisms in organic residues reduced
application). Before planting, P was broadcast at 15 kg ha21
NT corn yields as much as 9%. They also reported that
using triple superphosphate while K was broadcast at 56 kg
the combination of immobilization and volatilization N
ha21using potassium chloride.
losses reduced NT corn yields as much as 36% from
The cultivar D&PL 50 was planted from 1994 through 1996,
surface-applied urea.
and D&PL 5409 was used in 1997. Experiments were planted
Surface-applied N losses by either immobilization or between early- and mid-May at all locations at approximately volatilization from urea may reduce yields (Howard and 190 000 seed ha21. Individual plots were four rows wide with Essington, 1998). Injecting N below the soil surface re- a 0.97-m row spacing on Lexington soil and a 1.02-m row stricts both N volatilization and immobilization since spacing on Loring and Memphis soils. Plot lengths were 9.1 m
these two loss mechanisms are primarily associated with at each location. Before planting, winter vegetation (wheat or
native) was killed with paraquat (1,19-dimethyl-4.49
-bipyridin-surface applications. However, N injection is a more
ium ion) applied at 712 g a.i. ha21containing 0.5% (v/v)
non-expensive application method (Roberts et al., 1995) than
ionic surfactant. Residual weed control included broadcasting
surface broadcasting and should be used when either
pendi methalin {N-(1-ethylpropyl)-3,4-d i
methyl-2,6-dini-volatilization or immobilization losses are sufficient to
trobenzenamine} at 930 g a.i. ha21 plus fluometuron {N,N
-reduce N yields. dimethyl-N
9-[trigluoromethyl-phenyl]urea} at 1121 g a.i. ha21.
The objective of this research was to evaluate the Additional recommended production practices (insecticides, effect of broadcast, injected, and split-applied N rates defoliants, etc.) were used at each location (Shelby, 1996). on yields and earliness of NT cotton produced on loess- A recommended defoliant was applied when 60% of the
derived soils. bolls were open. Lint yields were determined by mechanically
picking the two center rows of each plot twice. Cotton was picked approximately 2 wk after leaf drop with a second
pick-MATERIALS AND METHODS
ing approximately 3 wk later. This interval varied due to
A 4-yr study was conducted from 1994 through 1997 on a weather and scheduling at each location. Percent lint was
determined by combining seed cotton subsamples of individ-Loring silt loam at the Milan Experiment Station, Milan, TN.
Two-year studies were conducted from 1996 through 1997 on ual treatments across replications and ginning on a 20-saw
gin with dual lint cleaners. Lint yields were calculated by a Memphis silt loam at Ames Plantation, Grand Junction,
TN, and on a Lexington silt loam at the West Tennessee multiplying the lint fraction by seed cotton weights. Total lint
yields were calculated by adding the first- and second-harvest Experiment Station, Jackson, TN. A composite soil sample
was collected to a 15-cm depth from each of the replicated lint yields for each treatment. The treatment effect on earliness
of maturity was evaluated as the percentage of total yield blocks in 1997 to evaluate Mehlich-I extractable P and K and
organic C. For the Loring, Memphis, and Lexington silt loams, picked at first harvest (Richmond and Ray, 1966).
Statistical analyses of lint yields and maturity (earliness)
Mehlich-I extractable P and K levels were 69 and 227 kg ha21,
75 and 138 kg ha21, and 222 and 356 kg ha21, respectively. were performed utilizing mixed model SAS procedures (SAS
Inst., 1997). The mixed model procedure provides Type IIIF
Total C determined with a CR-12 C Analyzer (Leco Corp.,
St. Joseph, MO) for the three soils was 11.2, 11.2, and 11.6 g statistical values but does not provide mean square values for
each element within the analyses or the error terms for mean
kg21, respectively.
Surface residues on the three soils were derived from volun- separation. Therefore, mean separation was evaluated through
a series of protected pair-wise contrasts among all treatments teer native winter annuals on the Loring soil, winter wheat
on the Lexington soil, and corn stover on the Memphis soil. (Saxton, 1998). A probability level of 0.05 was used for mean
separation of planned comparisons. These analyses include The previous crop on the Loring and Lexington soils was
NT cotton, while corn was the previous crop produced on treatment effects on both N rates and application methods on
yields. Because separation of placement effects on yields was the Memphis soil. Winter wheat was fall-seeded each year
following cotton harvest on the Lexington soil. Corn stover difficult for certain years, broadcast and injected yield
Table 1. ANOVA using mixed modelFstatistical values for
eval-for each location and were tested eval-for significant differences
uating N treatments (rates and application methods) on lint
usingF-test (Chow tests) (Kennedy, 1992, p. 108–109). The
yields, and maturity of no-till cotton produced on three soils.†
Chow Test is anF-test withT11T222Kdegrees of freedom
and it takes the form: Lint yields† Maturity‡
Source df F P.F F P.F
F5{[SSE (constrained)2SSE (unconstrained)]/K}
Loring silt loam
[SSE(unconstrained)/(T11T222K)]
Year 3 94.3 0.0001 23.1 0.0001
whereT1andT2are the number of observations in each of Errora 12
Nitrogen (N) 10 44.7 0.0001 6.5 0.0001
the regressions we are comparing and K is the number of
Year3N 30 3.7 0.0001 1.6 0.0411
variables in each regression including the intercept; SSE
(un-Errorb 160
constrained) is the sum of the SSEs when the two regressions
Memphis silt loam
are performed separately; and SSE (constrained) is the SSE
Year 1 15.4 0.0172 3.3 0.143
from performing one regression using all the data from both
Errora 4
regressions. The latter regression using all the data essentially Nitrogen (N) 10 17.3 0.0001 2.4 0.009
constrains the parameters for both situations to be equal. Year3N 10 0.8 0.623 1.3 0.225
Errorb 79
Lexington silt loam
RESULTS
Year 1 78.6 0.0009 46.0 0.002Errora 4
Experiment duration for the three locations varied Nitrogen (N) 10 20.2 0.0001 2.5 0.0105
Year3N 10 6.6 0.0001 1.5 0.057
between 2 and 4 yr with each location having different
Errorb 76
winter cover crops. The yield data as affected by N
† Four years of research conducted on Loring silt loam, 2 yr conducted
treatment will be presented by location and winter
on both Lexington and Memphis silt loams.
cover. Reference to N treatment is inclusive of the 11 ‡ Maturity
5percent of total yield picked at first harvest.
treatments (N rates and application methods); other-wise, specific treatment effects will be identified and
pre-AN application resulted in similar yields as injected sented.
UAN and broadcasted AN.
Broadcasting AN up to 67 kg N ha21 increased the
Loring Silt Loam (Winter Annuals)
1996 yields. Except for injecting UAN at 67 kg N ha21, the 1996 yield responses mirrored the 1994 response. A The N treatment (rate-placement) effects on lintyields of cotton produced on Loring silt loam were higher N rate was required to maximize the 1997 yields, which were increased with broadcast AN rates up to highly significant (P, 0.0001) but inconsistent across
the 4 yr, as indicated by a year3N treatment interaction 101 kg N ha21. Injecting 67 kg N ha21as UAN resulted in higher yields than with broadcasting AN at 67 kg (Table 1).
Pair-wise contrasted comparisons show that the 1994 N ha21.
Cotton yield response functions estimated for broad-yields were increased from 962 kg ha21for no N to 1630
kg ha21 by broadcasting 67 kg N ha21 as AN (Table casting and injecting the two N sources are presented in Table 3. The F-tests (Chow test) indicate that the 2). Yields were not increased by applying higher rates
regardless of application method. The pair-wise compar- yield response coefficients for the broadcasting AN and injecting UAN functions were similar in 1994, 1996, and isons show that broadcasting AN or injecting UAN
re-sulted in comparable yields for each applied N rate. The 1997. In 1995, broadcasting AN resulted in higher yields than injecting UAN. For the annual response functions, 1995 lint yields were also increased by broadcasting 67
kg N ha21 as AN but yields decreased with increased the yield increase with increased N rate (slope) was higher for broadcasting AN in 1995 relative to injecting N rates of 101 and 134 kg N ha21. Injecting either 34
or 67 kg N ha21as UAN lowered yields compared with UAN, but these differences were not significant in other years.
broadcasting equivalent amounts of AN. Splitting the
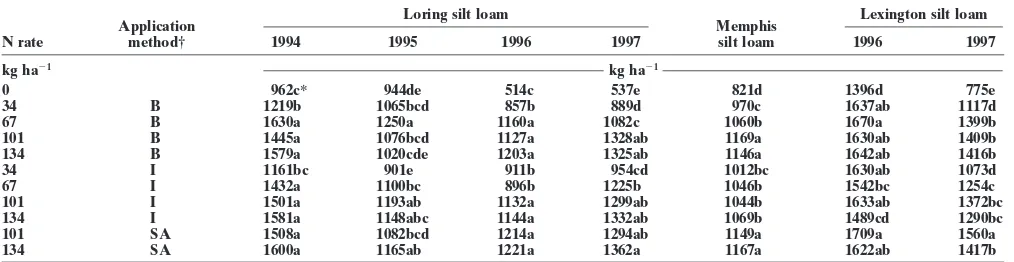
Table 2. Effect of N rate and application method on NT cotton yields on three loess-derived soils.
Loring silt loam Lexington silt loam
Application Memphis
N rate method† 1994 1995 1996 1997 silt loam 1996 1997
kg ha21 kg ha21
0 962c* 944de 514c 537e 821d 1396d 775e
34 B 1219b 1065bcd 857b 889d 970c 1637ab 1117d
67 B 1630a 1250a 1160a 1082c 1060b 1670a 1399b
101 B 1445a 1076bcd 1127a 1328ab 1169a 1630ab 1409b
134 B 1579a 1020cde 1203a 1325ab 1146a 1642ab 1416b
34 I 1161bc 901e 911b 954cd 1012bc 1630ab 1073d
67 I 1432a 1100bc 896b 1225b 1046b 1542bc 1254c
101 I 1501a 1193ab 1132a 1299ab 1044b 1633ab 1372bc
134 I 1581a 1148abc 1144a 1332ab 1069b 1489cd 1290bc
101 SA 1508a 1082bcd 1214a 1294ab 1149a 1709a 1560a
134 SA 1600a 1165ab 1221a 1362a 1167a 1622ab 1417b
* Within a yield column, means followed by the same letter are not significantly different ata50.05.
Table 3. Regressed yield functions for broadcasting AN and injecting UAN for NT cotton produced on three loess-derived soils and
F-tests to detect differences between the application methods.
Chow test
Year AM Regressed equation R2 F P
.F
Loring silt loam
Broadcast Y5954.16111.53N20.054N2 0.64
1994 0.69 0.563
Injection Y5948.5618.42N20.028N2 0.77
Broadcast Y5936.2616.58N20.045N2 0.34
1995 2.98 0.041
Injection Y5894.7713.20N20.008N2 0.45
Broadcast Y5517.81112.31N20.055N2 0.82
1996 1.55 0.215
Injection Y5548.1218.84N20.033N2 0.83
Broadcast Y5534.05111.58N20.041N2 0.89
1997 1.17 0.331
Injection Y5543.04113.99N20.061N2 0.92
Memphis silt loam
Broadcast Y5817.0415.25N20.02N2 0.54
1996–1997 2.37 0.075
Injection Y5839.1614.76N20.024N2 0.33
Lexington silt loam
Broadcast Y51421.3416.00N20.034N2 0.45
1996 1.62 0.199
Injection Y51417.0115.50N20.037N2 0.32
Broadcast Y5787.59112.272N20.057N2 0.85
1997 1.98 0.133
Injection Y5781.12110.7N20.051N2 0.75
Memphis Silt Loam (Corn Stover Cover)
Coefficients of the two yield response functions for either broadcasting AN or injecting UAN were not dif-Fertilizer N treatment effects on cotton yields wereferent for either 1996 and 1997 (Table 3). Once again, consistent across the 2 yr since the year3N interaction
yield increases with increased N rate for these two yield was not significant (Table 1). Thus, the lint yield data
functions (slope) were similar for broadcasting AN com-will be presented as 2-yr means.
pared with injecting UAN. Pair-wise contrasts show that 2-yr average lint yields
were increased by broadcasting AN up to 101 kg N ha21
(Table 2). However, yields were reduced by injecting
Effect of Application Methods on Earliness
UAN at either 67 or 134 kg N ha21 compared with
of Maturity
broadcasting AN. Splitting the AN application resulted
The N treatments had a highly significant effect on in yields similar to broadcasting 101 kg N ha21as AN.
earliness of cotton produced on the three soils (Table The coefficients of yield response functions for
broad-1). The effect of these treatments on earliness was con-casting AN and injecting UAN were not different (Table
sistent across years for the Memphis and Lexington soils 3). Again, the regressed equation slopes show that the
but not the Loring soil as indicated by the year 3 N yield increase with increased N rate was similar for
treatment interaction. broadcasting AN as for injecting UAN.
In 1994, earliness of cotton produced on the Loring silt loam was reduced by injecting UAN at 101 kg N
Lexington Silt Loam (Small Grain Cover)
ha21 compared with broadcasting AN but was similar at other rates (Table 4). Earliness was not affected by The N treatments had a significant effect (P,0.0001)increased N rate. In 1995, injecting UAN at 67 kg N on lint yields of NT cotton produced on the Lexington
ha21reduced earliness compared with broadcasting AN, silt loam (Table 1). As was observed for cotton produced
while the reverse was observed when AN was broadcast on the Loring silt loam, treatment effects were
inconsis-at 134 kg N ha21. Earliness was reduced by applying tent over the 2 site-years as showed by the year3 N
the higher N rates regardless of application method. treatment interaction.
Injecting UAN reduced earliness in 1996 at all applica-The 1996 pair-wise contrasts show yields produced
tion rates compared with broadcasting AN. Again, earli-on this soil were increased by either broadcasting AN
ness was reduced by applying the higher N rates regard-or injecting UAN at 34 kg N ha21, but higher rates did
less of application method. Differences in earliness due not significantly increase yields. Injecting 134 kg N ha21
to N application method were not observed in 1997. as UAN reduced yields relative to broadcasting or split
Earliness of cotton produced on the Memphis silt applying AN at 134 kg N ha21. In 1997, split applying
loam was reduced from injecting UAN at either 34 or 101 kg N ha21as AN resulted in higher lint yields
com-101 kg N ha21compared with broadcasting AN. Increas-pared with broadcasting AN or injecting UAN at
plant-ing the N rate did not reduce first-harvest yields or ing. Broadcasting AN at 67 kg N ha21resulted in higher
Table 4. Effect of N treatments on NT cotton earliness for three loess-derived soils, expressed as the percent of total yield picked at first harvest.
Loring silt loam
Application Memphis Lexington
N rate method 1994 1995 1996 1997 silt loam silt loam
kg ha21 %
0 81.2a* 86.1a 81.8c 87.8ab 79.3bcd 69.4d
34 Broadcast 84.7a 85.5a 88.3a 91.1a 82.8a 77.8a
67 Broadcast 85.8a 85.8a 87.8ab 88.6ab 79.2bcd 75.2a-d
101 Broadcast 85.8a 80.2bcd 85.1abc 89.1ab 81.2ab 78.9a
134 Broadcast 83.9a 79.7cd 82.4c 87.6ab 80.5abc 81.4a
34 Inject 78.2ab 85.7a 84.1bc 89.3ab 78.1bcd 77.5abc
67 Inject 82.4a 81.6bcd 83.6c 88.1ab 78.6bcd 71.1bcd
101 Inject 74.4b 81.3bcd 73.0e 85.5ab 77.4cd 77.4abc
134 Inject 82.9a 83.2abc 77.2d 84.1b 76.6cd 70.7cd
101 Split 82.8a 83.5ab 85.2ab 90.1a 80.6abc 79.5a
134 Split 80.3ab 78.6d 82.6c 87.7ab 80.3abc 77.6ab
* Within a yield column, means followed by the same letter are not significantly different ata50.05.
at 134 kg N ha21reduced earliness compared with broad- ing AN were greater than for injecting UAN in 5 of the 8 site-years.
casting AN but was similar at other N rates. Averaged across the 8 site-years of this study, injecting UAN
re-duced cotton earliness from 82.7 to 79.0% first-harvest
DISCUSSION
relative to broadcasting.
Broadcasting N was a satisfactory application method The pair-wise contrasts indicate earliness differences
for NT cotton production in this study. Surface residues, due to the two application methods (broadcasting AN
normally associated with NT production, did not reduce and injecting UAN). Regressed yield equations were
yields as observed in other cotton research (Hutchinson developed and compared to evaluate first-harvest
differ-et al., 1995; Thompson and Varco, 1996) or as observed ences between broadcasting AN and injecting UAN
with NT corn (Howard and Essington, 1998). Yields on (Table 5). Evaluation of the two yield response
func-the Loring soil having func-the native winter weed vegetation tions for cotton produced on the Loring silt loam
indi-were maximized by broadcasting 67 kg N ha21. Injecting cates coefficient differences in 1995 and 1996 with no
N as UAN did not increase yields, suggesting that possi-differences in 1994 and 1997. These possi-differences were
ble N immobilization by surface residue was insufficient not observed for total yields, except for 1995 (Table 3).
to reduce yields. This observation differs with the find-Response coefficient differences between broadcasting
ings of Thompson and Varco (1996). They reported the AN and injecting UAN were also observed for cotton
need to broadcast a higher N rate compared with the produced on the Memphis silt loam and the 1996 yields
injected N rate for NT cotton production in Mississippi. produced on the Lexington silt loam (Table 5). For the
three locations, the regressed coefficients for broadcast- In this study, a higher N rate (101 kg N ha21) was needed
Table 5. Regressed functions for broadcasting AN and injecting UAN on first harvest yields of NT cotton produced on three loess-derived soils andF-tests to detect differences between application methods.
Chow test Application
Year method Regressed equation R2 F P.F
Loring silt loam
Broadcast Y5774.35111.08N20.054N2 0.71
1994 2.74 0.054
Injection Y5775.1715.51N20.013N2 0.60
Broadcast Y5808.3715.54N20.042N2 0.39
1995 4.76 0.006
Injection Y5778.6811.61N20.001N2 0.36
Broadcast Y5426.36111.97N20.06N2 0.83
1996 5.42 0.003
Injection Y5461.4517.13N20.031N2 0.69
Broadcast Y5472.73110.70N20.041N2 0.89
1997 0.720 0.545
Injection Y5480.58112.62N20.059N2 0.83
Memphis silt loam
Broadcast Y5655.5414.36N20.017N2 0.53
1996–1997 4.53 0.005
Injection Y5662.7313.61N20.019N2 0.28
Lexington silt loam
Broadcast Y51057.1612.11N20.006N2 0.34
1996 3.39 0.026
Injection NS
Broadcast Y5528.37113.49N20.063N2 0.74
1997 1.91 0.144
for NT cotton produced on the Memphis silt loam hav- a total of 27 DD60s were accumulated between first and second harvest periods. In 1997, only one DD60 was ing the corn stover cover, but yields were not improved
accumulated between first and second harvest periods. by injecting N. Yields produced on the Lexington silt
Heat-unit accumulation for the three soils was similar, loam having a winter wheat cover were reduced by
and data for the remaining two are not reported. Lim-injecting UAN 67 kg N ha21compared with
broadcast-ited heat-unit accumulation in this region indicates the ing AN at 67 kg N ha21. This observation differs with
need to identify treatments that are conducive to earli-the findings of Hutchinson et al. (1995). They reported
ness. However, treatments that delay cotton maturity the need for an extra 37 kg N ha21to cotton produced
and promote higher second-harvest yields may be desir-on soils having a wheat winter cover. Previous research
able for producers in areas having a greater heat-unit showed reduced NT corn yields from broadcasting AN
accumulation potential after first harvest. compared with injecting UAN on a soil that had been
in NT production 12 to 15 yr (Howard and Essington, 1998). However, they reported no yield reduction from
CONCLUSIONS
broadcasting AN on a soil that had been in NT for 2Broadcasting N as AN was a satisfactory application to 5 yr. Several factors were speculated to explain the
method for NT cotton production on three loess-derived difference. One speculation was that the higher organic
soils having different winter covers. Lint yields were matter (resulting from long-term NT production using
maximized by applying 67 kg N ha21on the Loring and winter wheat as cover) was immobilizing sufficient N
Lexington silt loams but 101 kg N ha21was required to to reduce yields. These data indicate that injecting UAN
maximize yields on the Memphis silt loam. Lint yields for NT cotton production on these soils is questionable
were greater in 1 of 8 site-years from broadcasting AN based on the expenses of the application method
(Rob-compared with injecting UAN. Split N applications of erts et al., 1995).
AN resulted in higher yields in only 1 of 8 site-years Split N applications increased yields only 1 of the 8
relative to broadcasting AN at planting. The extra time site-years. Unfortunately, the split N rates (101 and 134
and expense of the split N applications or injecting N kg N ha21) may have been too high for this research.
do not justify the added time and expense for cotton Because of the limited frequency of yield response (1 yr
production on these soils. Crop earliness (maturity) was in 8) in this research, split N application for cotton
improved from 79.0 to 82.7% first-harvest on average, production is questionable due to the expense involved
across the 8 site-years by broadcasting N compared with with the extra trip over the field and equipment costs.
injection. This may improve the likelihood that cotton Injecting N delayed crop maturity in some site-years
can be harvested before a killing frost along the northern compared with broadcasting AN. Several factors can be
edge of the U.S. Cotton Belt. speculated for this delayed crop maturity. One factor
may be the difference in N sources (UAN and AN)
ACKNOWLEDGMENTS and application method (injected vs. broadcast). The
injected UAN source contains 25% NH4–N and 50% The authors acknowledge the cooperation of the Ames NH2–N, whereas AN contains 50% NH4–N. The conver- Plantation staff under terms of a perpetual trust to the
Univer-sion of urea-N to NO3–N may require more time than sity of Tennessee by Julia C. Ames. We also acknowledge the staff members located at the Milan Experiment Station, Milan,
the conversion of AN–N to NO3–N. An additional factor
TN, and the West Tennessee Experiment Station, Jackson,
that may affect earliness is possibly greater N
concentra-TN, for their cooperation and efforts in this research.
tion resulting from the injection application method (Howard and Essington, 1998). Surface broadcasting N
REFERENCES
over the soil increases the probability of N
immobiliza-tion by microbial activity reducing N concentraimmobiliza-tion, at Boquet, D.J., E.B. Moser, and G.A. Breitenbeck. 1994. Boll weight and within-plant yield distribution in field-grown cotton given dif-least temporarily. Injecting UAN reduces N
immobiliza-ferent levels of nitrogen. Agron. J. 86:20–26. tion and should provide a higher N concentration within
Ebelhar, M.W., and R.A. Welch. 1996. Cotton response to multiple the restricted application zone. Increased N concentra- split applications of nitrogen. p. 1345–1348.InP. Dugger and D. tion from broadcasting higher N rates has been reported Richter (ed.) 1996 Proc. Beltwide Cotton Conf., Nashville, TN. 9–12 Jan. 1996. National Cotton Council of Am., Memphis, TN. to delay cotton maturity and reduce yields (Boquet et
Ebelhar, M.W., R.A. Welch, and W.R. Meredith, Jr. 1996. Nitrogen al., 1994; Hutchinson et al., 1995; Maples and Keogh,
rates and mepiquat chloride effects on cotton lint yield and quality. 1971; McConnell et al., 1993; McConnell et al., 1995). p. 1373–1378.InP. Dugger and D. Richter (ed.) 1996 Proc. Beltwide Crop maturity is a critical production consideration Cotton Conf., Nashville, TN. 9–12 Jan. 1996. National Cotton
Coun-cil of Am., Memphis, TN. for cotton producers along the northern edge of the
Flowers, R.L., J.A. Phillips, W.C. Mangrumn, R.K. Moore, and L.A. U.S. Cotton Belt (Gwathmey and Howard, 1998).
Prac-Dungan. 1964. Soil survey of Fayette County, Tennessee. USDA-tices that delay maturity often reduce yields because SCS, Washington, DC.
of reduced heat-unit (DD60) accumulation during the Gwathmey, C.O., and D.D. Howard. 1998. Potassium effects on can-opy light interception and earliness of no-tillage cotton. Agron. latter part of the growing season. For instance, crop
J. 90:144–149. maturity of cotton produced on the Lexington silt loam
Howard, D.D., and M.E. Essington. 1998. Effects of surface-applied was reduced both years by injecting the N. The accumu- limestone on the efficiency of urea-containing nitrogen sources for lated DD60s between planting and first harvest were no-till corn. Agron. J. 90:523–528.
cotton: Rate and time of applications on a Loring silt loam soil. Reeves, D.W., C. Mitchell, G. Mullins, and J. Touchton. 1993. Nutrient Tenn. Farm Home Sci. 138:13–16. management for conservation-tillage cotton in the southeast. p. Howard, D.D., and P.E. Hoskinson. 1990. Nitrogen recommendations 23–28.InConservation-tillage systems for cotton. Spec. Rep. 160.
for cotton and how they were developed in Tennessee. p. 47–52. Arkansas Agric. Exp. Stn., Fayetteville, AR.
InW.N. Miley and D.M. Oosterhuis (ed.) Nitrogen nutrition of Richmond, T.R., and L.L. Ray. 1966. Product-quantity measures of cotton: Practical issues. ASA, Madison, WI. earliness of crop maturity in cotton. Crop Sci. 6:235–239. Hutchinson, R.L., G.A. Breitenbeck, R.A. Brown, and W.J. Thomas. Roberts, R.K., D.D. Howard, D.C. Gerloff, and L.A. Johnson. 1995.
1995. Winter cover crop effects on nitrogen fertilization require- Economic analysis of nitrogen sources and placement methods in ments of no-till and conventional-tillage cotton. p. 73–76.InM.R. no-tillage corn. J. Prod. Agric. 8:575–580.
McClelland et al. (ed.) Conservation-tillage systems for cotton: A SAS Institute. 1997. SAS/STAT software: Changes and enhancements review of research and demonstration results from across the Cot- through release 6.12. SAS Inst., Cary, NC.
ton Belt. Arkansas Agric. Exp. Stn., Fayetteville, AR. Saxton, A.M. 1998. A macro for converting mean separation output Kennedy, P. 1992. A guide to econometrics. 3rd ed. The MIT Press, to letter groupings in Proc Mixed. p. 1243–1246.InProc. of the
Cambridge, MA. 23rd Annual SAS Users Group Int. Conf., Nashville, TN. 22–25
Langdale, G.W., H.P. Denton, A.W. White, J.W. Gilliam, and W.W. Mar. 1998. SAS Inst., Cary, NC.
Frye. 1985. Effects of soil erosion on crop productivity of southern Shelby, P.P. 1996. Cotton production in Tennessee. Pub. PB1514. soils. p. 251–271.InR.F. Follett and B.A. Stewart (ed.) Soil erosion Univ. of Tenn. Agric. Ext. Serv., Knoxville, TN.
and crop productivity. ASA, Madison, WI. Shelby, P.P., and J.F. Bradley. 1996. No-till cotton production. p. 8–10. Maples, R., and J.G. Keogh. 1971. Cotton fertilization studies on InCotton production in Tennessee. Pub. PB 1514. Univ. of Tenn.
loessial plains soils of eastern Arkansas. Rep. 194. Arkansas Agric. Agric. Ext. Serv., Knoxville, TN.
Exp. Stn., Fayetteville, AR. Thompson, J.M., and J.J. Varco. 1996. Fertilizer N and legume cover McConnell, J.S., W.H. Baker, D.M. Miller, B.S. Frizzell, and J.J.
crop management effects on no-till cotton production. p. 1395– Varvil. 1993. Nitrogen fertilization of cotton cultivars of differing 1397.InP. Dugger and D. Richter (ed.) 1996 Proc. Beltwide Cotton maturity. Agron. J. 85:1151–1156.
Conf., Nashville, TN. 9–12 Jan. 1996. National Cotton Council of McConnell, J.S., R.E. Glover, E.D. Vories, W.H. Baker, B.S. Frizzell,
Am., Memphis, TN. and F.M. Bourland. 1995. Nitrogen fertilization and plant
develop-University of Tennessee Extension Plant and Soil Science. 2000. Soil ment of cotton as determined by nodes above white flower. J. Plant
fertility and soil testing. p. C-1-3.InPlant and soil science hand-Nutr. 18:1027–1036.
book. Univ. of Tenn. Inst. of Agric., Knoxville, TN. Overton, J.R., and O.H. Long. 1969. Responses of corn and cotton
to fertilizer on Loring and Calloway soils. Tenn. Farm Home Sci. 68:24–28.
Statement of Ethics
American Society of Agronomy
Members of the American Society of Agronomy acknowledge that they are scientifically and professionally involved with the interdependence of natural, social, and technological systems. They are dedicated to the acquisition and dissemination of knowledge that advances the sciences and professions involving plants, soils, and their environment.
In an effort to promote the highest quality of scientific and professional conduct among its members, the American Society of Agronomy endorses the following guiding principles, which represent basic scientific and professional values of our profession.
Members shall:
1. Uphold the highest standards of scientific investigation and professional comportment, and an uncompromising commitment to the advancement of knowledge.
2. Honor the rights and accomplishments of others and properly credit the work and ideas of others.
3. Strive to avoid conflicts of interest.
4. Demonstrate social responsibility in scientific and professional practice, by considering whom their scientific and professional activities benefit, and whom they neglect.
5. Provide honest and impartial advice on subjects about which they are informed and qualified.
6. As mentors of the next generation of scientific and professional leaders, strive to instill these ethical standards in students at all educational levels.