GLOBAL OCEAN MODELING AND RENDERING TECHNIQUES
BASED ON ELLIPSOID RECTANGULAR GRID MAPPING
Wei Ma a, Gang Wan a , Long Wang a, Weijie Li a
a
Information Engineering University, 450002 Zhengzhou, China – [email protected]
KEY WORDS: WGS84, Ellipsoid rectangular mapping, Marine statistical and spectral, Ellipsoid visual LOD, Ocean and land Edge
ABSTRACT:
Summary: In recent years, with the development of the virtual reality technology and data acquisition technology, people increase the demand of GIS visualization. Especially accounting for occupying 70 percent of global area, and as a based environmental visualization, global ocean visualization is particularly important in some applications. This paper studies the global ocean visualization and modeling techniques under the framework of the WGS84 ellipsoid and achieves a method of rapid global ocean photorealistic rendering.
The main research works are as follow:
1. In the height field modeling, with the law of statistical and spectral marine and Phillip wave spectrum, we can produce a single height map which considers the wind farm on the ocean wave magnitude of impact;
2. With ellipsoid rectangular grid mapping relationship, the single height map produced above will be mapped to the ellipsoid repeatedly, and achieve a goal of global ocean height field modeling;
3. With the conversion of screen space coordinate system and the rectangular spatial coordinate system, sampling points can be acquired by the view-dependent ellipsoid;
4. With the introduction of global bathymetric data, and came through the GPU for rapid sampling, so that we can get sampling points related to transparency and depth values to achieve a global ocean and land border processing.
INTRODUCTIONS
As irregular maritime movements and global ocean data complexity, based on Digital Earth technology to build domestic and waves visualization product solutions are not many. Abroad, 2009 Google launched Google Ocean(google, 2009), the implementation of a wide range of sea and seabed topography three-dimensional display, which is a static method of texture; American Skyline company TerraSuite software "Digital Ocean" prototype system based Geographic Data , remote sensing data, various types of marine information based on building an interactive three-dimensional visualization of the earth-body model network information system; open source engine osgearth(Gwaldron, 2008) in its plug-in also provides OceanSurfaceNode node version 2.1.1 nodes previous implementations of the water cycle jitter. Version 2.2 and later adopted as a static texture Google alternate technologies; open source engine proland(Proland, 2010) also provides OceanPulinged, which is based on the three-dimensional plug ork Uinting3D building height field using FFT module three-dimensional dynamic ocean. Domestically, the National Defense Science Professor Wu Lingda team Qushi(Shi Qu, 2007) division in his master's thesis mentioned in GeoFusion digital earth platform to achieve the effect of the global ocean, which also means a dynamic ocean.
According to these methods, you can see that for the global wave visualization, by all means use the Digital Earth technology, this paper, the theory of global wave grid data management and display, the use of ocean waves spectrum add dynamic grid nodes property, the use of a simplified lighting model and texture mapping techniques to add color attribute waves grid nodes, and finally the use of global data on land and sea depth edge for processing.
1. GLOBAL DATA ORGANIZE AND GEOGRAPHIC
COORDINATE CONVERSION
Real-time rendering with spherical ocean closely related, is the reference ellipsoid, which geodesy is defined as: "a certain parameter, positioning and orientation, and is used to represent a region of the Earth geoid ellipsoid 'reference mapping exercise ellipsoid has a very important role: the mathematical surfaces represent the Earth, a large number of measurement reference plane, also the measurement and calculation of the reference plane vigorously paper WGS84(US, 2004)reference ellipsoid with the parameters provided by the geodetic coordinates completion (B , L, H) to the earth space Cartesian coordinates (X, Y, Z) conversion. should be noted that, since this model in building pyramids, geodetic coordinates are used to ensure that the data is the uniqueness of the original coordinates, and coordinate transformation in real-time rendering is done, so what kind of reference to use, does not affect the accuracy of the original data, and can be readily converted reference system, the conversion process is very simple, only need to modify the reference ellipsoid parameters can be related to this paper now use the WGS84 reference ellipsoid, its main parameters are as follows:
Long radius a6378137.0m
Short Radius b 6356752.3142m
First eccentricity e20.006694384999588 Second eccentricity '2 0.006739501819473
e
International Archives of the Photogrammetry, Remote Sensing and Spatial Information Sciences, Volume XL-4/W2, 2013 ISPRS WebMGS 2013 & DMGIS 2013, 11 – 12 November 2013, Xuzhou, Jiangsu, China
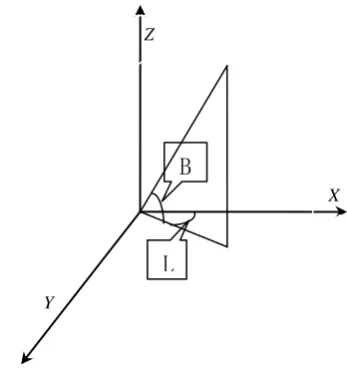
1.1 Conversion to the earth by the space geodetic coordinates Cartesian coordinates
By the geodetic coordinates (B, L, H) conversion to the earth space Cartesian coordinates (X, Y, Z), only need to solve a ternary equation can be.
N e H
B1.2 by the Cartesian coordinates to geodetic space geodetic coordinates
In real-time rendering process, sometimes the earth space Cartesian coordinates (X, Y, Z) Inverse back geodetic coordinates (B, L, H), if you need to display the cursor at the latitude and longitude and elevation. By the spatial coordinates to geographic coordinates, you can get centimeter-level accuracy. space Cartesian coordinate system conversion is relatively simple, in this paper only need to show real-time conversion vertex. Since the original data is stored as an index file records the number of grid points of each layer, the latitude and longitude intervals, tile data is only stored for each vertex elevation values, so compared to the stored coordinates of each vertex relative or absolute coordinates (X, Y, Z), not only saves a lot of storage space but also speed up the tile data scheduling time, the most important thing is you can change the parameters at any time to transform different reference coordinate system. The design of the algorithm for high utilization of the data, CPU vertex coordinate transformation can fully meet the real-time purposes. This article will use the GPU to implement the coordinate transformation, will further improve rendering efficiency and reduce CPU computing overhead. Using the above formula from the spatial Cartesian coordinate system to convert between geodetic coordinate system, high precision and speed.
Figure 1:World coordinate system Cartesian and geodetic coordinates
2. REALISTIC MODELLING OF GLOBAL OCEAN
At present, many algorithms are height field for the plane. The spherical ocean rendering, ultimate goal is to display on the sphere. For the ellipsoid height field under the waves, there are two ways, one is the earth into a curved projection plane, on a plane to establish the entire height field; Another is the use of repeating textures to achieve height map. The former method is currently in the Qu division has been reflected in the papers. The latter use in a wide sea area, within a relatively small area and the resulting wave statistical laws within a relatively large area should be obtained consistent waves statistical laws of the law, in a wide range tessellation. Currently only a wide range of use in the plane, this article will extend it to spherical up. This is the smaller waters waves height map based on statistical regularities (Phillip spectrum) (Tessendof, 2001)embodied in the form, so that the height of the larger figure also applies to the waters, waters in a large tile height map.
2.1 height map generation
Based on statistical and spectral method, the actual wave LxX Ly MXN sampling points, the time t, the sample point x = (nLx / N, mLy = / M) of the wave height h (x, t) determined by the location and time, the FFT represents the formula:
4
Where k = (kx, ky) for the two-dimensional vector with a length
of k, kx = 2πn/Lx, ky = 2πn/Ly; n and m are integers,-N / 2 <n
<N / 2,-M / 2 <m <M / 2.
o n k, fo ,
determines the surface condition of the waves. Because there is a certain regularity waves can be used to describe the wave spectrum. Therefore, the wave amplitude spectral function can be expressed as:
5
Consider the influence of wind, wave spectral representation available Philips
International Archives of the Photogrammetry, Remote Sensing and Spatial Information Sciences, Volume XL-4/W2, 2013 ISPRS WebMGS 2013 & DMGIS 2013, 11 – 12 November 2013, Xuzhou, Jiangsu, China
Where L = V2 / g; g is the gravitational acceleration; V is the wind speed; w as wind, A is a ons n . W s | k • | perpendicular to the wind to abate the waves.
The initial amplitude Gaussian random numbers used to generate:
7
Which ɛr, ɛi in [0,1] the values are independent Gaussian random numbers. Using a Gaussian distributed random numbers generated sea level fluctuation amplitude value matches the experimental data. Of course you can use other distribution of random numbers, but the resulting amplitude than the effect of Gaussian random number.
With the initial amplitude, ac o ng o s s on on ω
k = g • k 1/2, n b ob n s:
8
Amplitude value obtained according to formula (4), the sampling point is obtained by the FFT wave height h (x, t). This paper uses FFT algorithm based on GPU to generate height
. s , CPU s 0 k , ω k , s y,
the texture is saved; these two GPU texture with time t as an input, the GPU calculated amplitude h (k, t); then based on the GPU (4) for IFFT, to obtain h (x, t), and the preservation of the texture, h (x, t) is the height of the texture map.
Here is a height map texture by using the algorithm:
Figure2:Single height map texture
The figure shows wave conditions using the above algorithm :
Figure 3(a):wind velocity=5m/s Figure 3(b):wind velocity=35m/s
2.2 Positive grid projection and ellipsoid height map map
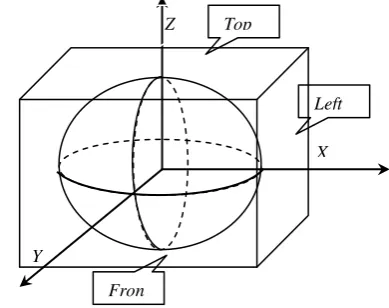
Assuming positive ellipsoid semimajor axis is a, short axis is b. Use 2ax2bx2b cuboid, sphere evenly mapped to the cube, the following figure on the left is positive and the cuboid six flat ellipsoid mapping diagram, turn on the right is the cube map.(Jing Tan, 2002)
Figure 4(a):Global static mesh Figure 4(b):Expand the map
Mathematical description is as follows:
Create an x-axis toward the right, z-axis upward, y-axis outward, the origin at (0,0,0) coordinate system, as shown, the ellipsoid plane is mapped to a box.
Figure 5:Positive ellipsoid, rectangular Cartesian coordinate system and the earth surface Cuboid mathematical expression is as follows:
Cube face Mathematical expressions
Parameters range
Parameters range top
down front back left right
Ellipsoid mathematical description of the last chapter has been talked about.
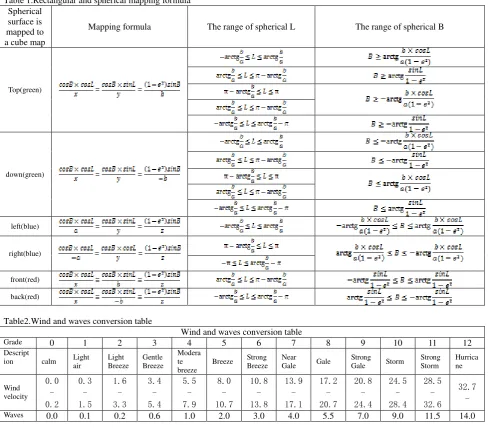
The rectangular surface of six different, the conversion formula is not the same. Therefore, in order to clarify the application of the formula in the formulas given in each transformation, it should be determined while the cube surface of the sphere at all sides of the sphere corresponding to each range. Still sampling WGS84 ellipsoid coordinates benchmarks have been discussed the previous chapter. Their mathematical mapping relationship can be found in schedule 1.
Here, in order to simplify the calculation, this is the Earth as a sphere. Expand the plane and then in six repeated height map texture. Specific steps are as follows:
In top face, for example, sample point t (x, y, R) of the texture coordinates is:
9 10 Where
Texwidth = texture map width
Texheight = texture map height. 2.3 Visual sphere LOD sampling
During the rendering process, in order to conserve resources in every sphere are covered by a grid area of the same size on the screen, the screen display area evenly subdivided into quadrilateral grid, each grid point to the perspective projection to the sphere, will receive the spherical the corresponding continuous multi-resolution grid.(Cui Xie, 2004)
Method, in the perspective of the body to build and gaze direction perpendicular perspective plane, the plane is divided into small grids, etc., and then the view point of connection to the grid, and the sphere intersect, was the first intersection, that is, the visual sphere intersection, the intersection of these visual
Y
X Z
Left
面
Fron
面
Top
面
International Archives of the Photogrammetry, Remote Sensing and Spatial Information Sciences, Volume XL-4/W2, 2013 ISPRS WebMGS 2013 & DMGIS 2013, 11 – 12 November 2013, Xuzhou, Jiangsu, China
grid composed, namely the continuous multi-resolution viewing area grid.
The algorithm demarcation line with observed properties of the human eye, so near the area of the spherical division have higher density, the distant sphere is getting lower and lower, so that a high near spherical geometry true, on a distant sphere automatic smoothing and simplification, therefore, the algorithm is a multi-resolution view associated spherical mesh generation algorithms.
2.3.1 Convert the screen coordinates of point coordinates of points in space
Evenly split the screen into four square grid will be calculated in section 2.2 of the screen area to each grid point perspective projection to the world space, find its intersection with the visual sphere (short distance from the point of view) All visual intersections generate spherical multi-resolution grid.
The projector at any point in the middle of the plane ABCD Ps (s, t, zs) in the world coordinate system becomes a point Pw (x, y, z) is converted to:
Projection matrix
View matrix
Coordinate transformation matrix
11
Here is relation map which world object projects onto the screen:
Figure 6:Projected onto a flat surface
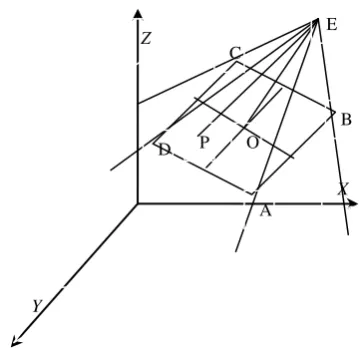
2.3.2 Transition point and the straight line connecting the viewpoint and method for finding the intersection of the spherical
To obtain the number of sampling points the Earth's surface, you need to find the point of view of sampling points and the projection plane connection and the intersection of the Earth's surface, you can first viewpoint and the projection plane sampling points are converted into world coordinates in the world coordinate system, calculated the intersection of straight lines and spherical.
12 13
According to the coordinates of the point E and P of EP linear equation can be obtained:
14 Further line segment intersection and EP ellipsoid S (x, y, z):
15
By equation (15) two coordinate values obtained from the viewpoint closer to the point E is the point S (x, y, z), i.e. number of sampling points earth ocean surface.
Figure 7:Ellipsoid visual projection
3. BASED ON LAND AND SEA BATHYMETRIC DATA
EDGE MATCHING
Edge processing sea has always been the difficulty of realistic spherical waves, is now able to use the global sea Edge data, mainly global coastline (vector data) and the Global 30s of DEM products (including bathymetric data). Using these data, we are able to generate a distinction between onshore and offshore ARTS color or height textures. Through texture manager sampler gives a different sampling points transparency value. In this paper we use 30s global bathymetric data sampling points sampled different transparency value to achieve a sea Edge processing.
3.1 Making global depth height map
Global Mapper tool will use the global bathymetric data reduction processing, because the original data is too large, it is difficult to read for the memory, so the need for the resolution decreases.
Figure 8:30s global bathymetric data
3.2 The use of the GPU for processing sea and land Edge
First, the formula in paragraph 1 to achieve the earth 3 Cartesian coordinate system (x, y, z) to switch to the earth coordinate system (lat, lon).
Then use the GPU texture sampler texture sampling, (lat, lon) is mapped to (U, V), we obtain the value of the point depth. The following formula for the corresponding equation:
16
Finally, the depth of the point value of transparency value of the point:
X Z
A
B E C
D P O
Y
X Z
Y
E P
S
International Archives of the Photogrammetry, Remote Sensing and Spatial Information Sciences, Volume XL-4/W2, 2013 ISPRS WebMGS 2013 & DMGIS 2013, 11 – 12 November 2013, Xuzhou, Jiangsu, China
17 Among them, for underwater volume density of the fog, and generally (0.1,0.3) between, clamp is a clip function, when the first argument in two, whichever value is between three parameters, the first parameter is out of bounds when time, whichever is the nearest boundary value as the value of the function.
Also, if the elevation of the point value greater than 0, the point no longer participate fluctuations, but given an identifier, cutting off the point.
Figure 9(a):Global ocean without land Figure 9(b):Global ocean with land
4. EXPERIMENTS AND CONCLUSIONS
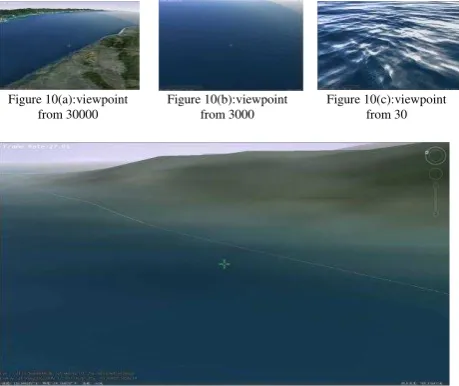
In this paper, experiments were carried out on a computer of the Pentium i7 CPU 2.53GHz, 4GM memory, GTS680 graphics card, Win7 system and Visual C + +2010 environment. The results show that the rendering speed is also associated with the grid resolution, when the grid resolution is small, the frame rate is larger, but not enough fidelity simulation; and when the grid resolution is bigger, better simulate realistic sense, but frame rate will drop, but this time there is noticeable pause and screen flicker. Taken together, a single wave grid size 256 × 256, when the frame rate is 38 ~ 41fps, and the picture quality is more realistic.
Figure 10(a):viewpoint from 30000
Figure 10(b):viewpoint from 3000
Figure 10(c):viewpoint from 30
Figure 11:Ocean and land Edge (viewpoint from 560)
In the design of the waves, the sea level article (considering wind effects) based on international practice is divided into 13, like the table 2 in the appendix.
Below is a screen shot of a different wave level from the same viewpoint:
Figure 12(a):Wave level 5 Figure 12(b):Wave level 9 Figure 12(c):Wave level 13 This paper presents a method to establish the spherical wave model with spherical meshing algorithm spherical sea surface height map for a grid map, and use the latest technology for GPU computing and rendering, improving the efficiency of large-scale ocean scene simulation, achieve the smooth transition from a global scale to local small scale ocean.
Experimental results show that the proposed method effectively, both to meet the needs of the global trend of deduction and visual simulation simulator.
In addition to the marine environment simulation ocean simulation, there are a lot of difficult work. 1. Lack precision global bathymetric data, which is to build the marine environment is a major problem, and is currently scarce and bathymetric data accuracy is not high, the data reference is not uniform; 2. Ocean underwater environment simulation, mainly light simulation, large amount of computation, and difficult to accurately simulate; 3. surface ships, submarines and water dispenser and water body physical reactions (eg ship wave simulation); 4. ocean various field data representation methods, such as ocean current field and the sound field , are primarily scalar field and the vector field of expression.
References
Google Earth. http://earth.google.com/ocean/ ,2009
Gwaldron: osgearth ,http://osgearth.org/ ,2008
Proland . http://proland.inrialpes.fr/ ,2010
US NATIONAL GEOSPATIAL-INTELLIGENCE AGENCY: World Geodetic System 1984 (WGS84).http://earth-info.nga.mil/GandG/wgs84/,2004. Jensen. Deep-Water Animation and Rendering[EB/OL]. http://www.gasutra.eoln/gdee/Jensen/Jensen_1.htm,(2001)
Tessendof. Simulating Ocean Water[EB/OL]. http://home.gte.net/tssndrf/index.html.2001
Jing Tan.Omnidirectional Image Based on IBR.Central South University,2002.
Shi Qu. Ocean Surface Modeling and Rendering on Digital Earth.Changsha: National University of Defense Technology, 2007
Cui Xie.Improved Real-time Ocean Wave Mesh Model .JOURNAL OF SYSTEM SIMULATION.2004
International Archives of the Photogrammetry, Remote Sensing and Spatial Information Sciences, Volume XL-4/W2, 2013 ISPRS WebMGS 2013 & DMGIS 2013, 11 – 12 November 2013, Xuzhou, Jiangsu, China
Appendix
Table 1.Rectangular and spherical mapping formula Spherical
surface is mapped to a cube map
Mapping formula The range of spherical L The range of spherical B
Top(green)
down(green)
left(blue)
right(blue)
front(red) back(red)
Table2.Wind and waves conversion table
Wind and waves conversion table
Grade 0 1 2 3 4 5 6 7 8 9 10 11 12
Descript
ion calm Light
air
Light Breeze
Gentle Breeze
Modera te breeze
Breeze Strong Breeze
Near
Gale Gale
Strong
Gale Storm
Strong Storm
Hurrica ne
Wind velocity
0.0 - 0.2
0.3 - 1.5
1.6 - 3.3
3.4 - 5.4
5.5 - 7.9
8.0 - 10.7
10.8 - 13.8
13.9 - 17.1
17.2 - 20.7
20.8 - 24.4
24.5 - 28.4
28.5 - 32.6
32.7 -
Waves 0.0 0.1 0.2 0.6 1.0 2.0 3.0 4.0 5.5 7.0 9.0 11.5 14.0
International Archives of the Photogrammetry, Remote Sensing and Spatial Information Sciences, Volume XL-4/W2, 2013 ISPRS WebMGS 2013 & DMGIS 2013, 11 – 12 November 2013, Xuzhou, Jiangsu, China