CHARACTERIZING URBAN VOLUMETRY USING LIDAR DATA
T. Santos a, *, A.M. Rodrigues a, J.A. Tenedório a
a
e-GEO - Research Centre for Geography and Regional Planning, Faculdade de Ciências Sociais e Humanas (FCSH), Universidade Nova de Lisboa, Lisboa, Portugal (teresasantos, amrodrigues, ja.tenedorio) @fcsh.unl.pt
Commission VI, WG VI/4
KEY WORDS: Built Volume, Urban indicators, LiDAR, Census data, Density, Land Planning
ABSTRACT:
Urban indicators are efficient tools designed to simplify, quantify and communicate relevant information for land planners. Since urban data has a strong spatial representation, one can use geographical data as the basis for constructing information regarding urban environments. One important source of information about the land status is imagery collected through remote sensing. Afterwards, using digital image processing techniques, thematic detail can be extracted from those images and used to build urban indicators.
Most common metrics are based on area (2D) measurements. These include indicators like impervious area per capita or surface occupied by green areas, having usually as primary source a spectral image obtained through a satellite or airborne camera. More recently, laser scanning data has become available for large-scale applications. Such sensors acquire altimetric information and are used to produce Digital Surface Models (DSM). In this context, LiDAR data available for the city is explored along with demographic information, and a framework to produce volumetric (3D) urban indexes is proposed, and measures like Built Volume per capita, Volumetric Density and Volumetric Homogeneity are computed.
* Corresponding author. This is useful to know for communication with the appropriate person in cases with more than one author. 1. INTRODUCTION
Cities are complex and dynamic systems that constitute a significant challenge to urban planning. Integrating and correlating multiple analysis tools (image analysis, Geographic Information Systems - GIS), data types (satellite images, vector data or statistics) and data sources (Earth Observation, survey or census) is an important step towards increasing the quality of the information content and its acceptance by decision makers (Esch, 2010). Systems based on different urban indicators can be used as tools for cities to communicate different environmental risks, and promote strategies and measures of sustainable urban development and disaster risk management. Monitoring indicators of key processes in land use and economic development is essential for evaluating policy measures. To build such indicators, information about the urban environment is required. Remote sensing is an efficient way of collecting that information. In fact, the constantly increasing availability and accessibility of modern remote sensing technologies has provided new opportunities for urban applications.
The focus of the present work is on assessing the morphology of the built environment, using information acquired from remote sensing devices. For planning purposes, two layers are commonly used – planimetry and altimetry. The planimetry maps the location (2D), while the altimetry maps the altitude of urban structures (3D). For local scales (scales > 1:10 000), the cartographic framework is based on the visual analysis of aerial photographs (Herold, 2003). Due to this mapping approach, the current framework of the Portuguese large scale map production is very time-consuming and expensive (Santos et al., 2011). Consequently, the time lag between availability of updated
maps is generally 10 years. Such gap between map products makes it difficult to efficiently assist municipal land use planning. In this work, we explore the usage of laser altimetry as an alternative source of geospatial information.
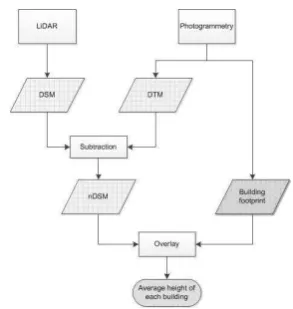
A 2.5D / 3D city model focused on buildings can be compiled, through the use of topographic information (e.g., from the land registry), in combination with laser measurement data (e.g., as obtained from a LiDAR flight), and aerial or satellite images. There are several approaches to interpolate and construct a 2.5D urban surface model (incorporating the relief), based on LiDAR and GIS buildings data (e.g., Carneiro et al., 2008; Santos et al., 2011). Some authors identify buildings based on a normalized Digital Surface Model (nDSM), produced by subtracting the Digital Terrain Model (DTM) from a Digital Surface Model (DSM) (e.g. Ali et al., 2009; Santos et al., 2010). Other authors identify buildings in the DSM using features such as local height differences, curvature, height differences, local homogeneity of surface normals, etc. (e.g., Vögtle et al., 2005; Rottensteiner et al., 2003).
Yu et al. (2010) proposed an automated derivation of urban building density information using LiDAR data and object-based method. Indicators like Building Coverage Ratio, Floor Area Ratio, and other building density indicators are explored, using cadastral information. Carneiro et al. (2010) assessed general morphological properties of the built environment using LiDAR. González-Aguilera et al. (2013) preformed an automated urban analysis on LiDAR-derived building models.
The results presented in this paper are a product of an on-going research about the use of Very-High Resolution (VHR) imagery to expedite the production of geographic information for municipal planning and land monitoring. Santos et al. (2011)
studied land impermeabilization using land cover data extracted from VHR images, in Lisbon, Portugal. The land sealing rate was evaluated through 2D Urban Environmental Indicators, like land sealing area, quantification of green area, or the vacant land available in the city. The present work is a step towards the production of 3D indicators, based on altimetric data obtained with LiDAR technology, and census data. Systems based on 2D and 3D urban indicators can be used to measure the quality of life and the nature of development of the urban environment. These indicators can be used to make policy and planning decisions, to identify whether policy targets are met, and in prospective analysis (Santos et al., 2011).
2. STUDY AREA AND DATA SET
2.1 Study Area
The study area, where geographic information extraction is tested for building urban indicators, is the city of Lisbon, Portugal (Figure 1). Lisbon is the capital city, and the largest city in the country. It is located in the estuary of Tagus River, occupies an area of 85 Km2, and is a typical European capital city, with diverse land use dynamics. Historical neighbourhoods are characterized by a dense road network and most of the area is built-up, while recent neighbourhoods include consolidated urbanization areas along with on-going construction of roads and multi-family buildings. Lisbon is also characterised by a number heterogeneous places, with different land uses that go from built-up, parks, agriculture and vacant land to industrial, utilities, and schools. The western part of Lisbon is occupied by Monsanto Forest Park, the largest recreation area of the city, with 10 km2. In the Eastern part of the city is located the Parque das Nações, a recently renewed area after Expo’98 exhibition. The population is 547,631 (2011) and is concentrated in historical and more recent neighbourhoods.
Figure 1. Study area for deriving Urban Indicators in Lisbon
2.2 Data Set
The spatial database used in this case study included planimetric and altimetric data.
The planimetric information includes two datasets: the buildings' footprint and the census tracts. The buildings' footprint corresponds to the Lisbon’s Municipal Cartography. This map, from the Lisbon City Hall, was produced in a vector format, for the year 1998, and has a scale of 1:1 000. It is a
topographic map that describes the city in large detail through 50 themes, from “Buildings” to “Hydrography”, to “Agriculture” and “Water Infrastructures”, among many others. It is available in digital format.
The census tracts in Portugal are supported by cartography and are available in vector format for the years 1991, 2001 and 2011. The Census reports, at the city block (census tracts) level, population and housing data.
The altimetric data is composed by two sets. One set is derived from a LiDAR (Light Detection And Ranging) point cloud, and the other is derived from cartography. From a flight with a LiDAR camera performed in 2006, a surface image was produced based on the 2nd return, with 1 m resolution. This image represents the Digital Surface Model (DSM) of the area. Another source of altimetric information was a set of elevation mass points and contours, retrieved from 1:1000 scale altimetric cartography of 1998, available at the City Hall.
3. METHODOLOGY
The analysis is implemented for 2006, since the DSM was acquired in a LiDAR flight in that year. The population and buildings’ footprint are not available for that date, and will be assessed in the pre-processing stage. After this step, three outputs are available: buildings’ height, buildings’ footprints and population data for 2006. With these data, modelling the urban surface and characterizing its volumetry can be assessed through spatial indicators, in a GIS environment (Figure 2). .
Figure 2. Flowchart with the methodology to extract volume information, at the building level
3.1 Pre-Processing
The pre-processing stage aims to geometrically correcting the data sets and to derive information for surface characterization. The output of this stage includes the above ground objects’ height and location for 2006, and the population in 2006.
Altimetry
The altimetric data was subjected to several operations in order to generate the final maps describing the terrain and the surface. The LiDAR data set used in this study corresponds to a raster file - the DSM - with ground values included and raised objects above the ground (e.g. trees, buildings, cars, etc). To obtain information on the building’s high; the ground measures have to remove from the DSM. This is accomplished with a bare earth
model, i.e., a Digital Terrain Model (DTM).Through the subtraction of the DSM to the DTM, a normalized DSM (nDSM) allowing the identification of the objects that lie above the terrain, is created.
A Digital Terrain Model (DTM) for the city of Lisbon was produced from the elevation mass points and contours. Firstly, a Triangulated Irregular Network (TIN) was generated and then converted to a grid with 1 m of resolution. This final file corresponds to the DTM for the area.
The DTM was then used to derive the normalized Digital Surface Model (nDSM). The nDSM was obtained by subtracting the DTM from the DSM image. This raster file stores the height of all elements above and below the terrain.
Planimetry
The buildings’ footprint was obtained in the Lisbon’s Municipal Cartography. This map is from 1998, and was updated for 2006, in order to maintain time-compatibility, using a change detection technique (Santos et al., 2011). The final map was topologically validated and only features greater than 5 m2 were considered for further analysis. The total buildings available in the city in 2006 are 62936.
All files were geometrically corrected to attribute a common coordinate system (PT-TM06/ETRS89). The nDSM and the planimetry were well registered after this stage. Nevertheless, some of the higher buildings were misplaced in the footprint layer. This was due to the different acquisition techniques: photogrammetry vs. LiDAR. To overtake this issue, the affected buildings were manually digitized in the “correct” position.
The census tracts in Portugal are available in vector format for the years 2001 and 2011, and is named “Geographic Information Referencing Base”(BGRI). When the BGRI 2011 was produced, drastic geometry changes meant that the National Statistical Institute (INE) was not able to maintain a coding system which would guarantee the existence of minimum common areas as was done in 2001.
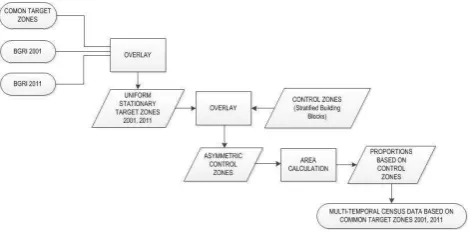
Since the year of analysis is 2006, population will be estimated for that time using the 2001 and 2011 data. For the parish level of analysis, since geometries coincide and assuming constant growth rates, the computation of residents for the target date is straight forward. For the micro-analysis, the block-scale (census tracts) was selected. At this level, the estimation for 2006 is not simple because geometries (census tracts) have changed between 2001 and 2011. Hence a methodology based on dasymmetric mapping developed by Rodrigues et al. (2012a, 2012b) was used. This methodology uses auxiliary geographical data to build coherent historical datasets when asymmetric mapping occurs due to incoherent geometries. This data serves as control zones which are the source of computation of a weighting scheme which allows the re-allocation of data for common spatial units. The control zones used in this study was the Built Volume in 2006. Figure 3 presents the methodology used, which was implemented with geometry spatial functions available in PostgreSQL spatial extension- PostGIS After intersecting the base layers, these stationary target zones were intersected with the control zones, allowing for the creation of asymetric layers. The main advantage is to drop the assumption that population distribution within census tracts is homogeneous. Using volumetric information, it is assumed that the greater the built volume, the greater the concentration of
human activity. The weighting scheme based on volumetric proportions allowed in the end the creation of multi-temporal census micro-datasets.
Figure 3. Flowchart with the asymmetric mapping to estimate Population in 2006
3.2 Modelling City’s Volume
For modelling city’s built volume, information on buildings’ area and height are required. The nDSM provides the height for all objects above ground, while the planimetry indicates the buildings’ location. Booth layers were combined, producing a 3D map with the height of each pixel within a building. To characterize the mean height of each building in the city, the 10º and 90º quartiles were disregarded, and the adjusted mean calculated.
3.3 Assessing Urban Volume through 3D Indicators
Data collected on the built environment from remote sensing sources may have distinct applications. For spatial analysis the 3D map and the census data were explored within a Geographic Information System (GIS).
Different levels of analysis were considered: city, parish, block, and building level.
4. RESULTS AND DISCUSSION
4.1 Modelling the Built Environment
The nDSM, obtained from the DTM and the DSM, had some errors. The height values were not post-processed, meaning that false negative values were present in the dataset. These false values are mainly located in lakes and rail overpasses (locations where the railway crosses over the road). These effects result from the fact that the DTM is not as accurate and detailed as the DSM in such situations. In fact, such circumstances (e.g., bridges, tunnels, overpasses), require further processing in order to correctly model the terrain by introducing break lines that reflect abrupt changes in the terrain and control surface behaviour by acting as a barrier to the interpolation of the TIN model (Pfeifer, 2005). These errors were already expected since they can appear in two situations: 1) when the DSM and the DTM are acquired in different dates or, 2) when the collection method differs (e.g., LiDAR flight or photogrammetric methods). Booth situations are presented in our data set.
4.2 Assessing Urban Indicators
Using the built volume and the demographic data, urban environmental indicators at the city-scale are assessed.
Table 1 depicts for the city-scale, the estimated resident Population in 2006, the Built Volume and the Built Volume per capita.
Population* 2006 (hab)
Built Volume 2006 (m3)
Built volume per capita (m3/hab)
555302 204518967 368,3
Table1. Population, Built Volume and Built Volume per capita for Lisbon city in 2006
When analysing the volume for the parish-scale, indicators on the Volumetric Density and Volumetric Homogeneity can be assessed. The Volumetric Density is calculated using the built volume aggregated by parish area, while the Volumetric Heterogeneity uses the standard deviation of built volume per parish. From this analysis, the parishes with higher and lower Volumetric Density can be identified (Figure 4). Using the Volumetric Heterogeneity, parishes can be classified regarding the uniformity of the built environment.
Figure 4. Volumetric Density (m3/ha) in Lisbon city, calculated at the parish-level
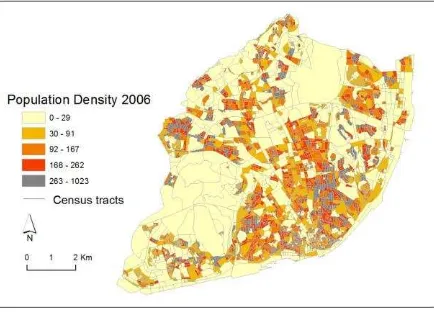
At the block-level, the Population Density for 2006 was estimated based on dasymmetric mapping (Figure 5), while the Volumetric Density was calculated, through the aggregation of the built volume for the block area (Figure 6). From figures 5 and 6, we can observe that the built volume is higher along the riverside and in the city’s central axis. This radial distribution follows the city’s commercial/services expansion. On the other hand, the population is more disperse. The places with less urban pressure are the city’s Forest Park and the Airport.
Figure 5. Population Density in 2006 (hab\ha) in Lisbon city, estimated at the block-level
Figure 6. Volumetric Density (m3/ha) in Lisbon city, calculated at the block-level
General morphological indicators for the building-scale, include the Mean Height, Volume, and Number of Floors. The latter is estimated, considering an average-high of 3m by floor. From this analysis we conclude that the that the buildings with higher volume in Lisbon City are two soccer stadiums and the Lisbon’s International Airport, while the highest buildings are two hotels and two residence buildings. Figure 7 shows one of the stadiums.
Figure 7. Soccer stadium in Lisbon city.
5. CONCLUSIONS
A 3D city model focused on buildings can be compiled, through the use of topographic information (e.g., from the land registry), in combination with laser measurement data (e.g., as obtained from a LiDAR flight), and aerial or satellite images. In this work, all three data sources were combined in order to characterize the built urban environment in Lisbon city. While 2D indicators are common measures for evaluating the territory, 3D indicators are a novel field of work, now supported by the availability of remote sensing systems like LiDAR that provide a feasible and efficient way of collecting surface information for large areas, with high spatial detail.
The next stage will focus on a detailed analysis at the neighborhood-scale, comparing sites subjected to land planning and unplanned ones is already planned.
6. REFERENCES
Ali, S.S., Dare, P.M., Jones, S.D. 2009. A Comparison of Pixel- and Object-Level Data Fusion Using Lidar and High-Resolution Imagery for Enhanced Classification. In S. Jones, and K. Reinke (Eds.), Innovations in Remote Sensing and Photogrammetry, Springer-Verlag Berlin Heidelberg.
Carneiro, C., Morello, E., Ratti, C., Golay, F. 2008. Solar Radiation over the Urban Texture: Lidar Data and Image Processing Techniques for Environmental Analysis at City Scale. In: 3D Geoinfo Conference, Seoul, Corea.
Carneiro, C., Morello, E., Voegtle, T, Golay, F. 2010. Digital Urban Morphometrics: Automatic Extraction and Assessment of Morphological Properties of Buildings. Transactions in GIS, 14, 4, pp. 497-531.
Esch, T. 2010. Urban Remote Sensing – How Can Earth Observation Support the Sustainable Development of Urban Environments?. In: REAL CORP 2010 Cities for Everyone. Liveable, Healthy, Prosperous, Vienna, Austria.
González-Aguilera, D., Crespo-Matellán, E., Hernández-López, D., Rodríguez-Gonzálvez, H. 2013. Automated Urban Analysis Based on LiDAR-Derived Building Models. IEEE Transactions on Geoscience and Remote Sensing, 51, 3, pp. 1844-1851
Herold, M., Liu, X.H., Clarke, K.C. 2003. Spatial Metrics and Image Texture for Mapping Urban Land Use. Photogrammetric Engineering & Remote Sensing, 69(9), pp. 991–1001.
Pfeifer, N. 2005. A subdivision algorithm for smooth 3D terrain models. Journal of Photogrammetry and Remote Sensing, 59, pp. 115– 127.
Rodrigues, A.M., Santos, T., Deus, R.F., Pimentel, D. 2012b. Land-use Dynamics At the Micro Level: Constructing and Analyzing Historical Datasets for the Portuguese Census Tracts. B. Murgante et al. (Eds.): ICCSA 2012, Part II, LNCS 7334, pp. 565-577. Springer, Heidelberg.
Rodrigues, A.M., Santos, T., Pimentel, D. 2012a. Assymetrical-mapping based methodology: Constructing historical datasets for Portuguese census tracts. In: The 15th AGILE International Conference on Geographic Information Science, Avignon, France.
Rottensteiner, F., Trinder, J., Clode, S., Kubik, K. 2005. Automated delineation of roof planes from LIDAR data. In: The International Archives of Photogrammetry and Remote Sensing, Enschede, the Netherlands, Vol. XXXVI, Part 3, pp. 221-226.
Santos, T., Freire, S., Fonseca, A., Tenedório, J. A. 2011. Producing a building change map for urban management purposes. EARSeL eProceedings, 10(1), pp. 56-65.
Santos, T., Freire, S., Navarro, A., Soares, F., Dinis, J., Afonso, N., Fonseca, A. e Tenedório, J. A. 2010. Extracting buildings in the city of Lisbon using QuickBird images and LIDAR data. In: GEOBIA - GEOgraphic Object-Based Image Analysis, Ghent, Belgium.
Vögtle, T., Steinle, E., Tóvári, D. 2005. Airborne Laserscanning Data for determination of suitable areas for photovoltaics. In: The International Archives of Photogrammetry and Remote Sensing, Enschede, the Netherlands, Vol. XXXVI, Part 3, pp. 215-220.
Yu, B., Liu, H., Wu, J., Hu, Y., Zhang, L. 2010. Automated derivation of urban building density information using airborne LiDAR data and object-based method. Landscape and Urban Planning, 98, pp. 210–219
7. ACKNOWLEDGEMENTS
The authors would like to thank Logica for the opportunity of using the LiDAR data set.
This paper presents research results of the Strategic Project of e-GEO (PEst-OE/SADG/UIo161/2011) Research Centre for Geography and Regional Planning funded by the Portuguese State Budget through the Fundação para a Ciência e Tecnologia.
The work presented in this communication was funded by the Fundação para a Ciência e Tecnologia (Grant SFRH/BPD/76893/2011).