DATA MINING AND KNOWLEDGE DISCOVERY TOOLS FOR EXPLOITING BIG
EARTH OBSERVATION DATA
D. Espinoza Molinaa,∗, M. Datcua
a
German Aerospace Center (DLR), Earth Observation Center, Remote Sensing Institute, Oberpfaffenhofen, 82234 Weßling, Germany – [email protected] –[email protected]
THEME:Data and information systems and spatial data infrastructure
KEY WORDS:Systems to manage Earth-Observation images, data mining, knowledge discovery, query engines
ABSTRACT:
The continuous increase in the size of the archives and in the variety and complexity of Earth-Observation (EO) sensors require new methodologies and tools that allow the end-user to access a large image repository, to extract and to infer knowledge about the patterns hidden in the images, to retrieve dynamically a collection of relevant images, and to support the creation of emerging applications (e.g.: change detection, global monitoring, disaster and risk management, image time series, etc.). In this context, we are concerned with providing a platform for data mining and knowledge discovery content from EO archives. The platform’s goal is to implement a communication channel between Payload Ground Segments and the end-user who receives the content of the data coded in an understandable format associated with semantics that is ready for immediate exploitation. It will provide the user with automated tools to explore and understand the content of highly complex images archives. The challenge lies in the extraction of meaningful information and understanding observations of large extended areas, over long periods of time, with a broad variety of EO imaging sensors in synergy with other related measurements and data. The platform is composed of several components such as 1.) ingestion of EO images and related data providing basic features for image analysis, 2.) query engine based on metadata, semantics and image content, 3.) data mining and knowledge discovery tools for supporting the interpretation and understanding of image content, 4.) semantic definition of the image content via machine learning methods. All these components are integrated and supported by a relational database management system, ensuring the integrity and consistency of Terabytes of Earth Observation data.
INTRODUCTION
In recent years the ability to store large quantities of Earth Obser-vation (EO) satellite images has greatly surpassed the ability to access and meaningfully extract information from it. The state-of-the-art of operational systems for Remote Sensing data access (in particular for images) allows queries by geographical loca-tion, time of acquisition or type of sensor. Nevertheless, this in-formation is often less relevant than the content of the scene (e.g. specific scattering properties, structures, objects, etc.). Moreover, the continuous increase in the size of the archives and in the va-riety and complexity of EO sensors require new methodologies and tools - based on a shared knowledge - for information min-ing and management, in support of emergmin-ing applications (e.g.: change detection, global monitoring, disaster and risk manage-ment, image time series, etc.). Along the years, several solutions were presented for accessing the Earth-Observation archives as for example queries of the image archive using a small number of parameter like: geographical coordinates, acquisition times, etc.(Wolfm¨uller et al., 2009). Later, the concept of query by ex-ample allowed to find and retrieve relevant images taking into account only the image content, provided in the form of primitive features, several systems following this principle appeared for in-stance (Agouris et al., 1999), (Mu˜noz and Datcu, 2010), (Datcu et al., 2003),(Shyu et al., 2007). However, later the problems of matching the image content (expressed as primitive features in the low level of processing) with semantic definitions adopted by human were evident; causing the so-called semantic gap (Smeul-ders et al., 2000). With the semantic gap, the necessity of seman-tic definition was clearly demonstrated. In an attempt to reduce the semantic gap, more systems including labeling or definition of the image content by semantic names were introduced. For
∗Corresponding author. This is useful to know for communication with the appropriate person in cases with more than one author
example, (Rasiwasia et al., 2007) clarified the problem of the se-mantic gap and proposed several methods for linking the image content with semantic definitions. Here, it was demonstrated that the semantic representation has an intrinsic benefit for image re-trieval by introducing the concept of query by semantic example (semantics and content). In general, an image archive contains additional information apart from the pixel raster data, as for ex-ample, distribution data, acquisition dates, processing and qual-ity information, and other related information, which in general is stored and delivered together with the image data in the form of text files (metadata). However, this information is not fully exploited in querying the image archive. Thus, another important issue is how to deal with and take advantage of the additional in-formation delivered together with EO images (Espinoza-Molina and Datcu, 2013).
2004). Here, it highlighted the importance of integration of in-teractive geospatial data visualization with statistical data min-ing algorithms. A 3D visualization and interactive exploration of large relational data sets through the integration of several multi-dimensional data visualization techniques and for the purpose of visual data mining and exploratory data analysis was presented in (Yang, 2003). Here, the experiments were done using more than a million records in a relational database. Recently, as an advanced example of visual data mining system implementation, the system called Immersion Information Mining was introduced in (Babaee et al., 2013). This system uses virtual reality and is based on visual analytic approach that enables knowledge discov-ery from EO archives.
In this paper, we propose system architecture which deals with knowledge discovery and data mining from Earth-Observation (EO) images, related geospatial data sources and their associ-ated metadata, mapping the extracted low-level data descriptors into semantic classes, and providing an interactive method for efficient data mining of big data. Our system follows a mod-ular architecture and is composed of the following components 1) the data model generation implementing methods for extract-ing relevant descriptors (low-level features) of the data sources, analysing their metadata in order to complement the information and to create a data model. 2) A database management system, where the database structure supports the knowledge manage-ment. 3) Data mining and knowledge discovery tools allowing the end-user to perform advanced queries and to assign seman-tic annotations to the image content. The low-level features are complemented with semantic annotations giving semantic mean-ing to the image information. 4) Query builder tools for helpmean-ing the end-user to find and retrieve scene of interest based on param-eters such as semantics, metadata, and image content. 5) Visual data mining providing Human-Machine Interfaces for navigating and browsing the big archive of heterogeneous data using 2D or 3D representation.
1. SYSTEM ARCHITECTURE
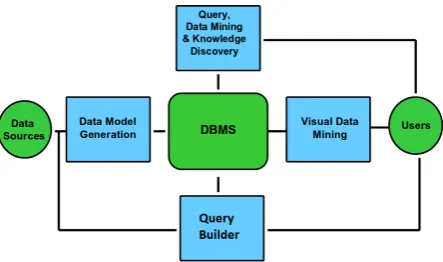
An Earth-Observation data mining and knowledge discovery sys-tem intends to implement a communication channel between the Earth-Observation (EO) data sources and the end-user who re-ceives the content of the data coded in an understandable for-mat associated with semantics (Koubarakis et al., 2012). The architecture concept and its components are described in Figure 1. The process starts with a new acquisition of an EO image, it initiates the data model generation, transforming from an ini-tial form of full EO products to much smaller value added prod-ucts including image descriptors, enriched metadata, semantics, etc. called data model, which will be available for immediate ex-ploitation and analysis by the end-user. The data model is stored into the database enabling the system functionalities as for exam-ple, queries, data mining, visualization, etc.
TheData Sourcesare satellite images and their associated meta-data (i.e. acquisition time, incidence angles, etc.), and auxiliary data in vector format coming from geographical information sys-tem (GIS) sources that complement the information about the images, for instance, park boundaries, city boundaries or land uses represented as polygon layers. TheData Model Genera-tionfocuses on a content and context analysis of the different data sources. The image content analysis provides different fea-ture extraction methods, which are dealing with the specificities of satellite images in order to represent the relevant and correct information contained in the images known as descriptors. The image descriptors are complemented with image metadata (text
Figure 1: Components of Data Mining and Knowledge Discovery system
information) and GIS data (vector layers). It is important to note that the efficiency of the query builder, data mining and knowl-edge discovery components depends on the robustness and accu-racy of the image descriptors. The data model will be stored into aDatabase Management System (DBMS), which acts as the core of the system and supports its functionalities. TheQuery Builder (QB)component allows the end-user to perform several searches based on metadata, on the image content, and on semantic de-scriptors. The QB provides a list of metadata parameters that can be used to retrieve several scenes, it also presents a semantic cate-gories that can be used as query parameters, and finally it displays a list of available images in order to enable the query by example. The Operator (User) requires visual information that is intuitive, contrary to raw images such as TerraSAR-X images that feature information such as forests, water bodies, etc, as different grey levels. However, combining the image content with semantics, text descriptions, etc, the operator can better understand the con-tent of the image and perform queries over collections of images easily.
TheData Mining and Knowledge Discovery componentrequires integration of 1) image processing and pattern recognition for un-derstanding and extracting useful descriptors from a single im-age, 2) spatial data mining for identifying implicit spatial rela-tionships between images, and 3) content based retrieval of im-ages from the archive based on their semantic and visual con-tent. These types of techniques are used to discover knowledge from the EO data sources. Therefore, knowledge discovery from EO images is supported by concepts, tools, algorithms and ap-plications for extracting and grouping relevant image descriptors, combining them with text and vector information, and categoriz-ing the image content into semantic categories. TheVisual Data Miningcomponent allows interactive exploration and analysis of very large, high complexity, and non-visual data sets stored into the database. It provides to the operator an intuitive tool for data mining by presenting a graphical interface, where the selection of different images in 2-D or 3D space is achieved through visual-ization techniques, data reduction methods, and similarity metrics to group the images.
In the following subsections the system components are described in detail.
1.1 Data sources
of scientific observation of the Earth (DLR, 2007). The term Level 1b productstands for TerraSAR-X basic products, which are mainly composed of the main TerraSAR-X image in a geotiff format, and the annotation section, which contains all the basic information on the delivered product as uniform as possible for all product types in a XML file.
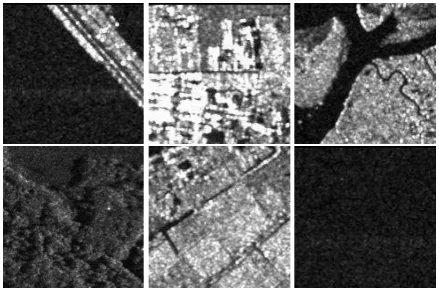
Examples of TerraSAR-X image content are presented in Fig-ure 2. Here, we selected TerraSAR-X sub-scenes representing 6 major land-use and land-cover classes for example bridges, ur-ban area, rivers, forest, agricultural area, and ocean. In Figure 2, we can see that urban area classes are the classes with very high brightness. Semantic class forest has medium brightness and homogeneous texture. The brightness varies according to the thickness of vegetation. Rivers appear as dark linear features and class ocean appears as dark pixels in the TerraSAR-X image.
Figure 2: Examples of TerraSAR-X image content. The sub-sences represent (left-right) bridges, high density urban area, river, forest, agricultural area, and ocean.
1.2 Data Model Generation
The Data Model Generation (DMG) focuses on the design and implementation of methods for the extraction of relevant descrip-tors (features) from satellite images, specifically TerraSAR-X im-ages and combined usage of raster imim-ages and vector data in syn-ergy with existing metadata.
DMG starts with creating a collection and specifying the EO products to be ingested in addition to their input parameters (i.e. product path, patch size, levels of resolution, etc.). Later the metadata content analysis subcomponent reads the xml file and extracts the relevant metadata entries. Further, the image con-tent analysis subcomponent processes the EO products generat-ing a grid of multi-size patches with their quick-looks by cut-ting the image in several patches. Later, the primitive features are extracted from each generated patch by the selected methods. Finally, all the generated information is stored into a relational database enabling the rest of the component functionalities. The information can later be used either for classification purposes or data mining and knowledge discovery. During DMG the meta-data of an EO image is processed. In general, the metameta-data comes in a text format stored as markup language (e.g., XML) files in-cluding information about the acquisition time, the quality of the processing, description of the image like resolution, pixel sping, number of bands, origin of the data, acquisition angles, ac-quisition time, resolution, projection, etc. The use of metadata enriches the data model by adding more parameters that can be used later in advanced queries. Currently, the Data Model Gener-ation counts on two feature extraction methods, namely, the Ga-bor Linear Moment and Weber Local Descriptors.
1.2.1 Gabor Linear Moment (GLM) : It is a linear filter used in image processing. Frequency and orientation represen-tations of a Gabor filter are similar to those of the human visual system, and it has been found to be particularly appropriate for texture representation and discrimination. In the spatial domain, a 2D Gabor filter is a Gaussian kernel function modulated by a sinusoidal plane wave. Gabor filters are self-similar; all filters can be generated from one mother wavelet by dilation and rota-tion. The implementation of the Gabor filter by (Manjunath and Ma, 1996) convolves an image with a lattice of possibly overlap-ping banks of Gabor filters at different scales, orientations, and frequencies. The scale is the scale of the Gaussian used to com-pute the Gabor wavelet. The texture parameters comcom-puted from the Gabor filter are the mean and variance for different scales and orientations (Singh and Datcu, 2013). The dimension of the final feature vector is equal to twice the number of scales multiplied by the number of orientations; for instance, using two scales and six orientations results in a feature vector with 24 elements.
1.2.2 Weber Local Descriptor (WLD) : Inspired by Weber’s law, (Chen et al., 2010) proposed a robust image descriptor for texture characterization in optical images with two components: differential excitation and orientation. The differential excitation component is a function of the ratio between two terms: 1) the relative brightness level differences of a current pixel compared to its neighbours and 2) the brightness level of the current pixel. The orientation component is the gradient orientation of the cur-rent pixel. Using both terms, a joint histogram is constructed giving the WLD descriptor as a result. This filter was adapted for SAR images (Cui et al., 2013a). Here, the gradient in the original WLD was replaced by the ratio of mean differences in vertical and horizontal directions.
As result of the DMG, part of the data model is created and stored into the database. The generation of the data model us-ing a TerraSAR-X scene of 8000×8000 pixels size takes approx-imately less than three minutes, which is a reasonable computing time in the big data era. The data model will be completed by us-ing active learnus-ing methods for semantic annotation of the image content and posteriori it will be complemented with geospatial information coming from linked open data sources.
1.3 Database Manager System (DBMS)
The Data Model generated by the DMG is wrapped into tables and columns, and stored into a relation database system. DBMS provides the tools for accessing and manipulating the tables of the database as well as enabling and granting the access to the data mining methods and queries. The main entities in the data model are: EO product, image, metadata, patch, primitive features, se-mantic labels and annotation.
1.4 Query Builder
The Query Builder (QB) allows the end-user to pose different kind of searches by combining several parameters and operators. In the following, we describe the possible types of queries that can be performed.
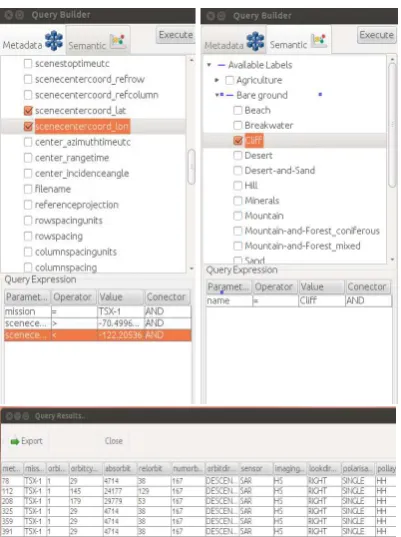
Upper-left part of Figure 3 shows the GUI of the query based on metadata. The GUI displays a list of available metadata parame-ter (eg. mission type, row spacing, latitude, longitude, incidence angle, etc.), which can be selected by the end-user and later a value has to be entered. In this example, the parameters ”mis-sion”, ”latitude” and ”longitude” were selected and the results are presented in a the lower part of Figure 3.
1.4.2 Queries based on semantics : In the queries based on standard metadata, the user is limited to little information for querying rich images databases. More powerful queries can be performed by including semantics and image content through a query language. The use of semantics will help the end-user to better understand the image content.
Queries based on semantic enables an end-user to use a prede-fined frame to express a more complex sentence, or question composed by words and numeric descriptors. The syntax is pre-defined as a set of simple operators (e.g. less than, equals to, etc.) together with a list of available semantic labels (see upper-right part of Figure 3), which were predefined by data mining and knowledge discovery methods. We may distinguish two types of queries here
• Queries based on Semantic Labels: The user can enter a
”simple” label in the form a text or select form the available labels in the catalogue to perform the query. The labels are organized in a hierarchical two level tree. As for example Bare ground contains Beach, Hills, etc. (see Figure 3).
• Queries based on Ontologies: Using this query, the end-user can pose queries based on relations between the semantic labels.
Upper-right part of Figure 3 shows an example of GUI for queries based on semantics. Here, we can see the available labels grouped in two level categories. The user select ”cliff” as query parameter. The results are presented in a similar list that the lower-part of the Figure 3.
More advanced queries can be performed by combined metadata and semantic labels.
1.4.3 Queries based on image content : This query enables the user to select the content of a desired image and to get a set of similar images back. This query uses the concept of query based on example. It is implemented using primitive features to de-scribe the image content and distance measures to discover sim-ilar content in the database. In this kind of queries the image content is used as query parameter, the process starts when the user selects a patch of interest, which is passed through the sys-tem, the primitive features from this patch are extracted and later a similarity metric between the features of the query patch and the all features stored in the database are computed. The results are ranked according to this metric and displayed on the screen. In order to have a objective retrieval evaluation of the results, we can compute the precision and recall metrics (Manning et al., 2008).
In the following, we present some examples of query by example using UC Merced Land Use data set (Yang and Newsam, 2010). This data set has 2100 images grouped in 21 image categories and 100 images per category. Each image has 256x256 pixel size with a resolution of 30 cm. We selected this data set because this is reliable and it can be considered as ground-truth for the eval-uation as well as to help the reader with the visual interpretation of the query results.
Figure 3: (left-right) GUI of the Query Builder: Examples of query based on metadata, query based on semantic.
Figure 4 shows an example of GUI for queries based on example. The upper-left part shows that the user selected patch with the content of interest for example ”forest” and the system retrieves a list of similar images. From the query results can be visually ob-served that the most retrieved patches belongs to forest category, therefore the precision values are high, ranging between 90 and 70 percentage at retrieval 100. It shows some confusions starting from retrieval@70. However, the confusions are with class less similar in colour like river, which contains forest and water.
In the upper-right part of Figure 4, the user selected the seman-tic category ”chaparral”. From the query results can be visually observed that the retrieved patches belongs to the desired class therefore the precision values are high ranging between 90 to 80 percentage.
1.5 Data Mining and Knowledge Discovery
The Data Mining and Knowledge discovery component concen-trates on investigating new semi-supervised learning methods to cope with heterogeneous spatial-temporal image data and to take into account contextual information in order to create semantic descriptors and annotated image patches.
This component is based on machine learning methods and re-lies on 1) feature extraction methods providing the most rele-vant descriptors of the images,which are provided by the data model generation, 2) Support Vector Machine (SVM) as classi-fier (Chang and Lin, 2011) grouping the image descriptors into generic classes (without semantic), and 3) relevance feedback in-teracting with the end user (Costache et al., 2006).
The knowledge discovery component starts presenting a list of available images where the user selects a content of interest by giving positive and negative examples. SVM as active learning method for semantic definition (Cui et al., 2013b) uses as in-put the training data sets obtained interactively from the GUI. The training dataset refers to a list of images marked as positive or negative examples. The output is the verification the active learning loop sent to GUI and the semantic annotation written in the database catalogue. The methods combine labelled and unla-belled data during training to improve the performance of classi-fication and the generation of categories (number of classes).
The work-flow of the image annotation with semantic descriptors based on Support Vector Machine is described as follows
1. Access to the database and select the patches to be used and load their feature vectors.
2. Normalize the features and transform them to SVM format.
3. Display the available patches to the end-user through the GUI.
4. Training by the user interaction through given positive and negative examples.
5. Perform the SVM training and obtain the prediction (active learning).
6. Update the results on the screen ordering according to the prediction value.
7. Stop the loop when the user is satisfied with the results.
8. Store the new semantic label into the database.
During the active learning two goals are tried to achieve: 1) learn the targeted image category as accurately and as exhaustively as possible and 2) minimize the number of iterations in the relevance feedback loop.
Figure 5 shows an example of implementation. Here a TerraSAR-X scene is presented in the right part of the screen and its patches are displayed on the left-part. The end-user selects a set of pos-itive examples by clicking with left-button on the image content and a set of negative examples (right-button). In this example, the end-user is looking for urban areas, therefore 6 tiles with ur-ban area content are marked in green, and he discarded 5 tiles containing agricultural area which are marked in red. The tool creates a training data based on these examples and passes them to the SVM, which performs the prediction. This process can be repeated several times until the user is satisfied with the result, then the class is stored into the database.
Figure 5: GUI of the Knowledge Discovery tool. Left part dis-plays a the image patches while right-part presents the quick look of the main image. The training is done by giving positive exam-ples in green and negative examexam-ples in red. In this example the user is searching for urban areas marked in green.
1.6 Visual Data Mining
Visual Data Mining (VDM) component focuses on designing and elaborating Human Machine Interfaces (HMI) techniques with the users in the loop to optimize the visual interaction with huge volumes of data of heterogeneous nature. Since human percep-tion is limited in communicapercep-tion capacity, the HMI paradigm is supported by special methods that increase the information being transmitted (Espinoza-Molina et al., 2014).
VDM component is able to interactively visualize feature spaces of large repositories of images. It provides to the end-user an intu-itive tool for data mining by presenting a graphical interface with functionalities such as browsing, querying, zooming, etc., thus, enabling the end-user to explore and exploit the image database, where the selection of different images and/or image content in 2-D or 3D space is achieved through visualization techniques, data reduction methods, and similarity metrics to group the im-ages. The dimensionality reduction deals with converting then dimension feature vector into vector of much lower dimension-ality (i.e. 3 dimensions) such that each dimension convey much more information. As for example, the Gabor feature vector with 48 dimensions is converted into vector of 3 dimensions. Later, the 3 dimensions are projected on the axis and the content presented on the screen.
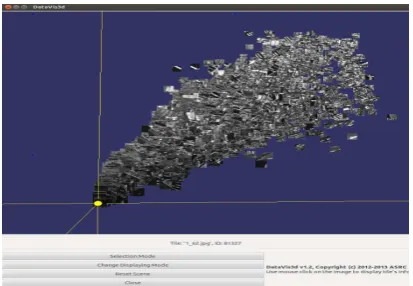
Figure 6 displays an example of the VDM component and its GUI. For this example, we selected about 7 TerraSAR-X scenes over Germany and processed them using the DMG component to extract the primitive features and to cut the image into patches giving as result a total of 10.000 patches with 160x160 pixels size. Each patch has a feature vector with 48 dimensions. In Fig-ure 6 we can observe that most of the patches are grouped into one big cluster. However, patches containing natural scenes like wa-ter bodies are grouped around the cenwa-ter of the projection while patches with man-made structures (e.g cities, etc.) are spread at the borders. The user can rotate the projection for adjusting the axis and to have a better view of the data set as well as he can zoom-in and zoom-out the patch content. This tool also allows to select a group of patches of interest by using a spherical selection. This group of patches can be exported to google earth for further analysis.
2. CONCLUSION
Figure 6: 3D visualization of TerraSAR-X patches from Germany using VDM tool.
the data model generation. The data model generation performs the tiling of the image content, the feature extraction based on patch, the quick-looks generation, and the metadata extraction giving as result a complete model of the EO data, which later will be enhanced by adding semantic labels using machine learning methods. The user can query the image archive using the query builder and several parameters like semantic, metadata and im-age content. In addition, visual data mining functions allow the exploration and exploitation of huge image archives (big data) since it is based on advanced visualization techniques. Finally, functions like data mining and knowledge discovery enable se-mantic definition of the image content and finding hidden pat-terns in the image archive. Summarizing, the system components can help the end-user to deal with large image collections by ac-cessing and extracting automatically their content (Data Model Generation), allowing querying (by means of image content and semantics), mining relevant information (Query Builder), infer-ring knowledge about patterns hidden in the image archive (Data Mining and Knowledge Discovery), and visualizing the complete image database (Visual Data Mining).
As further work remains to demonstrate the platform functional-ity by creating study case scenarios as for example monitoring of land cover changes to detect and quantify local deforestation us-ing optical and SAR images together with auxiliary information. Also, a complete evaluation of the system is needed in order to improve its components and the support for more types of satel-lite images is required.
3. ACKNOWLEDGE
The image data for this study have been provided by the TerraSAR-X Science Service System (Proposal MTH 1118). Special thanks go to Ursula Marschalk and Achim Roth of DLR, Oberpfaffen-hofen.
REFERENCES
Agouris, P., Carswell, J. and Stefanidis, A., 1999. An en-vironment for content-based image retrieval from large spatial databases. ISPRS Journal of Photogrammetry and Remote Sens-ing 54(4), pp. 263 – 272.
Babaee, M., Rigoll, G. and Datcu, M., 2013. Immersive Inter-active Information Mining with Application to Earth Observation Data Retrieval. In: Availability, Reliability, and Security in In-formation Systems and HCI, Lecture Notes in Computer Science, Vol. 8127, Springer Berlin Heidelberg, pp. 376–386.
Bifet, A., 2013. Mining big data in real time. Informatica (Slove-nia) 37(1), pp. 15–20.
Chang, C.-C. and Lin, C.-J., 2011. LIBSVM: A library for sup-port vector machines. ACM Transactions on Intelligent Systems and Technology 2, pp. 27:1–27:27.
Chen, J., Shan, S., He, C., Zhao, G., Pietikainen, M., Chen, X. and Gao, W., 2010. WLD: A Robust Local Image Descriptor. IEEE Transactions on Pattern Analysis and Machine Intelligence 32(9), pp. 1705–1720.
Costache, M., Maitre, H. and Datcu, M., 2006. Categorization based relevance feedback search engine for earth observation im-ages repositories. In: IEEE International Conference on Geo-science and Remote Sensing Symposium, 2006. IGARSS 2006., pp. 13 –16.
Cui, S., Dumitru, C. and Datcu, M., 2013a. Ratio-Detector-Based Feature Extraction for Very High Resolution SAR Image Patch Indexing. IEEE Geoscience and Remote Sensing Letters 10(5), pp. 1175–1179.
Cui, S., Dumitru, O. and Datcu, M., 2013b. Semantic annota-tion in earth observaannota-tion based on active learning. Internaannota-tional Journal of Image and Data Fusion pp. 1–23.
Datcu, M., Daschiel, H., Pelizzari, A., Quartulli, M., Galoppo, A., Colapicchioni, A., Pastori, M., Seidel, K., Marchetti, P. and D’Elia, S., 2003. Information mining in remote sensing image archives: system concepts. IEEE Transactions on Geoscience and Remote Sensing 41(12), pp. 2923 – 2936.
de Oliveira, M. F. and Levkowit, H., 2003. From visual data exploration to visual data mining: a survey. IEEE Trans. Visual. Comput. Graphics 9(3), pp. 378–394.
DLR, 2007. TerraSAR-X, Ground Segment, Level 1b Prod-uct Data Specification, TX-GS-DD-3307. http://sss.terrasar-x.dlr.de/pdfs/TX-GS-DD-3307.pdf.
Espinoza-Molina, D. and Datcu, M., 2013. Earth-Observation Image Retrieval Based on Content, Semantics, and Metadata. IEEE Transactions on Geoscience and Remote Sensing 51(11), pp. 5145–5159.
Espinoza-Molina, D., Datcu, M., Teleaga, D. and Balint, C., 2014. Application of visual data mining for earth observation use cases. In: ESA-EUSC-JRC 2014 - 9th Conference on Image Information Mining Conference: The Sentinels Era, pp. 111–114.
Fan, W. and Bifet, A., 2013. Mining big data: Current status, and forecast to the future. SIGKDD Explor. Newsl. 14(2), pp. 1–5.
Keim, D., Panse, C., Sips, M. and North, S., 2004. Visual data mining in large geospatial point sets. IEEE Comput. Graph. Appl. 24(5), pp. 36–44.
Koubarakis, M., Kyzirakos, K., Karpathiotakis, M., Nikolaou, C., Vassos, S., Garbis, G., Sioutis, M., Bereta, K., Michail, D., Kon-toes, C., Papoutsis, I., Herekakis, T., Manegold, S., Kersten, M., Ivanova, M., Pirk, H., Zhang, Y., Datcu, M., Schwarz, G., Du-mitru, O., Espinoza-Molina, D., Molch, K., Giammatteo, U. D., Sagona, M., Perelli, S., Reitz, T., Klien, E. and Gregor, R., 2012. Building Earth Observatories using Scientific Database and Se-mantic Web Technologies. In: Proc. ESA-EUSC-JRC 8th Con-ference on Image Information Mining.
Manning, C. D., Raghavan, P. and Schtze, H., 2008. An Intro-duction to Information Retrieval. Cambridge University Press, Cambridge, England.
Mu˜noz, I. M. G. and Datcu, M., 2010. System design considera-tions for image information mining in large archives. Geoscience and Remote Sensing Letters, IEEE 7(1), pp. 13 –17.
Rasiwasia, N., Moreno, P. and Vasconcelos, N., 2007. Bridging the Gap: Query by Semantic Example. IEEE Transactions on Multimedia 9(5), pp. 923 –938.
Shyu, C.-R., Klaric, M., Scott, G. J., Barb, A. S., Davis, C. H. and Palaniappan, K., 2007. GeoIRIS: Geospatial Information Retrieval and Indexing System-Content Mining, Semantics Mod-eling, and Complex Queries. IEEE Transactions on Geoscience and Remote Sensing 45(4), pp. 839–852.
Singh, J. and Datcu, M., 2013. SAR image categorization with log cumulants of the fractional fourier transform coefficients. IEEE T. Geoscience and Remote Sensing 51(12), pp. 5273–5282.
Smeulders, A., Worring, M., Santini, S., Gupta, A. and Jain, R., 2000. Content-based image retrieval at the end of the early years. IEEE Transactions on Pattern Analysis and Machine Intelligence 22(12), pp. 1349 –1380.
Wolfm¨uller, M., Dietrich, D., Sireteanu, E., Kiemle, S., Mikusch, E. and B¨ottcher, M., 2009. Data Flow and Workflow Organization- The Data Management for the TerraSAR-X Pay-load Ground Segment. IEEE Transactions on Geoscience and Remote Sensing 47(1), pp. 44 –50.
Yang, L., 2003. Visual exploration of large relational data sets through 3d projections and footprint splatting. IEEE Trans. Knowledge Data Eng. 15(6), pp. 1460–1471.