AUTOMATED CLASSIFICATION OF HERITAGE BUILDINGS FOR AS-BUILT BIM
USING MACHINE LEARNING TECHNIQUES
M. Bassier∗, M. Vergauwen, B. Van Genechten
Dept. of Civil Engineering, TC Construction - Geomatics KU Leuven - Faculty of Engineering Technology
Ghent, Belgium
(maarten.bassier, maarten.vergauwen, bjorn.vangenechten)@kuleuven.be
KEY WORDS:Scan-to-BIM, Classification, Digital Heritage, As-built BIM, Laser Scanning
ABSTRACT:
Semantically rich three dimensional models such as Building Information Models (BIMs) are increasingly used in digital heritage. They provide the required information to varying stakeholders during the different stages of the historic buildings life cyle which is crucial in the conservation process. The creation of as-built BIM models is based on point cloud data. However, manually interpreting this data is labour intensive and often leads to misinterpretations. By automatically classifying the point cloud, the information can be proccesed more effeciently. A key aspect in this automated scan-to-BIM process is the classification of building objects.
In this research we look to automatically recognise elements in existing buildings to create compact semantic information models. Our algorithm efficiently extracts the main structural components such as floors, ceilings, roofs, walls and beams despite the presence of significant clutter and occlusions. More specifically, Support Vector Machines (SVM) are proposed for the classification. The algorithm is evaluated using real data of a variety of existing buildings. The results prove that the used classifier recognizes the objects with both high precision and recall. As a result, entire data sets are reliably labelled at once. The approach enables experts to better document and process heritage assets.
1. INTRODUCTION
Data management is becoming increasingly important in the her-itage industry. Stakeholders are adopting intelligent data mod-els such as Buildings Information Modmod-els (BIM) to better con-trol their data. These intelligent databases centralise the immense amount of information about a building at the varying stages of the conservation process. By combining metric and non-metric information in a specific data structure, experts can better man-age, analyse and diagnose the asset (Giudice and Osello, 2013). Furthermore, the centralised approach copes with the problem of data heterogeneity.
Where BIM was initially engaged for new structures, the indus-try and the heritage sector now look to implement the technology for existing buildings for the purposes of heritage documentation, maintenance, quality control, etc. (Volk et al., 2014, Pauwels et al., 2013, Simeone et al., 2014). These models reflect the state of the building in its current state (as-built condition). It serves as a spatial database where all the available documentation of the structure can be stored and analysed by the stakeholders. In con-trast to traditional as-design models, these as-built BIM models are based on existing documentation. This is problematic as the information of heritage buildings is often sparse, outdated or non-existing.
The production of as-built BIM models involves the acquisition of the geometry of the structure and the reconstruction of the BIM model based on point cloud data (Garagnani and Manfer-dini, 2013). Currently, this process is manual which is labour in-tensive and prone to misinterpretations. In order to create BIM’s more efficiently, we look to automate this process. A key step in the automated workflow is the identification of structural el-ements such as floors, ceilings, roofs, walls and beams (Bassier
∗Corresponding author
et al., 2016). This field of research is typically referred to as Se-mantic labelling.
In this work we propose an automated method for the classifica-tion of structural elements to aid the producclassifica-tion of as-built BIM models. More specifically, we look to identify structural objects in existing buildings (Fig. 2). These objects typically have vary-ing characteristics, are surrounded by clutter and are partially oc-cluded (Tang et al., 2010, Xiong and Huber, 2010). The scope of this research is focussed on the processing of a wide variety of buildings in varying conditions. Additionally, our method is applicable to any point cloud data.
The remainder of this work is structured as follows. The back-ground is presented in Section 2. In Section 3 the related work is discussed. In Section 4 the methodology is presented. The test design and experimental results are proposed in Section 5. Finally, the conclusions are presented in Section 6.
2. BACKGROUND
Laser scanning and photogrammetry are becoming increasingly widespread in the recording of cultural heritage sites (Boehler and Marbs, 2004). Where previously only select sparse data was available, current systems are able to measure or compute hun-dreds of thousands of points per second grouped in point clouds. A popular system for building surveying is a Terrestrial Laser Scanner (TLS). This static scanning device is placed on a sur-veying tripod on multiple locations and captures up to a million points per second.
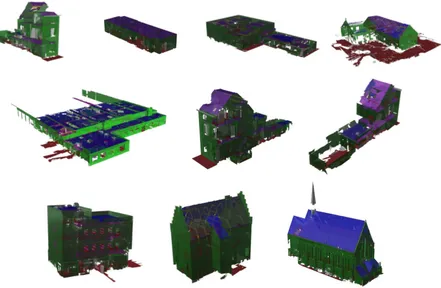
Figure 1: Used test cases for the model evaluation. The test data includes houses, offices, factories, a castle and a church.
Baik et al., 2014). For instance, Dore and Murphy presented a heritage specific component library named Heritage Building In-formation Modeling (HBIM) (Dore et al., 2015, Murphy et al., 2013). As the manual effort is extensive, automated approaches are proposed for the BIM creation of existing buildings. In gen-eral, this Scan-to-BIM process consists of the following steps. First, the points are clustered into groups using statistical proce-dures (Anand et al., 2012). The grouped points are replaced by primitives for computational efficiency. Typically planar primi-tives are used as a basis for further reconstruction. Second, the candidate data is partitioned into different classes. Reasoning frameworks exploiting geometric and contextual information are employed to identify the objects of interest. Finally, the labelled data set is used as a basis for class-specific reconstruction algo-rithms. In this research, an automated approach is proposed for the semantic labelling of the objects using machine learning tech-niques.
Semantic labelling is a classification task that identifies the class of new observations given a set of values known as features (Bishop, 2006, Alpaydin, 2010). These values encode distinct local and contextual information about the observation. Features are in-tuitively defined or extracted from training data sets. Examples of local geometric features are the surface area, dimensions and orientation. Geometric contextual features may describe the sim-ilarity, coplanarity and orthogonality. The set of feature values of each primitive is grouped in a feature vector.
The feature vectors are processed by a reasoning model to iden-tify the class of the primitives. These functions are referred to as classifiers. Both heuristics and machine learning algorithms are proposed for classification. Heuristic models are based on user defined rules in a hierarchy. These rules require no training of the model parameters as they are intuitively set. While very
ef-ficient, heuristics are inherently biased and case-specific. Alter-natively, more complex models are employed such as Discrimi-nant Analysis (DA), Decision Trees, Ensemble Classifiers, Sup-port vector Machines (SVM), Neural networks, Random Fields, etc. (Bishop, 2006, Alpaydin, 2010, Sutton and Mccallum, 2011, Koller and Friedman, 2009, Criminisi and Shotton, 2013, Domke, 2013). These algorithms train their model parameters based on training data. While the non-linear functions and probabilistic nature of some of these models allow for a more accurate ap-proximation of the reality, the computational effort is challeng-ing. Also, these models typically are a black box solution that leaves little room for user control. Additionally, extensive train-ing data is required for these methods to work adequately.
3. RELATED WORK
Table 1: Types of predictor features
Contextual information (surface i, context j)
Description Count
These algorithms combine different weak learners into a strong classification algorithm.
A very promising group of classifiers are Support Vector Ma-chines. These fundamentally two-class algorithms are non- prob-abilistic classifiers that use hyperplanes to separate the data into classes. SVM have been successfully implemented for the clas-sification of both indoor and outdoor point cloud data (Adan and Huber, 2011, Yang and Dong, 2013). In our research, we employ Support Vector Machines in combination with extensive feature vectors as they are very efficient and accurate.
The input data differs between varying approaches. Some re-searchers directly segment the point cloud (Weinmann et al., 2015) while others prefer to work with primitives such as planar meshes. Although working directly on the point clouds can be more accu-rate, it also introduces a higher computational cost and uncer-tainty into the process. In our work, we use primitives as a basis because of the computational advantages.
Prior knowledge has also been considered for the semantic la-belling of buildings. Existing plans or models significantly re-duce the search area for inliers and aid in the scene understand-ing. Several methods have been proposed for model matching be-tween the as-built and as-designed conditions (Yue et al., 2007, Bosche and Haas, 2008). Our approach does not rely on prior knowledge as it is not always available and we are formulating a general approach to process any building.
4. METHODOLOGY
In this paper, a reasoning frame work is presented that identifies the structural elements in buildings. An automated feature ex-traction algorithm combined with an SVM classifier is proposed for the classification of the surfaces. The algorithm takes any set of planar meshes and outputs the classified objects. The algo-rithm and the extracted features are discussed in the following paragraphs.
4.1 Preprocessing
The scope of this work is the processing of any point cloud data of a building. Therefore, the input data of the algorithm is indepen-dent of specific sensors or algorithms. Only the metric informa-tion is processed as it is the basis of any point cloud. During the
preprocessing step, the data is segmented and replaced by primi-tives. These are well understood problems and commercial soft-ware is available. In this research, the Pointfuse engine of Arith-metica is utilised (ArithArith-metica, 2015). After loading the points into the software, planar meshes are fit incrementally through each point cluster with similar normals. A 1cm sampling resolu-tion is used for the primitive fitting. As a result, planar triangular meshes are created.
4.2 Feature Extraction
The various features are computed from the planar meshes. They encode information that allows the algorithm to classify the sur-faces even in cluttered environments. Therefore, the features should be both distinct and robust. Both local and contextual information is exploited. The former encodes the objects geo-metric information while the latter encodes both associative and non-associative information in relation to other surfaces. In our approach, the contextual information is computed for nearby sur-faces and for the data set as a whole. By integrating global infor-mation, general patterns are better detected. Table 1 summarizes the different types and the number of features used in the experi-ments.
The local features are robust descriptors to determine the type of class of the object. The Surface Area is a good indicator for the separation of clutter and structural elements. The Orienta-tion of the surface indicates if the surface belongs to a vertical or horizontal class. For instance, a large horizontal surface is more likely to be a floor, ceiling or roof. The Dimensions give more information about the shape of the object.
The contextual features are more refined descriptors to recognize the specific class of the object. The context differs for the vary-ing feature descriptors. Both the immediate neighbourhood of the observed surface is exploited as well as the entire data set. Ad-ditionally, several features employ only surfaces with a specific orientation or size as context. These surfaces act as a reference for the spatial analysis of the observed surfaces. For instance, the Normal Similarity featuredij=n~i·~nlargecomputes the differ-ence between the normal vector of the surfacen~iand the normals of the nearby large surfaces~nlarge. Coplanarity is defined as
Coplanarity(si, sj) = normal to the neighbouring surfaces (Eq. 1). A default angle of 30◦is specified as the threshold. Parallellity is defined as the distance along the normal to the closest parallel surface. For this feature, the reference surfaces are conditioned to be directly in front of or behind of the observed surface.
Proximity captures the repetitivity of certain object configura-tions. It is defined as the minimum distancedmin~ ij=|ri−rj| between the boundary of the observed surfaceriand a set of ref-erence surfacesrj. The following distances are evaluated: The vertical distance to the closest large horizontal surface above (1), the vertical distance to the closest large horizontal surface under-neath (2), the distance to the closest large vertical surface (3), and the number of connected surfaces are observed (4).
geometry detailing such as niches. The Topology is encoded by the percentage of occurrence of a certain relation. Five relations are evaluated: The percentage of the area of the observed sur-face that is located directly underneath a large horizontal sursur-face within a threshold (1), the percentage of the area of the observed surface that is located directly above a large horizontal surface within a threshold(2), the percentage of the area of the observed surface that has nothing above it (3), the percentage of the area of the observed surface that is in between two large vertical surfaces (4) and the presence of noise surfaces within line of sight directly above the observed surface (5). As a result, all the computed fea-tures values are bundled in feature vectors and are passed to the classifier model for further processing.
4.3 Model formulation
Given the feature vectorsx1→t={x1, . . . , xn}, one of k labels
is predicted for the surfacest. In this research Support Vector Machines are proposed to classify the observed surfaces (Bishop, 2006, Brownlee, 2015). These non-probabilistic functions sepa-rate the feature space in two by defining a hyperplane given the feature values. The geometrical distance ofxito the hyperplane
is given by
y(wTø(xi) +b)
kwk (2)
whereø(xi)denotes a fixed feature-space transformation (kernel function),bthe bias andw={w1, . . . , wn}is the weight vector
for each feature (Eq.2). Ify(x,w, b) ≥ 1, t ∈ class1and if y(x,w, b) ≤ −1, t ∈ class2. In our research, we employ a quadratic kernel function as it is more suitable to deal with the complexity of structural element parameters.
The decision function is computed by maximising the margin or distance from the hyperplane to the closest feature vectors
x. This is performed by optimizing the function forwandb.
To satisfy the separation criteria, the solution is constrained on
y(wTø(xi) +b)−1≥0. The maximum margin is then given
The function is be solved by incorporating the constraints in the optimization. Lagrange multipliers are used to compute the so-lution (Bishop, 2006). New surfaces are classified by evaluating the signed distance functiony(x,w, b) from the hyperplane to
the surface feature vector. As Support Vector Machines are fun-damentally two-class classifiers, we employ multiple SVM’s in a one-versus-one configuration. k(k−1)/2different two-class functions are computed on all possible pairs of classes. New sur-faces are labelled according to the number of votes of the com-bined SVM’s. This is a very efficient approach as long as the number of labels is fairly low.
4.4 Learning
The maximum-margin hyperplane is optimized using a large set of known data points. A downside of Support Vector Machines is their tendency to overfit the hyperplane. Therefore, a regulariza-tion parameter(λ)is introduced that penalizes large parameters (Criminisi and Shotton, 2013). This keeps the model from re-lying too much on individual data points. During the training, cross-validation is employed to enhance the model performance.
The data is partitioned into K-folds. Each partition is consecu-tively withheld as the other partitions are used for training. The final optimized maximum-margin hyperplane is given by the av-eraged model parameters.
4.5 User interface
The feature extraction and prediction algorithm are implemented in the Rhinoceros plug-in Grasshopper. This intuitive procedu-ral programming platform allows for flexible data processing and evaluation. Additionally, the classified surfaces are exported to the Rhinoceros model space for validation and further process-ing.
5. EXPERIMENTS
The algorithm was trained and tested on a variety of existing buildings including houses, offices, industrial buildings, churches, etc. 10 structures representing different types of heritage build-ings were selected for the evaluation (Fig.1). The sites were ac-quired with terrestrial laser scanning and vary from 20 to 120 scans. The buildings were measured under realistic conditions and are highly occluded and cluttered. After registration, Arit-mica’s Pointfuse (Arithmetica, 2015) was employed for the pla-nar mesh extraction. Surfaces larger than0.4m2were withheld
for the identification of the elements as they are more likely to belong to a structural object. Over 7000 surfaces were manually labelled as ground truth.
5.1 Training
The model was trained with the 17 predictors from table 1. The available classes included floors, ceilings, roofs, walls, beams and clutter. The k-fold cross-validation was performed by sequen-tially using 9 structures for training and the remaining structure for testing. The quadratic SVM was trained in under 40s.
5.2 Classification SVM
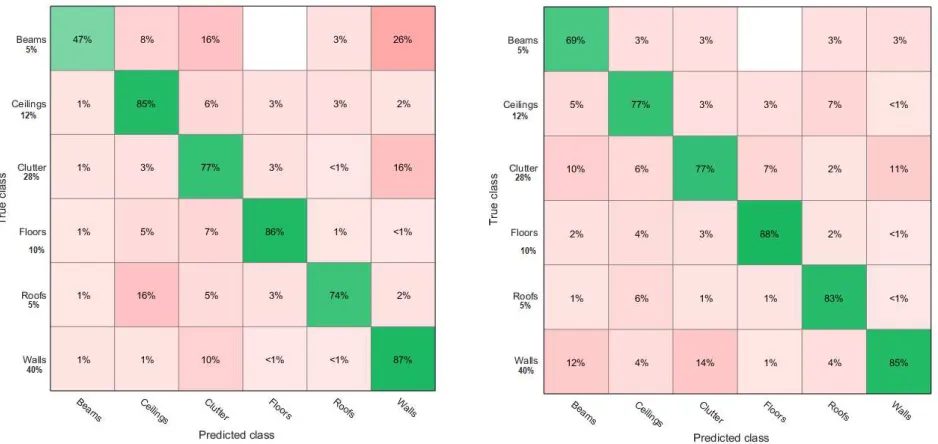
The performance of the model is shown in Fig.2. The average accuracy of the model is 81%. The average recall and precision is 80% and 82% respectively. Overall, this is very accurate given the large variety of buildings that were evaluated. Typical objects such as floors, ceilings and walls were extracted with over 85% accuracy. This proves that while buildings have many unique ob-jects and are heavily cluttered, their structural elements are reli-ably detected. This is accentuated by the amount of clutter. Over 28% of the scenes consist of clutter larger than 0.4m. Together with the small surfaces, over 90% of the environment consists of non-structural objects.
Fig. 2 shows that the beams and roofs classes slightly underper-form. This is due to the limited amount of available data. With only a small percentage of the surfaces available for the training, the parameter estimation of these classes is error prone. Addition-ally, beams have less distinct features. They are often occluded by ceilings, have varying directions and are hard to approximate by planar surfaces.
5.3 Discussion
Figure 2: Confusion matrices of multiclass SVM training: Recall performance (left) and precision performance (right). The percentages under the True classes represents the data distribution of the surfaces.
perform adequately is problematic for certain classes. Elements such as roofs and beams represent only a small fraction of the data and thus the model will provide a poor solution for these classes. In these cases, hard constraints from heuristics in combination with machine learning may provide a solution.
6. CONCLUSION
In this paper, a classification algorithm is presented for the au-tomated identification of structural elements in heritage build-ings. Using Support Vector Machines, the floors, ceilings, roofs, beams, walls and clutter are reliable labelled even in highly clut-tered and occluded environments. The experiments prove that the classification is highly accurate for a wide variety of buildings in-cluding regular houses, castles, churches, etc. Furthermore, the integration of the algorithm in a flexible environment allows for intuitive validation by the user.
The identification of building objects is crucial in the process of digitizing heritage. More specifically, the proposed approach can be integrated in the automated creation of semantically rich three dimensional models such as BIMs. In future work, the method will be investigated further to improve the labelling performance for low occurring classes. Additionally, research will be per-formed to detect a wider variety of structures and objects.
7. ACKNOWLEDGEMENTS
The research group Geomatics of the Department of Civil Engi-neering, TC Construction at the KU Leuven in Belgium is grate-fully acknowledged. Additionally, the companies 3Dgeosolu-tions and Leica Geosystems are thanked for the data and equip-ment.
REFERENCES
Adan, A. and Huber, D., 2011. 3D Reconstruction of Interior Wall Surfaces under Occlusion and Clutter. 2011 International Conference on 3D Imaging, Modeling, Processing, Visualization and Transmissionpp. 275–281.
Alpaydin, E., 2010. Introduction to Machine Learning Second Edition. MIT Press.
Anand, A., Koppula, H. S., Joachims, T. and Saxena, A., 2012. Contextually guided semantic labeling and search for three-dimensional point clouds. The International Journal of Robotics Research32(1), pp. 19–34.
Arithmetica, L., 2015. Pointfuse.
Baik, A., Alitany, A., Boehm, J. and Robson, S., 2014. Jeddah Historical Building Information Modelling ”JHBIM” Object Li-brary.ISPRS Annals of the Photogrammetry, Remote Sensing and Spatial Information Sciences, Volume II-5, 2014 ISPRS Technical Commission V Symposium, 23 25 June 2014, Riva del Garda, ItalyII-5(June), pp. 41–47.
Bassier, M., Vergauwen, M. and Van Genechten, B., 2016. Au-tomated Semantic Labelling of 3D Vector Models for Scan-to-BIM. 4th Annual International Conference on Architecture and Civil Engineering (ACE 2016)pp. 93–100.
Bishop, C. M., 2006.Pattern Recognition and Machine Learning. Springer, Berlin.
Boehler, W. and Marbs, a., 2004. 3D Scanning and Photogram-metry for Heritage Recording : a Comparison. Proc. 12th In-ternational Conference on Geoinformatics, University of G¨avle, Sweden(June), pp. 7–9.
Bosche, F. and Haas, C. T., 2008. Automated retrieval of 3D CAD model objects in construction range images.Automation in Construction17, pp. 499–512.
Brownlee, J., 2015.Machine Learning Mastery: Resource guide. Vol. 1, 1.3 edn.
Criminisi, A. and Shotton, J., 2013.Decision forests for computer vision and medical image analysis. Springer London Heidelberg New York Dordrecht.
Dore, C., Murphy, M., McCarthy, S., Brechin, F., Casidy, C. and Dirix, E., 2015. Structural simulations and conservation analysis-historic building information model (HBIM). Interna-tional Archives of the Photogrammetry, Remote Sensing and Spa-tial Information Sciences - ISPRS Archives40(5W4), pp. 351– 357.
Garagnani, S. and Manferdini, a. M., 2013. Parametric Accuracy : Building Information Modeling Process Applied To the Cul-tural Heritage Preservation. International Archives of the Pho-togrammetry, Remote Sensing and Spatial Information Sciences
XL(February), pp. 25–26.
Gerke, M. and Xiao, J., 2014. Fusion of airborne laserscanning point clouds and images for supervised and unsupervised scene classification. ISPRS Journal of Photogrammetry and Remote Sensing87, pp. 78–92.
Giudice, M. D. and Osello, A., 2013. BIM for Cultural Heritage.
International Archives of the Photogrammetry, Remote Sensing and Spatial Information SciencesXL(September), pp. 225–229.
Koller, D. and Friedman, N., 2009.Probabilistic Graphical Mod-els: Principles and Techniques.
Koppula, H. S., Anand, A., Joachims, T. and Saxena, A., 2013. Semantic Labeling of 3D Point Clouds for Indoor Scenes. In:
R:SS workshop on RGB-D cameras, pp. 1–9.
Lim, E. H. and Suter, D., 2009. 3D terrestrial LIDAR classifi-cations with super-voxels and multi-scale Conditional Random Fields.Computer-Aided Design41(10), pp. 701–710.
Lin, H., Gao, J., Zhou, Y., Lu, G., Ye, M., Zhang, C., Liu, L. and Yang, R., 2013. Semantic decomposition and reconstruction of residential scenes from LiDAR data. ACM Transactions on Graphics32(4), pp. 1.
Murphy, M., McGovern, E. and Pavia, S., 2013. Historic Build-ing Information ModellBuild-ing - AddBuild-ing intelligence to laser and image based surveys of European classical architecture. ISPRS Journal of Photogrammetry and Remote Sensing76, pp. 89–102.
Niemeyer, J., Rottensteiner, F. and Soergel, U., 2014. Contextual classification of lidar data and building object detection in urban areas. ISPRS Journal of Photogrammetry and Remote Sensing
87, pp. 152–165.
Pauwels, P., Bod, R., Di Mascio, D. and De Meyer, R., 2013. In-tegrating building information modelling and semantic web tech-nologies for the management of built heritage information. Pro-ceedings of the DigitalHeritage 2013 - Federating the 19th Int’l VSMM, 10th Eurographics GCH, and 2nd UNESCO Memory of the World Conferences, Plus Special Sessions fromCAA, Arqueo-logica 2.0 et al.1, pp. 481–488.
Pu, S. and Vosselman, G., 2009. Knowledge based reconstruction of building models from terrestrial laser scanning data. ISPRS Journal of Photogrammetry and Remote Sensing64(6), pp. 575– 584.
Quattrini, R., Malinverni, E. S., Clini, P., Nespeca, R. and Orlietti, E., 2015. From tls to hbim. high quality semantically-aware 3d modeling of complex architecture. International Archives of the Photogrammetry, Remote Sensing and Spatial Information Sci-ences - ISPRS Archives40(5W4), pp. 367–374.
Simeone, D., Cursi, S., Toldo, I. and Carrara, G., 2014. Bim and Knowledge Management for Building Heritage.Acadia 2014
pp. 681–690.
Sutton, C. and Mccallum, A., 2011. An Introduction to Con-ditional Random Fields. Foundations and Trends in Machine Learning4(4), pp. 267–373.
Tang, P., Huber, D., Akinci, B., Lipman, R. and Lytle, A., 2010. Automatic reconstruction of as-built building information models from laser-scanned point clouds: A review of related techniques.
Automation in Construction19(7), pp. 829–843.
Volk, R., Stengel, J. and Schultmann, F., 2014. Building Infor-mation Modeling (BIM) for existing buildings - Literature review and future needs.Automation in Construction38, pp. 109–127.
Weinmann, M., Jutzi, B., Hinz, S. and Mallet, C., 2015. Seman-tic point cloud interpretation based on optimal neighborhoods , relevant features and efficient classifiers. ISPRS Journal of Pho-togrammetry and Remote Sensing105, pp. 286–304.
Xiong, X., Adan, A., Akinci, B. and Huber, D., 2013. Automatic creation of semantically rich 3D building models from laser scan-ner data.Automation in Construction31, pp. 325–337.
Xiong, X. and Huber, D., 2010. Using Context to Create Seman-tic 3D Models of Indoor Environments.Procedings of the British Machine Vision Conference 2010pp. 45.1–45.11.
Yang, B. and Dong, Z., 2013. A shape-based segmentation method for mobile laser scanning point clouds. ISPRS Journal of Photogrammetry and Remote Sensing81, pp. 19–30.