COMPARISON OF TWO STRUCTURE AND MOTION STRATEGIES
R. Roncellaa*, C. Reb, G. Forlania
a
DICATeA, University of Parma, 43124 Parma (PR), Italy – riccardo.roncella@unipr.it b
CISAS, University of Padova, 35129 Padova (PD), Italy – cristina.re@studenti.unipr.it
Commission V, WG V/4
KEY WORDS: Orientation, Automation, Reconstruction, Close Range, Photogrammetry, Software, Comparison, Estimation
ABSTRACT:
Automatic orientation of image sequences in close range photogrammetry is becoming more and more important, not least to maintain a degree of competitiveness with other survey techniques, such as laser scanning. The objective of this paper is to compare two Structure from Motion (SFM) strategies. The previous strategy has been used at our Department for some years already in a wide range of projects and is based on the Harris operator and the fundamental matrix plus the trifocal tensor estimation to filter out the outliers. While it has in most cases performed satisfactorily, the percentage of accepted matches is generally smaller than expected; sometimes this leads to failure of the successful estimation of the trifocal tensor. The second one has only recently been implemented and is still under testing; it is based on the SURF operator and the 5-point relative orientation algorithm. The paper will show a comparison between the two strategies on a series of test cases.
1. INTRODUCTION
1.1 Paper outline and organization
From 2002 our research group at the University of Parma has been interested in automatic image orientation techniques; a robust Structure from Motion (SFM) software code, developed in Matlab by one of the authors, has been used since in various applications (Roncella et al., 2005; Forlani et al., 2005; Roncella et al., 2008).
Although the implementation was quite reliable as long as image acquisition was appropriately carried out, when addressing more complex image sequences, with large image base-length and more difficult image block geometries, the procedure sometimes failed; moreover, the computing times were always quite significant. To improve the performance and to robustify the approach, a new SFM strategy has been implemented in C#, improving both feature extraction and the rejection of false image points correspondences.
The aim of the paper is to compare these two strategies, highlighting their differences both from a theoretical and from an applicative/performance point of view. The strategies are developed using well known algorithms and techniques and presents basically the same features as many other SFM codes do; nevertheless from their comparison possible improvements and ideas for new algorithmic development in automatic image orientation can be derived.
Both strategies are structured in 3 stages:
1. Feature extraction and putative correspondences evaluation: using different interest operators, lists of distinct image features are extracted from the images; then, using different techniques, both strategies compile a list of possible matches between consecutive image pairs (at present both software can address only image sequences). 2. Outlier detection: imposing geometrical and radiometric constraints the lists of homologous points are filtered and gross correspondences errors are detected and removed; in particular, in both software the epipolar and
the trifocal constraint are applied to consecutive image pairs and image triplets.
3. Metric reconstruction and bundle adjustment: at the end of the process, using the initial solution estimated during the step 2, a least squares bundle adjustment is performed to assess an optimal (in terms of geometrical residuals) and global orientation solution.
The structure of the paper is as follows: in the next paragraph a short state of the art and literature review of automatic orientation techniques is presented; in section 2 the algorithmic details of the two strategies (and in particular those that are different in the two implementations) are described; the new strategy has been added to our orientation software (EyeDEA) that is briefly described in section 3. In section 4 a series of test cases in which both software were used for comparison is presented, to show the different level of performance of the new strategy with respect to the old one.
1.2 State of the art in Structure from Motion
It is not the objective of the paper to provide a comprehensive review of the state of the art in automatic image orientation. Nonetheless a brief excursus of some of the main techniques developed so far in automatic orientation is considered important to put the paper in a context.
At the beginning of the ‘90s, when the first digital cameras started to spread out, research in photogrammetry and in computer vision started to address the automation in image sequence orientation (Fitzibbon et al., 1998; Pollefeys et al., 2004). While the projective approach of Computer Vision (CV) puts less emphasis on accuracy and reliability of the results compared to photogrammetry, it provided linear mathematical models and algorithms that in many cases solve more easily and efficiently the problem of orientation. The integration of projective techniques with traditional photogrammetry offers a double advantage: it combines the high level of automation and independence from a priori information provided by the former with the rigorous stochastic geometric models of the latter. International Archives of the Photogrammetry, Remote Sensing and Spatial Information Sciences, Volume XXXVIII-5/W16, 2011
The maturity of these methodologies has been demonstrated by the fact that, albeit with some delay with respect to automatic aerial triangulation (TAA), some commercial software are beginning to implement such techniques (see e.g. Eos Systems, 2010). Almost daily, new applications are foreseen where image orientation automation is essential: for example image-based localization, augmented reality (Bres et al., 2009), applications over the web such as phototourism (Snavely et al., 2008). In many cases it’s not required to achieve an accurate metric reconstruction of the scene, while in others, usually related with photogrammetric surveys, precision is of the utmost importance. Close-range images are often characterized by convergence, presence of occlusions, variable overlapping between the images, large variations in image scale: this makes much more difficult, compared to aerial photogrammetry, the identification of tie points. Modern structure from motion techniques are able to target close-range sequences with a lot of images (Agarwal et al., 2009) and, properly used, lead also to satisfactory results for a metric survey.
Feature extraction and feature matching must meet several requirements: the points must be clearly distinct from the background (so that they can be found with high probability in other images of the sequence) and at the same time must be interest operator has to identify the same object point although seen under different conditions on the images, the descriptor must store all the information around the feature, hopefully allowing a correct identification of the homologous on the other images, even in presence of noise or other disturbances. In the first implementations of interest operators (Foerstner et al., 1987), (Harris et al., 1987) invariance to simple radiometric and geometric transformations was already imposed; on the other hand the associated descriptors were generally less elaborate and so a direct comparison of descriptor values between images was not feasible. The search was therefore carried out with other criteria, in particular the so-called SVD matching (Pilu, 1997), which today is losing importance due to low performance if compared to that of the new descriptors. Two of the most popular are the SIFT and the SURF operators. SIFT (Scale-Invariant Feature Transform) (Lowe, 2004) has become a standard in CV even if its formulation is quite complex and its application computationally expensive. SURF (Speeded Up Robust Features) (Bay et al., 2008) has invariance properties similar to SIFT, but requires less computing time. In both algorithms the descriptors are quite sophisticated; their values can therefore be directly compared to fill a preliminary list of matches. In (Jazayeri et al., 2008) a thorough review of the most important interest operators is given.
In most cases, regardless of the interest operator used, all strategies return a large number of matches, unfortunately affected by erroneous correspondences to some degree. In almost all SFM codes a robust method is then implemented to estimate a transformation between the two sets of coordinates that fulfils the epipolar constraint.
One of the most popular choices is the fundamental matrix F or the essential matrix E if the interior orientation is known (Hartley et al., 2000). In (Armangué et al., 2003) a survey of the main methods for the estimation of the fundamental matrix F is given. A widely used method to estimate the matrix E is the one proposed by (Nister, 2004), which requires only 5 homologous points.
The epipolar constraint cannot discriminate wrong pairs when the false match is located on the epipolar line: since the percentage of those pairs, especially in sequences that reproduce scenes with repetitive elements, can be substantial; is therefore important to identify and remove them. The trifocal tensor T (Hartley et al., 2000) can be used as a method to filter erroneous corresponding points in triplets of images. Since the tensor T constrains a set of homologous rays to intersect at a single point object, if they do not, it is deduced that the three image points are not homologous.
The tensor T, as the fundamental matrix, is expressed in a projective space and is estimated with robust methods from at least seven sets of homologous points.
Fundamental/Essential matrix and Trifocal tensor estimation requires a robust technique, capable of processing data with an error rate above 20%. The RANSAC algorithm (Fischler et al., 1981) has no theoretical limit to the percentage of errors that is able to detect, yet it requires to fix a priori a threshold for acceptance of the inlier.
The Least Median of Squares (Rousseuw et al., 1987) has a breakdown point of approximately 50% of the data but, unlike RANSAC, fixing an a priori threshold T is not required.
2. SFM STRATEGIES DESCRIPTION
2.1 The previous strategy
The first step in the previous strategy workflow is the extraction of interest points from the sequence using the Harris operator. We try to enforce a uniform distribution of points on the image, dividing the image frame in tiles and prescribing a minimum number of features to be extracted in each.
To compute a preliminary geometry of the cameras, we need a list of potential matches between image pairs of the sequence. This correspondence is established using the disparity and the similarity of the g.v. in a neighborhood: both information are combined in a SVD match (Pilu, 1997), a technique that guarantees a good global mapping using the three local criteria pointed out in (Marr et al., 1979) and in (Ullman, 1979). The method merges two weight matrices; the first measures the similarity of the g.v. using the normalized cross correlation coefficient between windows of proper dimension centered on each point pair; the second computes the mutual disparity (distance in row and column direction) between every pair of points. Using algebraic decomposition, the most probable matches are selected. After this stage the data set is still affected by a large amount of outliers.
To remove most errors from the set of correspondences in the image pair, we filter the data set by taking into account that points must satisfy some geometric constraints due to the cameras relative positions: first the epipolar geometry is estimated with a robust algorithm with RANSAC. The computing time is reduced by adaptively updating the outlier percentage at each iteration, based on the size of the consensus set as suggested in (Hartley et al., 2000). The algorithm starts considering a 99% of outlier presence and then updates the number of iterations required to ensure that at least one minimal data set is, with a given probability, outlier free (or better free from points not in agreement with the deterministic model imposed, i.e. the epipolar constraints). The epipolar geometry of an image pair is established through the fundamental matrix: therefore the interior orientation (usually known by camera calibration) is not enforced in the estimation process.
When a preliminary relative camera geometry has been established, we try to add more correspondences through a International Archives of the Photogrammetry, Remote Sensing and Spatial Information Sciences, Volume XXXVIII-5/W16, 2011
guided matching: for all putative point pairs that satisfy the estimated epipolar geometry, the similarity is measured by a threshold on the g.v. cross correlation. The final estimate for the fundamental matrix is computed from a least squares solution over all accepted matches.
Since the epipolar constraint cannot filter out all false matches the data set undergoes another, more restrictive, control: the three view geometry of consecutive images of the sequence is estimated through a robust algorithm, finding a more reliable camera reconstruction and getting rid of the remaining outliers. The tests we carried out and the results published in literature assure that a 99% probability of success in outlier elimination is reached. As in the previous stage, the trifocal tensor estimation does not force the interior orientation of the camera in the estimation process and defines a reconstruction geometrically valid up to a projective transformation.
Besides, since in our applications we use calibrated cameras, we estimate the metric frame of the reconstruction at the end of the structure from motion stage: finally, a bundle adjustment of all the observations leads to an optimal estimation of all the
In each sub-sequence the trifocal geometry among the first, last and middle frame is computed, with the rationale that these three images should have the best relative geometry. A metric reconstruction is performed through the essential matrix, yielding, by triangulation, the coordinates of the common set of points. Based on that, the exterior orientation parameters of the intermediate frames and the approximate coordinates of the remaining points along the sequence are computed by alternating resection and intersection with a linear algorithm and the unit quaternion (Sansò, 1973), (Quan et al., 1999). Finally, all sub-sequences are joined together using the points of the last image of the subsequence, which is also the first of the next sub-sequence. This propagates also the scale of the metric reconstruction along the whole sequence. Once the sequence is completed, a final l.s. bundle block adjustment with data snooping is performed using all images and including all available information on the object reference system.
2.2 The new strategy
The new strategy has modified the previous in two main stages: feature extraction and epipolar/trifocal geometry estimation. As far as feature extraction and putative correspondences estimation are concerned, the only difference is the use of the SURF operator and SURF feature descriptors. The SURF operator is partly derived from the SIFT detector and uses an integer approximation to the determinant of the Hessian, which can be computed very fast with integral images: while the SIFT operator is computationally very heavy, the SURF operator has a computational load comparable to that of the Harris operator. Moreover, its scale invariance properties should grant higher repeatability compared to Harris: the operator works at different image scales (i.e. the operator responses at different
resolution/scale are computed) allowing to identify the same object point even if pictured at different detail level in the image sequence. At the end of the feature extraction every point is associated with its SURF descriptor, a highly distinctive vector describing the gray value distribution (i.e. using a set of histograms of the gradient orientation) of the pixels surrounding the point itself; such vector is theoretically invariant to shift, scale and rotation and approximately invariant to illumination changes (at least if illumination conditions of the scene are not drastically modified). If two image features are similar their descriptor vectors should show similar values: computing the Euclidean distance between two vectors gives an estimation of the features resemblance. To select the corresponding features by comparing directly the values of the descriptors, an exhaustive search along the lists can be performed; the computational load can be very high, though, due to the large number of features usually extracted by the operator. It is more efficient to use approximate methods like the kd-tree (Beis et al., 1997), that are faster but still deliver extremely reliable results. The use of the SURF operator should return a higher number of reliable features with respect to the old Harris operator basically at no cost since the two algorithms have comparable computing time; moreover, a higher repeatability should be achieved (Mikolajczyk, 2003) thanks to its scale invariance, especially in sequences with wide base lengths or large perspective variation between the images.
As far as the epipolar geometry computation is concerned, rather than estimate the fundamental matrix, the 5-point calibrated relative orientation algorithm proposed by Nister (2004) has been implemented. Compared to the fundamental matrix, it offers a more straightforward approach that exploits the fact that in practice, in all photogrammetric surveys, the interior orientation elements (as well as image distortion parameters) are known.
The interior orientation is implicitly forced into the estimation using normalized image coordinates and obtaining directly the essential matrix. The mathematical model is more complex (it uses a 10th degree polynomial instead of the 3rd degree one for the fundamental matrix estimation); nonetheless, since it uses a more correct deterministic model, the estimation with the RANSAC algorithm achieves a higher inlier percentage: being the iterations dependent on the inlier percentage, the method is computationally more efficient than the old one.
Using RANSAC in a robust estimation scheme, the size of the minimal set (i.e. the mathematical model) influences the computational load; with the same inlier/outlier ratio, much fewer iterations are required with a simpler deterministic model to ensure that at least one estimation set is outlier free. With the fundamental matrix a minimum of 7 points is required to estimate the epipolar geometry: in this case it is usually preferable to use such minimal set even if it leads to a 3rd degree polynomial with up to three real solutions, all to be tested to find which one gives the highest inlier count. Using the 8 point algorithm ensure that just one solution is computed and tested against the data set but, especially with high outlier percentages, the number of RANSAC iterations required become hard to handle (e.g. with 50% of outliers the iterations double). On the other hand the Nister approach (i.e. estimating the epipolar geometry through the essential matrix knowing the interior orientation parameters) leads to a 10th degree polynomial using just 5 point: the polynomial can have up to ten real solutions (usually on average 4÷5 real solutions show up); thus it’s preferable, we think, to use another point in the minimal set (even if this means more RANSAC iterations), rather than check every real solution against the whole data set.
As already said the more complex mathematics involved in the essential matrix estimation is computationally balanced by much less iterations required in RANSAC; at the same time, in our early tests with the new algorithm an higher average inlier percentage is found: perhaps the a priori knowledge of the interior orientation parameters makes the estimation more robust and stable numerically. The actual reason for this fact is still under investigation and could be “case dependent” to some extent.
Since early results are really encouraging we decided also to enforce the interior orientation during the three view geometry estimation. In this case it’s much harder to implement the interior orientation parameters inside the trifocal tensor estimation: as shown in (Hartley et al., 2001) the trifocal tensor, in its un-calibrated form, must satisfy 8 independent algebraic constraints to be geometrically valid; enforcing those constraints is algorithmically complex and thus, usually, more tricky ways of solving the tensor estimation (e.g. using the Carlsson-Weinshall duality) must be considered. Impose also the interior orientation in the estimation can be particularly hard. Instead of using the trifocal tensor a RANSAC bundle block adjustment using just three images is used: six points are extracted randomly from the correspondences filtered out in the previous stages and the relative orientations parameters between a reference image and each of the two others images are computed; using the 6 points the three images are referred to the same object space; then, fixing the orientation parameters, all the other point correspondences are triangulated and image projection residuals are computed: all the points with a mean projection residual lower than a specified threshold are considered inlier. Maybe it can be less time consuming a strategy where the orientation parameters computed from the essential matrix stage are directly used: in this case the outlier can be filtered during the object space referencing of the triplets.
Since usually the outlier removal performed in the epipolar stages are quite correct, the calibrated trifocal estimation seems not to outperform the old algorithm in terms of goodness of final results; nonetheless, from our early comparison tests, it seems to provide higher computational speed (just few iteration are needed during the RANSAC stage) and better stability. At the same time it provides already a metric reconstruction of the triplets that can be easily concatenated afterwards. The use of a guided trifocal matching at the end of the RANSAC stage can also be performed even if, usually, at this stage basically all wrong correspondences are removed and its use doesn’t improve further the solution. Anyway such matching can be executed re-estimating the bundle block system using all the inliers and evaluating if the new solution improves the number and goodness of fit of the inliers: in case the procedure is iterated until convergence is reached.
3. EYEDEA – A GRAPHICAL USER INTERFACE FOR STRUCTURE FROM MOTION
The new Structure from Motion implementation performs much better compared to the old one: it can handle sequences that the previous one hardly managed, delivers more tie points, it’s more robust and accurate. Nonetheless, we think that a graphical user interface (GUI) that allows the user to step into the process and solve the problems that might occur in particularly troublesome sequences or just to check the solution from the SFM code is needed.
A software named EyeDEA has been developed in the last year at DICATeA to this end: the GUI allows the user to measure Moreover, EyeDEA implements post-processing code to optimize the results obtained in the SFM step. Two optimizations are considered important in the context of this paper: the first address the problem that often (especially if the SURF operator is used) the SFM ends with too many tie points extracted, making the bundle block orientation hardly manageable (e.g. in one of the case study in section 4, more than 1.5 million object points have been extracted); at the same time a large system does not necessarily mean a more precise orientation solution: the key to better results are the image coverage (i.e. the image points should be well distributed on all the frame area) and the tie point multiplicity (i.e. how many rays converge on the same object point). The optimization software, thus, aims to reduce the number of points to a goal value dramatically the computation of the orientation solution. On the other hand, sometimes, the SFM code cannot track corresponding points in all the images they appear: for instance if you have overlapping strips covering the object (as in aerial photogrammetric blocks) our implementation currently tracks the point only along the strip but don’t recognize corresponding points from one strip and the adjacent ones. To improve point redundancy and tie together different sections of the image sequence, a Least Squares Guided Matching (LSM) (Gruen, 1984) can therefore optionally be performed: all object points are re-projected to all the images of the sequence to provide approximate image point position for the LSM; for every object point, the image with the better viewing angle to the point is set as reference and the LSM is performed with all the images of the block that might view the point. To this aim, the normal to the approximate object surface obtained from all the object points is computed and the image with smallest angle between the optical axis and the surface normal is chosen; otherwise, the one with the image point closest to the frame centre is selected. In the following sections, since the aim of the paper is to show a performance comparison of the two implemented SFM strategies, this post-processing optimization has been skipped.
4. STRATEGIES COMPARISON: FIVE CASE STUDIES
To show the main performance differences between the two strategies and their impact in applications, five case studies will be presented.
In the first two sequences both the new and old strategies managed to correctly orient all the images. In the other three cases larger-than-usual base-lengths, abrupt depth changes and scale variations made automatic orientation more challenging; here the old algorithm cannot orient the whole sequence because errors occur in the trifocal tensor estimation, while the new one successfully completed the orientation.
4.1 Marbrees sequence
The Aiguilles Marbrées is a granitic peak of 3535 m of elevation in the Mont Blanc massif in Northwest Italy (Figure 1). The study area is located in the lower part of the North face, characterized by a mean steepness of about 70° and a mean aspect of about 320N. Periodic photogrammetric surveys took place during Summer 2009 and Summer 2010 with a full-format Nikon D700 (4256x2832 pixels) digital camera with calibrated 20 mm lens. The first survey was georeferenced with the so-called photo-GPS technique (Forlani et al., 2007), where stop
and go GPS measures of the camera positions and
photogrammetric observations are adjusted together. Control points for the next surveys were derived selecting the tie points with the best precision in the first block adjustment.
Figure 1. The Marbrees peak in Mont Blanc massif: an image of the sequence.
A 3D Digital Surface Model (DSM) of the rock face was produced by image correlation at each survey epoch: the first model has been used as “zero reference” to compare further surveys and to detect rock falls; the model has been studied to detect which rock discontinuity sets caused a rockfall in Sept. 2007 as well as to determine the volume of the fallen block. The results shown below refer to the sequence of July 2010, composed of 15 images acquired following an approximately circular path (see figure 2) at a distance of ca. 55÷60 meters from the rock face.
Figure 2. The Marbrees sequence. Left: the image block geometry. Right: the DSM of the rock-mass.
As you can see in Table 3 both strategies achieve very good results: the old one with the Harris operator gets much less points but on average shows basically the same block statistics of the new implementation: the results obtainable in the two blocks are presumptively the same.
Old Strategy New Strategy
Points Per Photo
Min 128 421
Max 408 1710
Avg 293 1179
Photo Coverage (%Area)
Min 61 66
Max 92 91
Avg 83 84
Angle Intersection
Min 7 7
Max 89 89
Avg 25 30
Rays Per 3D Point
Min 3 3
Max 15 11
Avg 4 4
Table 3. Comparison summary of the Marbrees sequence.
4.2 Seahorse sequence
The Seahorse (see the textured DSM in Figure 4) is a fossil of small size (10 cm x 4 cm) surveyed at the Grant Museum of Zoology of the University College of London during Summer 2010. A Nikon D700 (4357x2899 pixels) digital camera with calibrated 38 mm lens has been used. Control points were derived from the survey of a paper board where 14 targets have been applied.
Figure 4. Seahorse textured DSM.
Old Strategy New Strategy
Points Per Photo
Min 79 443
Max 79 443
Avg 79 443
Photo Coverage (%Area)
Min 40 38
Max 44 42
Avg 41 39
Angle Intersection
Min 16 16
Max 19 20
Avg 17 18
Rays Per 3D Point
Min 3 3
Max 3 3
Avg 3 3
Table 5. Comparison summary of the Seahorse sequence.
The sequence is composed of 18 images (15 acquired following a circular path with a convergent attitude and 3 acquired from nadir) at an average distance of ca. 30 cm from the object. Only the sequence with nadir attitude has been used for the comparison since the test wants to highlight implementation differences in simple cases: if all 18 images are used, during the trifocal tensor estimation the old code hardly manage to obtain successful results.
As you can see in Table 5 in this case the two algorithms basically show the same behaviour except for the number of extracted points: the new SURF operator gets more than 5 times the amount of points extracted by Harris: image frame coverage and angle intersection between homologous ray are the same and the orientation solution is essentially identical. Nonetheless, since the aim of the image block in this case is to produce a DSM of the seahorse, the more seed-point for initializing the dense matching procedure the better the final results: due to highly reflective surfaces the seahorse is particularly hard to be reconstructed by means of photogrammetric techniques and having a reliable initial approximation of the object surface is of primary importance. To obtain the result depicted in figure 3 the old algorithm must be coupled with a densification procedure once the orientation solution has been calculated, while the results of the new algorithm can be used immediately after the block adjustment.
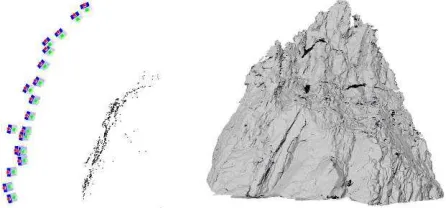
4.3 Canopic Jar Lid sequence
The Canopic Jar Lid is an ancient object dating back to Egyptian period stored at the Petrie Museum of the University College of London. This object, made of stone, is ca. 20 cm x 20 cm x 20 cm. The digital camera is the same used for the Seahorse. In figure 6-left the block geometry is shown: the sequence follows a spiral path around the Canopic Jar lid moving on an imaginary spherical surface centred on the object. The sequence considered here has been stopped right after the end of the first revolution because, even in the epipolar estimation, the old strategy begun to show errors.
Figure 6. The Canopic Jar Lid sequence. Left: the image block geometry. Right: the DSM.
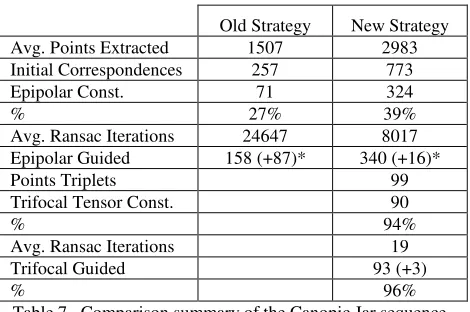
Old Strategy New Strategy
Avg. Points Extracted 1507 2983
Initial Correspondences 257 773
Epipolar Const. 71 324
% 27% 39%
Avg. Ransac Iterations 24647 8017 Epipolar Guided 158 (+87)* 340 (+16)*
Points Triplets 99
Trifocal Tensor Const. 90
% 94%
Avg. Ransac Iterations 19
Trifocal Guided 93 (+3)
% 96%
Table 7. Comparison summary of the Canopic Jar sequence.
From table 7 some considerations can be outlined: the new strategy, as in the previous case studies, is capable to extract more interest points (2x ratio) and the use of SURF descriptors leads to a higher number of putative correspondences (3x ratio); in addition the use of the new essential matrix filtering of initial
correspondences boost further the number of accepted correspondences (ca. 4x ratio); during the epipolar guided matching, using the old strategy, the number of correspondences grows dramatically*, while in the new implementation the increase is negligible: in the old implementation the guided matching was performed on the whole initial set of extracted points, while in the new one the procedure is performed only on the descriptor filtered list; the results suggest to skip this processing step if computational speed is important. As far as trifocal filtering is concerned the old strategy starts to show its lack of robustness: basically after the first image triplet the algorithm stops to work properly due to the wide base-length between the images and the scarcity of points triplets available. The new strategy, on the contrary, manage to reach the end of the sequence without any problem. It’s worth noting that even if the epipolar constraint removes a lot of inliers, at the end of the trifocal filtering stage at least 4% of the computed triplets must be discarded: even if not crucial for the success of the orientation procedure, the use of the trifocal constraint can improve significantly the quality of the final result.
4.4 Castle sequence
The castle sequence is one of the common datasets proposed for the 3d Arch conference special session on automated image orientation (Strecha et al., 2008). The sequence runs around the whole inner courtyard of the Ettlingen castle framing the opposite building façades. Images were taken with a digital camera (resolution 3072x2048 pixel, pixel size 11.7 micrometres) with a 35 mm lens.
The first part of the sequence returns a higher number of points with respect to the second part: the reason is that the first eleven images look to the façade that has a better texture (Figure 8) and therefore many features and better features for the interest operator. Furthermore between some images of the sequence the scene perspective changes abruptly making the identification of homologous points and their filtering much more difficult: if these images are put at the beginning of the sequence the old algorithm cannot solve the trifocal filtering stage as in the previous example.
Figure 8. DSM of one of the façade of the inner courtyard of the Ettlingen castle.
As shown in table 9, even if the new implementation produce at least 3x initial correspondences and the essential matrix constraint (more stable) gets a higher inlier percentage, at the
*
Note that the number in brackets reported in table refers to the correspondences increment
end of the epipolar guided matching the old strategy has a comparable number of good correspondences. It’s interesting to note that, despite this, the new trifocal constraint implementation is much more robust since in the old strategy the stage cannot be completed satisfactorily.
Old Strategy New Strategy
Avg. Points Extracted 2320 6930
Initial Correspondences 479 1539
Epipolar Const. 177 912
% 37% 55%
Avg. Ransac Iterations 5332 434
Epipolar Guided 754 (+577) 961 (+49)
Points Triplets 269
Trifocal Tensor Const. 272
% 89%
Avg. Ransac Iterations 53
Trifocal Guided 275
% 91%
Table 9. Comparison summary of the Castle sequence.
4.5 Tassullo cave sequence
Our research group has been recently involved in the experimental development of an automated tool to assess and document successive steps in underground mining operations: the system should work in extreme conditions and should not interfere with the excavation operations. In this case, the survey covered a stretch of tunnel about 130 m long. To limit the time required to take the pictures a device mounted on a tripod was built, which allows to quickly rotate the camera to pre-set angles, determined to ensure the desired side overlap between the strips. The device (figure 10) is positioned in the vertical plane of symmetry of the tunnel, with its axis of rotation horizontal; for each station 6 images are taken; then the tripod is moved to the next station. We thus form six longitudinal strips, with approximately 80% longitudinal overlap, and about 20% sidelap. For the tunnel section surveyed, each was composed of about 110 images, for a total of 660 frames.
Figure 10. Block geometry of the mining system.
After 33 stations, the opening of a side tunnel breaks the continuity of the rock wall on the lower left strip: as can be clearly seen in figure 11, illumination conditions change dramatically and sudden variation in object depth arise. While the new strategy could manage (thanks to the SURF operator/descriptor) quite easily such problems, the old one stopped.
Figure 1. Consecutive images of the Tassullo cave sequence.
There is no point in showing the comparison summary of the sequence (as done in the previous case studies): due to the high overlap between consecutive images and thanks to the high regularity in the block geometry and very good image texture both strategies, as far as tunnel sections without the apertures are considered, reach very good results: more than 1.5 million object points are extracted; the epipolar constraint on average finds 89% inliers in the putative correspondences set, showing that in this case the SURF descriptor does a great job. What really distinguish the new implementation from the old, in this case, is therefore its robustness.
5. CONCLUSIONS
The paper presented a comparison between two structure and motion strategies: the first, implemented some years ago, uses the Harris operator and the uncalibrated Fundamental matrix/Trifocal Tensor estimation, while the second implements the SURF operator/descriptor and enforces the interior orientation parameters during the epipolar and trifocal geometry estimation. As long as simple sequences are considered (i.e. small base-lengths, no sudden variations in illumination and/or scene perspective, good object texture quality, etc.) both strategies perform very well, the only difference being a higher point count obtained by the new one, that can speed up the subsequent photogrammetric stages (e.g. DSM production). It has been shown that, when such conditions aren’t met, the old strategy becomes less efficient: in three difficult cases the trifocal constraint could not be successfully imposed for some triplet of the sequence. In those circumstances the new algorithm outperforms its predecessor obtaining good results. Probably the most important change between the two strategies is represented by the adoption of the SURF operator/descriptor that can address sequences where considerable variations in image scale upraise. The new calibrated version of the epipolar/trifocal filtering stage is much more numerically stable with respect to the old, uncalibrated one, and achieves a higher score in inlier identification. Regardless of the efficiency of new interest point operators/descriptors, this stage is still the most critical to ensure good final results and the algorithms it uses must always be carefully designed to ensure a successful block orientation.
AKNOWLEDGMENTS
The authors wish to thank Prof. Stuart Robson, his team and the UCL museums personnel who tutored Cristina Re during the experimentation phase and provided the objects for the sequences Seahorse and Canopic Jar Lid, and the Spinner Consortium who gave financial support for her stay in London. The authors wish also to thank Fondazione Montagna Sicura that provided the Marbrees sequence and Tassullo Materiali S.p.A. who provided the Cave sequence.
REFERENCES
Agarwal, S., Snavely, N., Simon, I., Seitz, S.M., Szelinski, R., 2009. Building Rome in a day. In: Proc. of ICCV 2009, Kyoto, Giappone, 8 pp.
Armangué, X., Salvi, J., 2003. Overall view regarding fundamental matrix estimation. Image Vision Comput., 21: 205-220.
Bay, H., Ess, A., Tuytelaars, T., Van Gool, L., 2008. SURF: Speeded Up Robust Features. Computer Vision and Image Understanding (CVIU), Vol. 110, No. 3, pp. 346—359.
Beis, J.S., Lowe, D.G., 1997. Shape indexing using approximate nearest-neighbour search in high-dimensional spaces. In: Proc.of CVPR 1997, pp. 1000-1006.
Bres, S., Tellez, B., 2009. Localisation and augmented reality for mobile applications in Cultural Heritage. IAPRS&SIS, 38(5/W1), 5 pp.
Eos System Inc., 2011. Photomodeler 2011 website, Vancouver, Canada. http://www.photomodeler.com (accessed 2 Feb. 2011).
Fischler M., Bolles R., 1981. Random sample consensus: a paradigm for model fitting with application to image analysis and automated cartography. In: Commun. Assoc. Comp. Mach., Vol. 24:3, pp. 81-95.
Fitzgibbon, A, Zisserman, A., 1998. Automatic 3D model acquisition and generation of new images from video sequence. Proc. ECCV, pp. 1261-1269.
Forlani, G., Pinto, L., 2007. GPS-assisted adjustment of terrestrial blocks. In: Proc. of the 5th Int. Symp. on Mobile Mapping Technology (MMT’07). Padova, ISSN 1682-1777, CD-ROM, pp1-7.
Forlani, G., Roncella, R., Remondino, F., 2005. Structure and Motion Reconstruction of Short Mobile Mapping Image Sequences. In: Optical 3-D Measurement Techniques VII. Vienna, Austria. Vol. 1, pp. 265-274. ISBN/ISSN: 3-9501492-2-8
Förstner, W. and Gülch, E. 1987, A fast operator for detection and precise location of distinct points, corners and centres of circular features. ISPRS Conference on Fast Processing of Photogrammetric Data, Interlaken. Switzerland, pp. 281-305.
Grün, A., 1985. Adaptative least squares correlations: a powerful matching techniques. South African J. Photogramm. Remote Sensing and Cartography, 14(3): 175-187.
Harris C., Stephens M., 1987. A combined corner and edge detector. In: Proceedings of the Alvey Conference, pp. 189-192.
Hartley, R., Zisserman, A., 2000. Multiple View Geometry in computer vision. Cambridge University Press, Cambridge, pp. 1-496.
Jazayeri, I., Fraser, C., 2008. Interest operators in close-range object reconstruction. IAPRS&SIS, 37(WG-V/1): 69-74.
Lowe, D. G., 2004. Distinctive Image Features from Scale-Invariant Keypoints, International Journal of Computer Vision, vol. 60, No. 2, pp. 91-110.
Marr, D., Poggio T., 1979. A computational theory of human stereo vision. In: Proc. Royal Society London, B 204:301-328.
Mikolajczyk, K., Schmid, C., 2003. A performance evaluation of local descriptors. IEEE Computer Society Conference on Computer Vision and Pattern Recognition – vol. 2.
Nister, D., 2004. An efficient solution to the five-point relative pose problem. IEEE T, Pattern Anal., 26(6): 756-770.
Pilu, M., 1997. A direct method for Stereo Correspondence based on Singular Value Decomposition. In: IEEE International Conference of Computer Vision and Pattern Recognition, Puerto Rico, June 1997
Pollefeys, M., Van Gool, L., Vergauwen, M., Verbiest, F., Cornelis, K., Tops, J., Kock, R., 2004. Visual modelling with a hand-held camera. Int. J. Comput. Vision, 59(3): 207–232.
Quan, L., Lan, Z., 1999. Linear N-Point Camera Pose Determination in IEEE Transactions on Pattern Analysis and Machine Intelligence vol. 21, No. 8, August
Roncella, R., 2007. Ricerche di Geomatica. Sviluppo e Applicazioni di Tecniche di Automazione in Fotogrammetria dei Vicini. SIFET, Mestre (VE), Italy, pp. 119-128. ISBN: 8-8901939-3-X.
Roncella, R., Forlani, G., 2005. An Automatic Image Technique for Rock Stability Analysis. In: Workshop Italy-Canada "3D Digital Imaging and Modeling: Applications of Heritage, Industry, Medicine and Land". Padova, Italy.
Roncella, R., Zerbi, A., 2008 The Topographic and Photogrammetric Survey as 3D Knowledge Instrument: the Case of Three Historical Buildings in the Ancient Damascus Citadel, Syria Digital Media and its Applications in Cultural Heritage Amman, Jordan: CSAAR Press, vol. 1, p. 531-544, ISBN/ISSN: 978-9957-8602-5-7.
Rousseeuw, P.J., Leroy, A.M.,1987. Robust Regression and Outlier Detection. John Wiley, New York (USA), 352 pp.
Sansò, F., 1973. An exact solution of the roto-translation problem. In: Photogrammetria 29:203–216.
Snavely, N., Seitz, S.M., Szeliski, R., 2008. Modelling the world from internet photo collections. Int. J. Comput. Vision, 80(2): 189-210.
Strecha, C., von Hansen, W., Van Gool, L., Fua, P., Thoennessen, U., 2008. On Benchmarking Camera Calibration and Multi-View Stereo for High Resolution Imagery. In: 2008 IEEE Conference on Computer Vision and Pattern Recognition.
Ullman, S., 1979. The interpretation of Visual Motion. MIT Press, Cambridge, MA.