PRIMITIVE-BASED 3D BUILDING RECONSTRUCTION METHOD TESTED BY
REFERENCE AIRBORNE DATA
W. Zhang a,*, Y. Chen a, K. Yan a, G. Yan a, G. Zhou b a
State Key Laboratory of Remote Sensing Science, Beijing Key Laboratory of Envorionmental Remote Sensing and
Digital City, School of Geography, Beijing Normal University, 100875 Beijing, China - (wumingz, cym_bnu,
201121170050, gjyan)@bnu.edu.cn
bGuangXi Key Laboratory for Spatial Information and Geomatics, Guilin University of Technology, 541004 Guilin,
China, – (zgq) @glite.edu.cn
Commission III, WG III/4
KEY WORDS: Building Reconstruction, LiDAR, Optical Imagery, Primitive-based, Accuracy Evaluation
ABSTRACT:
Airborne LiDAR data and optical imagery are two datasets used for 3D building reconstruction. By study of the complementarities of these two datasets, we proposed a primitive-based 3D building reconstruction method, which can use LiDAR data and optical imagery at the same time. The proposed method comprises following steps: (1) recognize primitives from LiDAR point cloud and roughly measure primitives’ parameters as initial values, and (2) select primitives’ features on the imagery, and (3) optimize primitives’ parameters by the constraints of LiDAR point cloud and imagery, and (4) represent 3D building model by these optimized primitives. Compared with other model-based or CSG-based methods, the proposed method has some advantages. It is simpler, because it only uses the most straightforward features, i.e. planes of LiDAR point cloud and points of optical imagery. And it can tightly integrate LiDAR point cloud and optical imagery, that is to say, all primitives’ parameters are optimized with all constraints in one step. Recently, an ISPRS Test Project on Urban Classification and 3D Building Reconstruction was launched, two datasets both with airborne LiDAR data and images are provided. The proposed method was applied to Area 3 of Dataset 1 Vaihingen, in which there are some buildings with plane roofs or gable roofs. The organizer of this test project evaluated the submitted reconstructed 3D model using reference data. The result shows the feasibility of the proposed 3D building reconstruction method.
* Corresponding author.
1. INTRODUCTION
3D reconstruction of buildings is an important approach to obtain the 3D structure information of buildings, and has been widely used in the applications of telecommunication, urban planning, environmental simulation, cartography, tourism, and mobile navigation systems. It has been the major topic of photogrammetry, remote sensing, computer vision, pattern recognition, surveying and mapping. Traditionally, photogrammetry is the primary approach for deriving geo-spatial information through the use of multiple optical images. Optical imagery has sharp and clear edges, so the 3D information derived from photogrammetric measurements consists of accurate metric and rich descriptive object information (Mikhail et al., 2001). But it is hard to obtain dense 3D points on the building’s surface because of the matching problem at the homogeneous or occluded places. Also because of matching problem, it is hard to generate 3D building model automatically by photogrammetry (Schenk and Csatho, 2002).
Since it was introduced in the 1980s, as a promising method, Light Detection And Ranging (LiDAR) technology is used in the applications of acquiring digital elevation data. Because LiDAR technology is fully automated for generating digital elevation data, many researchers have paid attention to the
technology and its applications (Arefi, 2009; Mayer et al., 2008; Rottensteiner and Briese, 2002). Although LiDAR point cloud has dense 3D points, these points are irregularly spaced, and don’t have accurate information regarding breaklines such as building boundaries. Thus, the reconstructed 3D building’s model is not very accurate (the accuracy depends on the points density), not only the shape but also the position of the building. Obviously, to generate a more accurate 3D building model using LiDAR point cloud, the help of other datasets with accurate boundaries is necessary.
Using airborne LiDAR data and optical imagery, we proposed a primitive-based 3D building reconstruction method to overcome the problems mentioned above (Zhang et al., 2011). Two datasets are tightly integrated, and the accurate 3D building model can be acquired by the straightforward and simple features. Recently, an ISPRS Test Project on Urban Classification and 3D Building Reconstruction was launched, two datasets both with airborne LiDAR data and images are provided. The proposed method was applied to Area 3 of Dataset 1 Vaihingen, in which there are some buildings with plane roofs or gable roofs. The organizer of this test project evaluated the submitted reconstructed 3D model using reference data (Rutzinger et al., 2009). The result shows the feasibility of the proposed 3D building reconstruction method.
The organization of this paper is as follows. In section 2, the proposed primitive-based method is described in detail, including motivation, workflow, and explanation of some crucial steps. In section 3, first is the description of test data, followed by evaluating result and some discussions. Finally, we draw the conclusion and identify the work of near future.
2. METHODOLOGY
2.1 Selection of Reconstruction Method and Features
In this section, two crucial points will be explained, i.e., the selection of method and features for building 3D reconstruction.
There are two reasons for the selection of primitive-based method to reconstruct 3D building model.
Firstly, LiDAR point cloud has dense 3D points, but these points are irregularly spaced, and don’t have accurate information regarding breaklines such as building boundaries. On the contrary, optical imagery has sharp and clear edges, but it is hard to obtain dense 3D points on the building’s surface. In order to reconstruct 3D building model by integration of LiDAR point cloud and optical imagery, the selected object must have clear edges and dense surface points at the same time. Obviously, primitives, for example, box, gable-roof and hip-roof can satisfy this requirement. Suitable primitives will “glue” LiDAR point cloud and optical imagery.
Secondly, from the point view of computation, primitive-based representation of 3D building model has less parameters. For example, to represent a box, 3 parameters (width, length and height) are used to represent the shape; together with 3 parameters for position and 3 parameters for orientation, totally 9 parameters are enough to determine the shape and locate the box in 3D space. So the solution can be calculated easily and robustly.
For the selection of features, it is crucial because it affects the complexity of the process and the accuracy of the reconstructed 3D building model. As we have seen, LiDAR point cloud and optical imagery have different characteristics, so different features will be selected for these two datasets. The features should be as straightforward and simple as possible, so that they can be easily located and accurately measured. Plane is the feature that we selected for LiDAR point cloud, and corner is the feature that we selected for optical imagery. Using these straightforward and simple features, the computational
procedure is simplified, and the result can be obtained precisely and robustly.
Because of above reasons, we select primitive-based method to reconstruct 3D building model, and plane feature for LiDAR point cloud and corner feature for optical imagery.
2.2 Hip-roof Primitive
As mentioned above, the main roof types in test area are plane roofs and gable roofs. These two types of roofs can be regarded as the simplification of hip-roof. The hip-roof primitive used in this paper is shown in Fig. 1. The coordinates framework and the parameters are labelled. It can be seen that 6 parameters are used to define the shape of this hip-roof primitive. Further more, another 6 parameters define how a primitive is placed in 3D space, 3 for position and 3 for orientation.
Figure 1. Hip-roof primitive
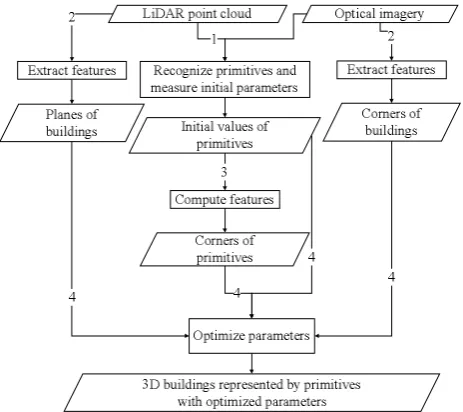
2.3 Workflow
Figure 2. Flowchart of the proposed method
1. Recognize primitives and measure initial parameters. With the help of optical imagery and
LiDAR point cloud, the building is decomposed into several primitives. Then the primitive’s parameters are measured roughly on LiDAR point cloud and optical imagery, such as length, width, height, orientation and translation of the primitive. These measurements can be used as fixed values (constraints) or initial values in the following optimization procedure.
2. Extract features. Corners are detected/selected on
the optical imagery, and planes are detected/selected in the LiDAR point cloud. These features will be used as observed values/observations in the following optimization procedure.
3. Compute features. Based on the type and parameters of primitives, the 3D coordinates of the primitives’ features, such as corners, can be calculated. They will be used as model/computed values in the following optimization procedure. 4. Optimize parameters. When a 3D building model
has correct shape and is located in the correct place in 3D space, two conditions will be satisfied. Firstly, the back-projections of primitive’s vertexes (computed features) on the optical image should perfectly superpose on the measured corners (extracted features). Secondly, the primitive’s vertexes should be exactly on the planes which are formed by LiDAR point cloud. These two conditions can be expressed respectively by Collinearity Equation and 3D Plane Equation, and then a cost function can be established using these two mathematical models. The inputs of this cost function are observed values, model values, and initial values above. When the optimization procedure is finished, the optimized/refined primitives’ parameters will be outputted.
Finally, 3D building can be represented by these primitives with the optimized parameters.
The proposed method was applied to a dataset of an ISPRS test project. The organizer of this test project evaluated the submitted reconstructed 3D model using reference data. In the next section, first is the description of test data, followed by the introduction of data processing, finally evaluating result is analyzed and discussed.
3. EXPERIMENTAL RESULT AND DISCUSSION
3.1 Description of Data Set
The test data set was captured over Vaihingen in Germany. The data set is a subset of the data used for the test of digital aerial cameras carried out by the German Association of Photogrammetry and Remote Sensing (DGPF) (Cramer, 2010). The ground resolution of the digital aerial images is 8 cm. The Vaihingen test data set provided by DGPF also contains Airborne Laserscanner (ALS) data. The entire DGPF data set consists of 10 ALS strips. Inside an individual strip the average point density is 4 pts/m2 (Haala et al., 2010).
The test data consists of three test areas for which reference data for various object classes are available (Spreckels et al., 2010). In this paper, Area 3 “Residential Area” was selected; it is a purely residential area with small detached houses. Most of buildings in this area can be represented by hip-roof primitive. Fig. 3 shows the digital image of this test area.
Figure 3. Digital image of the test area
3.2 Task and Data Processing
This ISPRS Test Project has two tasks, Urban Classification and 3D Building Reconstruction. The task of this paper is the latter. The goal of this task is to derive a complete, correct, and accurate segmentation of the roof planes in the provided data. The detailed 3D models of the building roofs in the test areas should be generated. The level of detail should correspond to LoD2 of the CityGML standard.
The workflow of Fig. 2 was applied to the test data to generate 3D building models. It should be noted, at current stage, some works were done in interactive mode. Both building’s corners in images and building’s planes in point cloud were manually extracted.
3.3 Experimental Result
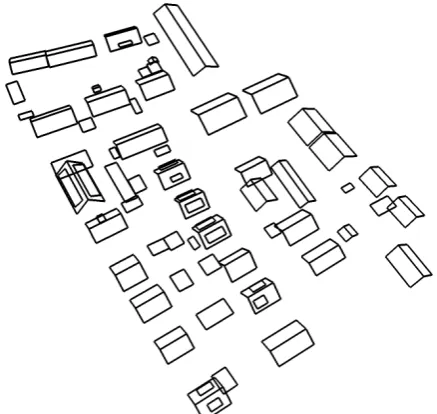
DXF files containing closed 3D polygons corresponding to the boundaries of the reconstructed roof planes in the object coordinate system given by the respective test area. Although the proposed method generated 3D building models, only building roofs were included in submitted DXF file and shown in Fig. 4.
Figure 4. Reconstructed 3D building roofs
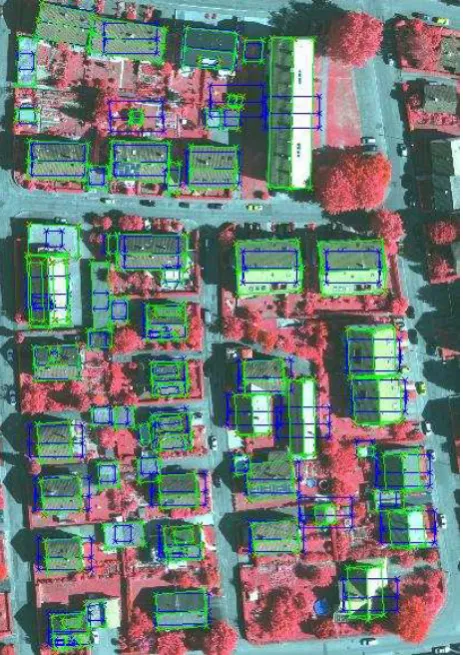
Both initial models and optimized models were back-projected to the image as wireframes, which are shown in Fig. 5. Blue wireframes are back-projections of initial models and green wireframes are back-projections of optimized models. It shows an advantage of our method. Although some initial models obviously deviate from the true shapes and places, after optimization they can be corrected and fit the true buildings well. The comparison of whole test area is shown in Fig. 1.
Figure 5. Wireframes of initial models and optimized models
3.4 Evaluating Result and Discussion
The reference for Vaihingen was generated by photogrammetric plotting carried out by the SIRADEL company in France (www.siradel.com), following the guidelines used by RAG in Area 1 (Spreckels et al., 2010). The feedback of ISPRS Test Project is a text file containing the evaluation results. The evaluation consists of an analysis of the quality of the segmentation and an analysis of the geometrical errors of the submitted models compared with reference. Because currently primitive’s types and initial parameters are not decided in an automated way, and the key feature of the proposed reconstruction method is the ability to compute optimized primitives’ parameters, so we concentrated more on geometrical accuracy. The evaluation of geometrical accuracy part of the report file is listed in Tab. 1. The geometrical error is evaluated by determining the RMS errors of building roof vertices (only for roof planes correctly segmented) and of an overall analysis of the height differences between the submitted models and the reference.
Evaluation of Geometrical Accuracy:
Distance threshold: 3.0 [m]
Total RMS of extracted boundaries:
0.80 [m] (determined from 840 of 913 possible correspondences)
Total RMS of centres of gravity of extracted objects (X / Y):
0.49 [m] / 0.56 [m] (determined from 109 of 133 possible correspondences) Total RMS of reference
boundaries:
0.44 [m] (determined from 505 of 816 possible correspondences) Total RMS of centres of
gravity of reference objects (X / Y):
0.90 [m] / 0.92 [m] (determined from 142 of 183 possible correspondences) Height errors:
Total RMS of height differences between planes:
0.39 m
RMS of height differences between planes found to correspond:
0.22 m
Table 1. Evaluation of geometrical accuracy in the report file
And a few images that visualize these results are also provided. Two of these images are shown below.
Fig. 6 is the evaluation of building detection on a per-pixel level. In this figure, yellow means correct roofs, and blue means missed roofs, and red areas is the background but reconstructed as roofs by mistake.
Figure 6. Evaluation of building detection on a per-pixel level
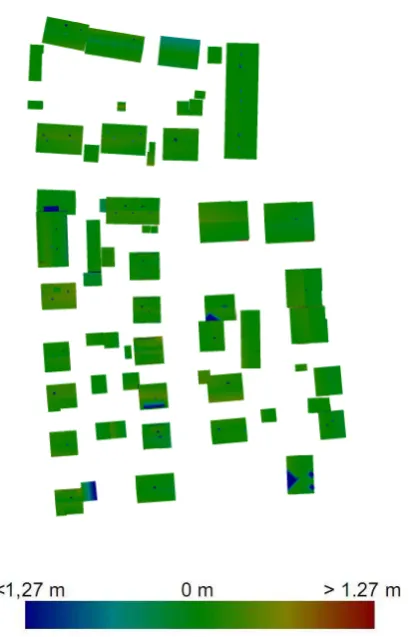
Figure 7. DSM difference between reference and result
The observations from these two images and explanations are listed below.
a. The reconstructed roofs fit reference roofs well. We reach
this conclusion because of regular yellow rectangles in Fig. 6, also because the color of most roofs in Fig. 7 is green (green stands for small difference between result DSM and reference DSM).
b. In Fig. 6, there exist some blue blocks. Because some
buildings can not be represented by simple hip-roof primitive, they were not reconstructed. And we missed some small planes, they were not reconstructed too.
c. In Fig. 6, there are some red lines around yellow roofs and
some small rectangles adjacent to yellow roofs. And in Fig. 7, there exist some small blue dots on the roofs. Because the proposed method is a primitive-based reconstruction method; some buildings don’t strictly coincide with primitive, and some detailed features of buildings can not be represented by current simple primitive.
4. CONCLUSIONS AND FUTURE WORK
We proposed a primitive-based 3D building reconstruction method which can utilize the complementarities of airborne LiDAR data and optical imagery. It has not only the merits as other model-based methods, but also two characteristics. The proposed method is simple because it only uses the most straightforward features, i.e. planes of LiDAR point cloud and points of optical imagery. Further more, the proposed method can tightly integrate LiDAR point cloud and optical imagery, that is to say, all primitives’ parameters are optimized with all constraints in one step.
We applied this primitive-based 3D building reconstruction method to an ISPRS Test Project data. The evaluating result showed the proposed method is feasible. The reconstructed 3D building models fit the outlines of reference roofs well.
features (lines in images and point cloud). These are directions of our further research works.
Acknowledgements
This work is supported by National Natural Science Foundation of China Grant No. 41171265 and 40801131. This work is also supported by major project of State Key Laboratory of Remote Sensing Science of China and open foundation of Guangxi Key Laboratory of Spatial Information and Geomatics Grant No. 1103108-04.
The Vaihingen data set was provided by the German Society for Photogrammetry, Remote Sensing and Geoinformation (DGPF). [Cramer, 2010]: http://www.ifp.uni-stuttgart.de/dgpf/DKEP-Allg.html (in German).
References
Arefi, H., 2009. From LIDAR Point Clouds to 3D Building Models. PhD thesis, Bundeswehr University Munich.
Brenner, C., 1999. Interactive Modelling Tools for 3D Building Reconstruction. In: Photogrammetric Week '99. Wichmann, Stuttgart, pp. 23-34.
Cramer, M., 2010. The DGPF test on digital aerial camera evaluation – overview and test design. Photogrammetrie – Fernerkundung – Geoinformation 2(2010):73-82.
Haala, N., Hastedt, H., Wolf, K., Ressl, C., Baltrusch, S., 2010. Digital photogrammetric camera evaluation – generation of digital elevation models. Photogrammetrie – Fernerkundung – Geoinformation 2(2010):99-115.
Habib, A., 2009. Integration of Photogrammetric and LIDAR Data for Accurate Reconstruction and Visualization of Urban Environments. Proceedings of FIG COM3 Workshop on Spatial Information for Sustainable Management of Urban Areas, Mainz, Germany.
Hu, Y., 2003. Automated extraction of digital terrain models, roads and buildings using airborne LiDAR data, (PhD Thesis), Department of Geomatics Engineering, The University of Calgary, Calgary, Alberta, Canada.
Kim, C., 2008. Object-based Integration of Photogrammetric and LiDAR Data for Accurate Reconstruction and Visualization of Building Models, (PhD Thesis), Department of Geomatics Engineering, The University of Calgary, Calgary, Alberta, Canada.
Mayer, H., Hinz, S., Stilla, U., 2008. Automated extraction of roads, buildings and vegetation. Chapter in Li, Z., Chen, J., & Baltsavias, E., (Eds), 2008. Advances in Photogrammetry, Remote Sensing and Spatial Information Sciences: 2008. ISPRS Congress Book, ISPRS Book Series, Volume 7 (527p.), © 2008 Taylor & Francis Group, London, ISBN 978-0-415-47805-2, p. 213-226.
Mikhail, E.M., Bethel, J.S., McGlone, J.C., 2001. Introduction to Modern Photogrammetry, John Wiley & Sons, Inc., New York, 479 p.
Rottensteiner, F., and Ch. Briese, 2002. A new method for building extraction in urban areas from high-resolution LiDAR
data, International Archives of Photogrammetry and Remote Sensing, 34(3A): 295-301.
Rutzinger, M., Rottensteiner, F. Pfeifer, N., 2009. A comparison of evaluation techniques for building extraction from airborne laser scanning. IEEE Journal of Selected Topics in Applied Earth Observations and Remote Sensing 2(1):11-20.
Schenk, T., and B. Csatho, 2002. Fusion of LIDAR data and aerial imagery for a more complete surface description. In: IAPRSIS 32(3A): 310.
Spreckels, V., Syrek, L., Schlienkamp, A., 2010. DGPF project: evaluation of digital photogrammetric camera systems -stereoplotting. Photogrammetrie – Fernerkundung – Geoinformation 2(2010):117-130.
Tarsha-Kurdi, F., Landes, T., Grussenmeyer, P., Koehl, M., 2007. Model-driven and data-driven approaches using LIDAR data : analysis and comparison, International Archives of Photogrammetry, Remote Sensing and Spatial Information Systems Vol. XXXVI Part3 W49A / ISSN 1682-1750, pp. 87-92.
Wang, S., 2008. Floating model for building reconstruction from topographic maps and lidar data. XXI Congress of the International Society for Photogrammetry and Remote Sensing (ISPRS 2008). Vol. XXXVII. Part B3b:681-686.