Soil response to canopy position and feral pig disturbance beneath
Quercus agrifolia on Santa Cruz Island, California
Aaron Moody
a,∗, Julia Allen Jones
baDepartment of Geography, University of North Carolina at Chapel Hill, Chapel Hill, NC 27599 3220, USA bDepartment of Geosciences, Oregon State University, Corvallis, USA
Received 10 September 1999; accepted 28 November 1999
Abstract
We assessed the effects of canopy position and feral pig disturbance on soil moisture, pH, and inorganic nitrogen con-centrations beneath canopies of Quercus agrifolia and surrounding grasslands on Santa Cruz Island, California. Percent soil moisture, pH, nitrate-N, and total inorganic nitrogen varied significantly with canopy position. Soil moisture decreased, and pH increased along transects from the subcanopy trunk position to the open grassland outside the canopy. Nitrate and total nitrogen increased from the trunk position to midcanopy and then decreased from midcanopy to the open grassland position. The ratio of nitrate to ammonium varied with canopy position, even after controlling for the effects of soil moisture and pH, both of which strongly influence rates of nitrogen mineralization. Temporally, soil pH, soil moisture, nitrate-N, and total carbon all varied significantly between drought and non-drought years. Soils from fenced exclosures that removed feral pig disturbance did not exhibit significant differences in any soil property compared to control plots where pig access was permit-ted. The results of our analysis suggest that the primary factors influencing spatial and temporal variability in oak woodland soils on Santa Cruz Island were subcanopy position and climate variability, respectively. Biotic disturbance by feral pigs did not cause a significant cause in soil properties over the spatial and temporal domains examined in this study. © 2000 Elsevier Science B.V. All rights reserved.
Keywords: Quercus agrifolia; Soil nitrogen; Soil moisture; Pigs; Canopy
1. Introduction
Soil characteristics are influenced by factors that range from the scale of the individual ped, to global-scale climate patterns. As such, coherent spatial vari-ability in soil properties can occur at multiple spatial scales (Burrough, 1983). In a given ecosystem, some of these scales of variability may dominate over oth-ers. For example, ‘resource islands’ (e.g. soil patches with relatively high nitrogen or moisture content) are
∗Corresponding author. Tel.:+1-919-962-5305;
fax:+1-919-962-1537.
E-mail address: [email protected] (A. Moody)
a salient small-scale feature under trees or shrubs in many arid and semiarid ecosystems (Padien and Lajtha, 1992; Belsky et al., 1993; Ryel et al., 1996).
Although the processes that form resource is-lands are not well understood (Hook et al., 1994; Schlesinger et al., 1996) their existence under trees and shrubs suggests that individual long-lived plants can exert a significant influence upon soil properties in arid and semiarid environments. Moreover, the spatial patterns of these properties might persist in the face of other influential factors such as biological disturbance or climate variation. Alternatively, phys-ical and chemphys-ical disturbance of soils by introduced animals may alter biogeochemical and physical soil
properties (Barrett, 1982; Singer et al., 1984) and thus modify subcanopy spatial patterns in soil resources. The relative dominance of plant/soil relationships, biological disturbance, and climate dynamics as drivers of soil spatial variability is poorly understood. Our aim is to shed light on this issue by attempting to decouple the effects of plant/soil interactions and biological disturbance on soil resource distribution beneath the canopy of Quercus agrifolia. We exam-ined spatial patterns in soil resources under 10 trees on Santa Cruz Island, California over a 5-year period. Feral pigs (Sus scrofa), whose rooting is a major bio-logical disturbance under oak canopies on the island, were excluded from a 36 m2experimental plot beneath each tree. We quantified and compared variability in soil nitrogen, acidity, and moisture content associated with subcanopy spatial position, the exclusion or pres-ence of feral pigs, and interannual variation in rainfall. We focused on nitrogen and soil moisture because of the importance of these resources in controlling oak regeneration and subcanopy herbaceous species in oak woodland ecosystems in California (Parker, 1977; Dunn, 1980; Parker and Muller, 1982; Callaway, 1990). Soil pH, as it influences nutrient exchange rates and soil biotic communities, is also an important prop-erty. In addition, these variables can respond rapidly to factors such as removal of pigs, or climate fluctua-tions. More conservative soil properties, such as tex-ture, which are also important for plant growth, are less responsive to environmental change over short time periods (e.g. less than 10 years).
Our goals in this paper are to characterize the spa-tial patterns of soil properties beneath Q. agrifolia in an open woodland setting, and to determine whether foraging by feral pigs has an influence on these prop-erties. An understanding of the relative magnitude and duration of these influences may benefit ecosystem restoration in areas with populations of large intro-duced animals. The extent to which disturbance inter-feres with the spatial dynamics of the soil/plant system may also have implications for the subcanopy plant community.
2. Background
Oak woodlands are an ecologically important veg-etation formation throughout much of California, and
on Santa Cruz Island, where they occur in patchy mo-saics with grassland, coastal sage scrub and chaparral (Callaway and Davis, 1993). Oak woodlands provide vital habitat and food resources for numerous Califor-nia mammals and birds (Graves, 1977; Barrett, 1978, 1980). On Santa Cruz Island, endemic species, such as the Island Fox, Island Spotted Skunk, and Island Scrub Jay, rely on acorn production to maintain vi-able population densities (Laughrin, 1977; Schuyler, 1988).
In addition to competing with other species for food resources, feral pigs on Santa Cruz Island also impact oak regeneration by feeding on oak seedlings (Peart et al., 1994) and consuming acorn crops (Griffin, 1971; Barrett, 1980; Sterner, 1990). Rooting of surface soils by pigs produces a ‘roto-tilled’ appearance in feed-ing areas (Barrett, 1982; Sfeed-inger et al., 1984) and can modify biological, physical and chemical properties of soil, including populations of soil biota (Bennett, 1993) and nitrogen fractions (Barrett, 1982; Singer et al., 1984). Some of these effects may be related to aeration of the topsoil by pig rooting, and alteration of soil chemistry through defecation. Consequently, feral pigs may also influence oak regeneration and recruit-ment of herbaceous species indirectly by modifying subcanopy soil properties, although this linkage has not been established.
It has, however, been shown that soil proper-ties beneath Q. agrifolia can impact the survival of oak seedlings and herbaceous plants. In particular, seedlings of Q. agrifolia are notably dependent on near-surface soil water (Callaway, 1990; Callaway and D’Antonio, 1991) and nitrogen availability may limit the number and spacing of oak seedlings and dominant subcanopy annuals in Q. agrifolia wood-lands (Parker, 1977; Dunn, 1980; Parker and Muller, 1982). As such, spatial patterns in soil moisture and available nitrogen under oak canopies can influence distributions of oak seedlings and herbaceous species in the subcanopy setting.
to the trunk has been attributed to increased stemflow (Gersper and Holowaychuk, 1970), suppressed evapo-ration due to canopy shadowing and insulation by leaf litter (Birkeland, 1984), and the influence of greater organic matter content on soil structure under the canopy (Brady, 1984). Variations in soil pH may relate to the influence of the canopy on leaching processes (Birkeland, 1984), primarily through spatial patterns in the acidity of litter underneath the canopy (Zinke, 1962), or through stemflow processes (Gersper and Holowaychuk, 1970). Similarly, subcanopy patterns in soil nitrogen (Harradine, 1954) have been ascribed to litter characteristics (Zinke, 1962; Callaway and Nadkarni, 1991) or facilitation by the tree canopy of subcanopy species which contribute organic matter (Garcia-Moya and McKell, 1970).
Other authors have attributed spatial patterns of soil nitrogen to the absorption of nutrients from open areas by extensive lateral roots and the deposition of these nutrient stores under the canopy in the form of litter fall (Tiedemann and Klemmedson, 1973; Parker and Muller, 1982). Nitrogen redistribution could also take place through analogous processes in the vertical direction.
Aside from the quantity and quality of organic mat-ter, nitrogen mineralization depends on decomposition rates, which in turn, are related to other factors that af-fect microbial populations (Attiwill and Leeper, 1987). In particular, nitrification, compared to ammonifica-tion, is disproportionately affected by soil moisture, pH, and soil aeration (Stanford and Smith, 1972; Stan-ford and Epstein, 1974) because of the low tolerance of autotrophic nitrifying bacteria for moisture stress, acidity, and anaerobic conditions (Barber, 1984; Atti-will and Leeper, 1987; Paul and Clark, 1989).
This study concerned three factors that may influ-ence spatial patterns in soil properties under Q.
agri-folia woodland on Santa Cruz Island: (a) subcanopy
position; (b) feral pig disturbance; and (c) climatic variability. The tree canopy may influence nitrogen dynamics through effects on soil moisture, soil chem-istry, and nutrient cycling. Feral pig disturbance may alter litter mixing, aerate the soil, alter soil structure, and contribute organic matter. Temporal fluctuations in climate also may influence nitrogen dynamics through effects on soil moisture and consequent ef-fects on litter characteristics. We focused on soil resources that may limit regeneration of Q. agrifolia
and herbaceous species beneath the canopy. Experi-mental exclusion of feral pigs beneath the canopies of 10 mature woodland oaks after a long period of intense foraging activity provided a rare opportunity to understand pig disturbance effects relative to other factors. In addition, the conclusion of a long-term drought during the span of this project allowed us to evaluate the effect of short-term climate variability relative to biotic disturbance and tree effects.
3. Methods
3.1. Study area
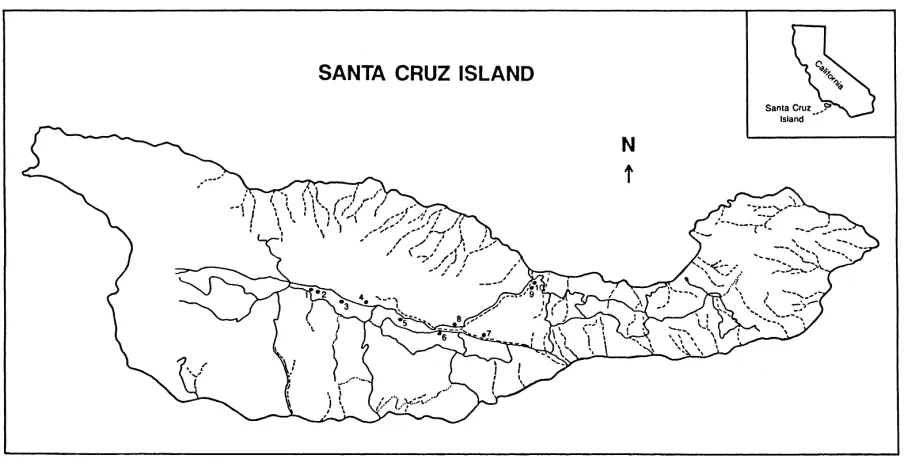
Soil samples were collected in 1989, 1990, and 1993 beneath 10 widely dispersed oaks in the E-W trend-ing central valley on Santa Cruz Island (119◦W, 34◦N) (Fig. 1). Santa Cruz is the largest of the California Channel Islands (248 km2) and is located 37 km south of Santa Barbara, California. The island is of ecolog-ical interest due, in part, to high levels of endemism among plants and animals (Schuyler, 1993).
Weather records from the central valley typify a Mediterranean-type climate regime, with mean monthly temperatures from 12 to 21◦C. Mean annual
precipitation is 510 mm (Brumbaugh, 1980), most of which falls between November and April.
This study was conducted in oak woodlands, which are found mostly on north-facing slopes and in upper flood plains. Oak woodlands consist of open grassland with scattered individual oak trees (Q. agrifolia and
Q. tomentella, an endemic species) and oak shrubs
(Q. berberidifolia). This is the most widespread of the 10 plant communities that have been described for the island (Philbrick and Haller, 1977; Jones et al., 1993). The soils examined in this study are Haploxerolls and Argixerolls formed from volcanic parent materi-als (Butterworth et al., 1993). They are atypical of the majority of soils on the island, which are weakly developed, shallow, and severely eroded. Soils under oaks are typically 30–90 cm deep with fine loam tex-ture, massive or blocky structex-ture, and pH ranging from 5.5 to 7.5 (Butterworth et al., 1993).
Fig. 1. Santa Cruz Island. Locations of the trees in this study are represented by numbers 1 to 10 in the central valley and an adjacent valley. Dashed lines are drainages. Solid lines represent dirt roads (Adapted from Brumbaugh, 1980; Peart et al., 1994).
1980s the sheep population was estimated at 25,000 and the feral pig population at several thousand (P. Schuyler, personal communication) with several hundred free ranging cattle. Between 1981 and 1989 over 37,000 sheep were eradicated by shooting, and in 1988 the cattle were removed. Sheep carcasses were consumed by feral pigs (Schuyler, 1993), driv-ing an increase in the pig population durdriv-ing the late 1980s. Associated with this population increase were increases in the extent and severity of visible rooting and soil disturbance, especially in the oak woodlands which are favored habitat for feral pigs (Sterner, 1990).
3.2. Field methods
Soils were first sampled between April and June 1989 under 10 large, isolated oaks distributed over roughly 10 km2. This time-frame was chosen to coin-cide with a period (early dry season) over which soil moisture and soil microbial populations were expected to be relatively stable. The last significant rainfall (and possible leaching event) of 1989 occurred in February (6.0 cm). Analysis of variance showed no difference in
N-concentration between samples collected at differ-ent months in 1989. Soils were sampled again in April 1990 and April 1993. Rainfall was high during Febru-ary 1990 (4.2 cm) and March 1993 (12.2 cm). Signifi-cant leaching may have occurred as a consequence of these rainfall events.
The mid- and late-1980s were a period of drought throughout southern California. In 1989 and 1990 an-nual precipitation on the island was 130 and 190 mm, only 20–40% of the long term average (510 mm). The drought ended in 1991. The 1991, 1992, and 1993 rainy seasons were particularly wet.
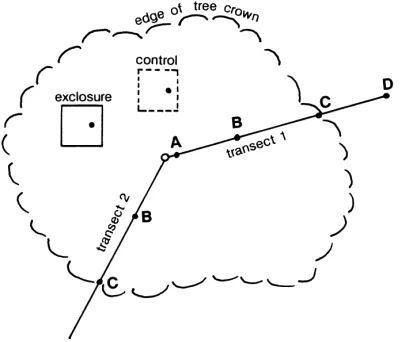
Fig. 2. Typical sampling scheme under Quercus agrifolia. Transects were chosen in randomly selected directions. Exclosure and control plots were 36 m2. All samples (d) were composites.
pig visitation is not known for each tree, the level of surface disruption was roughly comparable between trees.
In 1989, pig exclosures were constructed of pig wire strung around 10 cm×10 cm fence posts beneath each tree (Fig. 2) (Peart et al., 1994). The wire is buried to a depth of 0.5 m and stands 1.1 m above ground. These structures provide freedom of movement for birds, squirrels, foxes and skunks, but prohibit access by pigs. Unfenced control plots that do permit pig access are marked by short rebar stakes at the corners. Each exclosure and control plot is 36 m2in size.
In 1989, two transects were laid out along randomly selected compass directions under each tree. Com-posite surface samples of 0–15 cm were taken along one transect at the trunk (position A), midcanopy (B), canopy edge (C), and outside the canopy (D) (Fig. 2). Samples were taken along the second transect at posi-tions B and C only. Composite samples were also taken at midcanopy within the exclosure and control plots at each tree. At this time, exclosures had been standing for only 4 months, yet little sign of pre-construction disturbance remained. The control plots, however, ex-hibited typical signs of pig disturbance. Exclosures and control plots were sampled again in April 1990 and April 1993. A total of 99 samples were collected in 1989, 20 in 1990, and 20 in 1993. Samples were sealed in polythene bags.
3.3. Laboratory methods
Laboratory analyses were conducted in the Geog-raphy Department Soils Lab at University of Califor-nia, Santa Barbara following procedures described by Anderson and Ingram (1989) and Setaro and Jones (unpubl.). Prior to analysis, stones, roots and litter were removed from the soil samples by hand. Percent soil moisture was determined gravimetrically. Soil pH was analyzed by glass electrode using a 1:1 soil:water ratio.
Nitrate and ammonium concentrations in mg g−1
were determined using colorimetric assays. From each soil sample, three sub-samples were extracted with 2N KCl using a 4:1 extractant:soil ratio. Filter pa-pers were rinsed before extraction to eliminate NH4+
contamination. Extracts were assayed in duplicate for NO3− and NH4+. With three subsamples and two
replicates for each test, there are a total of six NO3−
and six NH4+measurements for each sample. The six
measurements were averaged to produce single NO3−
and NH4+values for each soil sample. Total carbon
(mg g−1) was also determined for exclosure and
con-trol samples only.
3.4. Statistical methods
Linear regression, analysis of variance, and mul-tiple comparison procedures were used to evaluate relationships between the soil properties, and how these properties varied with canopy position and feral pig exclusion (exclosure versus control). Data were transformed to adjust for skewed distributions. Transformations included the natural log of NO3−
concentration, the square root of NH4+concentration,
and the square root of percent soil moisture. Untrans-formed values were used for all other variables.
One set of simple regression analyses was used to establish relationships between soil moisture and NO3−, and pH and NH4+. A second set of multiple
regressions was performed on total inorganic nitrogen (TN, the sum of nitrate and ammonium) and on the ratio of nitrate to ammonium (Nrat) using both soil
moisture and pH as explanatory variables.
Analyses of variance were conducted using soil moisture, pH, NO3−, NH4+, TN, Nrat, and the
position or pig exclusion. The residuals from the regression models contained the variance in the ni-trogen variables that still remained after the effect of soil moisture and pH had been accounted for. Thus, ANOVA tests on the regression residuals were used to determine whether position or field treatment had any effect on NO3−, NH4−, TN, or Nrat after controlling
for the effects of soil moisture and pH.
ANOVA results only confirm or deny the null hypothesis that all factor-level means are identical. Contrast statements allow the comparison of several factor-level means to test whether a specified relation-ship exists among those means. Contrast statements were employed as post hoc tests to explore whether specific patterns were exhibited by the soil properties as a function of position beneath the canopy. A vec-tor of coefficients (K) is defined which sums to zero and represents a trend across the factor means. For example, a contrast statement (i.e. K vector) of [−3
−1 1 3], would be used to test for the significance of an upward linear trend in some variable across four factor levels. The factor means are multiplied by their associated coefficients in the K vector and summed to produce an L value which is divided by its standard error and compared to a t-statistic (Neter et al., 1990). That is
Lx = m X
i=1 ¯ xiki,
Table 1
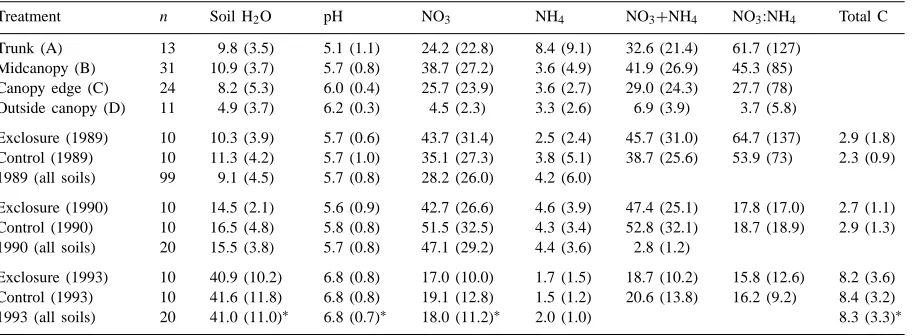
Summary statistics for the soil data used in this researcha
Treatment n Soil H2O pH NO3 NH4 NO3+NH4 NO3:NH4 Total C
Trunk (A) 13 9.8 (3.5) 5.1 (1.1) 24.2 (22.8) 8.4 (9.1) 32.6 (21.4) 61.7 (127) Midcanopy (B) 31 10.9 (3.7) 5.7 (0.8) 38.7 (27.2) 3.6 (4.9) 41.9 (26.9) 45.3 (85) Canopy edge (C) 24 8.2 (5.3) 6.0 (0.4) 25.7 (23.9) 3.6 (2.7) 29.0 (24.3) 27.7 (78) Outside canopy (D) 11 4.9 (3.7) 6.2 (0.3) 4.5 (2.3) 3.3 (2.6) 6.9 (3.9) 3.7 (5.8)
Exclosure (1989) 10 10.3 (3.9) 5.7 (0.6) 43.7 (31.4) 2.5 (2.4) 45.7 (31.0) 64.7 (137) 2.9 (1.8) Control (1989) 10 11.3 (4.2) 5.7 (1.0) 35.1 (27.3) 3.8 (5.1) 38.7 (25.6) 53.9 (73) 2.3 (0.9) 1989 (all soils) 99 9.1 (4.5) 5.7 (0.8) 28.2 (26.0) 4.2 (6.0)
Exclosure (1990) 10 14.5 (2.1) 5.6 (0.9) 42.7 (26.6) 4.6 (3.9) 47.4 (25.1) 17.8 (17.0) 2.7 (1.1) Control (1990) 10 16.5 (4.8) 5.8 (0.8) 51.5 (32.5) 4.3 (3.4) 52.8 (32.1) 18.7 (18.9) 2.9 (1.3) 1990 (all soils) 20 15.5 (3.8) 5.7 (0.8) 47.1 (29.2) 4.4 (3.6) 2.8 (1.2)
Exclosure (1993) 10 40.9 (10.2) 6.8 (0.8) 17.0 (10.0) 1.7 (1.5) 18.7 (10.2) 15.8 (12.6) 8.2 (3.6) Control (1993) 10 41.6 (11.8) 6.8 (0.8) 19.1 (12.8) 1.5 (1.2) 20.6 (13.8) 16.2 (9.2) 8.4 (3.2) 1993 (all soils) 20 41.0 (11.0)∗ 6.8 (0.7)∗ 18.0 (11.2)∗ 2.0 (1.0) 8.3 (3.3)∗
aValues are means and standard deviations (in parentheses). Asterisks (*) in the last row (1993) indicate properties for which the 1993
values were significantly different from 1990 values at p=0.01. Soil moisture is given in percent and N concentrations are inmg g−1.
where x is the variable of interest,x¯iis the mean value
of the variable x within factor level i (e.g. subcanopy position B) and ki is the contrast-statement coefficient
associated with factor level i. The standard error of
L (σl) is easily determined (Neter et al., 1990). For
this analysis, contrast statements were constructed to examine trends in soil moisture, pH and NO3− with
subcanopy position.
4. Results and discussion
4.1. Basic relationships
Soils in 1989 and 1990 were dry, depleted in to-tal carbon, slightly acidic, and high in nitrate rela-tive to the post-drought conditions in 1993 (Table 1). Increased total carbon after the drought probably re-sulted from greater biomass productivity in response to increased precipitation. The reduction in nitrate-N in post-drought years could have resulted from either increased leaching or greater N uptake by the more productive subcanopy plant community.
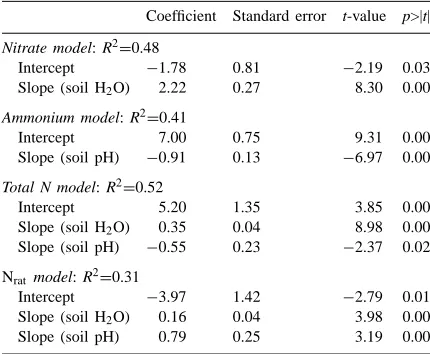
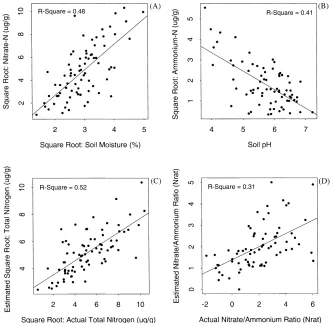
Correlations and regressions among the variables used in this study show that NO3− was strongly
related to percent soil moisture (r2=0.48) whereas NH4+and soil moisture were not related (Tables 2 and
3, Fig. 3A). Conversely, NH4+ was inversely related
Table 2
Correlations between soil propertiesa
Variable Moisture pH Nitrate Ammonium
Moisture 1.0 0.11 0.71∗ −0.06
pH 1.0 0.11 −0.64∗
Nitrate 1.0 −0.15
Ammonium 1.0
aAsterisks indicate significance at p=0.01.
(Tables 2 and 3, Fig. 3B). These findings suggests that nitrification was more limited by moisture than ammonification, and that ammonification was limited under more alkaline conditions.
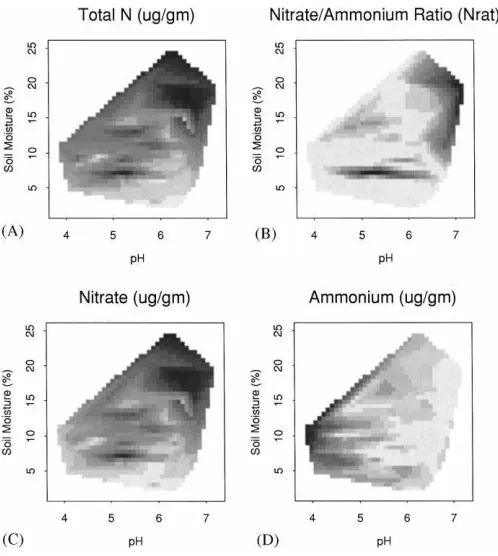
The regression model of TN as predicted by soil moisture and pH (Table 3; Figs. 3C and 4A) suggests that nitrogen mineralization in general (ammonifica-tion and nitrifica(ammonifica-tion combined) increased with soil moisture and decreased with pH. However, the model of Nrat (Table 3; Figs. 3D and 4B) shows that,
rel-ative to ammonium, nitrate increased with both soil moisture and with pH, implying that nitrification was limited by low soil moisture and by acid conditions. This supports the findings of others that at high pH, ammonium concentration is low relative to nitrate
Table 3
Linear regression summaries for models of nitrate, ammonium, total-N, and the ratio of nitrate to ammonium (Nrat)a
Coefficient Standard error t-value p>|t|
Nitrate model: R2=0.48
Intercept −1.78 0.81 −2.19 0.03 Slope (soil H2O) 2.22 0.27 8.30 0.00
Ammonium model: R2=0.41
Intercept 7.00 0.75 9.31 0.00
Slope (soil pH) −0.91 0.13 −6.97 0.00
Total N model: R2=0.52
Intercept 5.20 1.35 3.85 0.00
Slope (soil H2O) 0.35 0.04 8.98 0.00
Slope (soil pH) −0.55 0.23 −2.37 0.02
Nrat model: R2=0.31
Intercept −3.97 1.42 −2.79 0.01 Slope (soil H2O) 0.16 0.04 3.98 0.00
Slope (soil pH) 0.79 0.25 3.19 0.00
aIntercept and slope coefficients are presented along with
stan-dard errors for the coefficients, t-values and the probability that a t-value of the given magnitude would occur under the null hy-pothesis. The r2-values are given on the top line of the table for
each model.
concentration because of the suitability of alkaline conditions for nitrifying bacteria, and the resultant in-crease in the transition of available nitrogen from the ammonium pool to the nitrate pool (Stanford and Epstein, 1974; Barber, 1984; Attiwill and Leeper, 1987; Paul and Clark, 1989). Despite this effect, TN was still lower under dry conditions (Fig. 4A), suggesting that the influence of soil moisture on N mineralization is more important than pH within the range of conditions found in this study.
4.2. Analysis of variance and multiple comparisons
Analysis of variance was used to determine whether any of the soil properties varied as a function of canopy position or field treatment. Contrast statements were used as post hoc analyses to test for specific patterns in soil properties as a function of canopy position. The critical t-value for each contrast test was t(0.995, dfe)=3.3. Residuals from the regression models (scribed earlier) were also tested using ANOVA to de-termine whether position still had an effect on nitrogen after adjusting for the effects of soil moisture and pH.
4.2.1. Canopy position effects
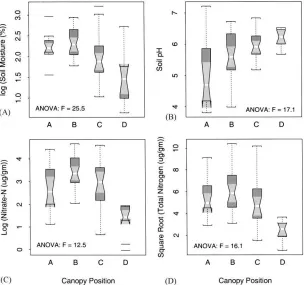
Soil moisture content, pH, NO3−, and TN varied by
canopy position in 1989 (Table 4, Fig. 5). In general, soil moisture decreased, and pH increased with dis-tance from the trunk of the tree. Nitrate was low at the trunk position, increased towards midcanopy and de-creased towards the canopy edge (Fig. 5). These trends were tested explicitly using contrast statements.
4.2.2. Moisture content
Fig. 3. Scatterplots showing relationships between (A) soil moisture and soil nitrate; (B) soil pH and soil ammonium; (C) measured total inorganic nitrogen (TN) vs. TN predicted using soil moisture and pH; and (D) measured nitrate/ammonium ratio vs. the nitrate/ammonium ratio predicted using soil moisture and pH. Nitrate, ammonium and TN were transformed using the square root. All nitrogen variables are inmg g−1. The regression relationship illustrated here are summarized in Table 2.
beneath the canopy will protect the upper soil from the drying effects of the sun and wind.
4.2.3. pH
The contrast K=[−3 −1 1 3] was used to test for an upward linear trend in pH from positions A to D, as suggested Fig. 5B. The t-value of 5.9 confirmed the presence of such a trend. This pattern could have been due to several factors. The litter layer may have de-creasing acidity with distance from the trunk as sug-gested by Zinke (1962). Low pH of soils near the trunk might also be due to the acidity of stem flow water which enters the soil at this position (Gersper and Holowaychuk, 1970). In addition, there may be
greater leaching at the trunk position due to the facil-itation of water infiltration by stem flow.
4.2.4. Nitrate
The contrast K=[1 2 1−4] was used to test whether NO3−increased from positions A to B and then
Fig. 4. Distributions of soil nitrogen variables along gradients of soil moisture and pH. Values increase from light to dark. (A) Total inorganic nitrogen; (B) nitrate/ammonium ratio; (C) nitrate; and (D) ammonium.
provide a conducive setting for nitrification, leading to maximum nitrate values at this position. Soil mois-ture, which begins to decline beyond the midcanopy position, may have increasingly limited nitrification
Table 4
ANOVA summaries for soil variables and residuals from the nitrate and ammonium regressions presented in Table 2a
Variable F-value p>|F|
Soil H2O∗ 25.51 0.000
Soil pH∗ 17.07 0.000
Nitrate∗ 12.53 0.000
Ammonium 1.71 0.195
Total-N∗ 16.12 0.000
Nrat 3.11 0.082
Nitrate residuals 0.77 0.380
Ammonium residuals 1.47 0.230
Total-N residuals 0.89 0.349
Nrat residuals∗ 4.80 0.032
aThe F-values and the probability that an F-value of the
observed magnitude would occur under the null hypothesis are given. Significant results (*) indicate that a given soil property does vary by subcanopy position.
between positions C and D. Total inorganic nitrogen (TN) and Nratexhibited the same trend as nitrate, but
only TN differed significantly with canopy position. Other factors in addition to soil moisture and pH may have influenced spatial patterns in nitrate beneath the tree canopy. For example, lower nitrogen content and greater acidity of bark litter, or the leaching ef-fects of stem flow could both lead to lower NO3−
concentration near the trunk. In addition, sequestering of N from outside the canopy by lateral roots, and the deposition of N via litter fall beneath the canopy could contribute to the observed patterns of NO3−
concentration at different canopy positions. Due to the potential existence of such processes, we ran ANOVA tests for the residuals from the regression models (described earlier) to determine whether canopy posi-tion still had an effect on the nitrogen variables after adjusting for the influence of soil moisture and pH.
4.2.5. Regression model residuals
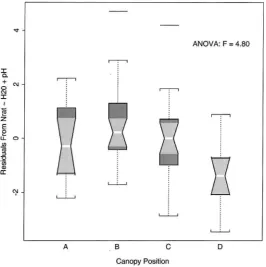
The residuals from the Nrat model varied
Fig. 5. Boxplots comparing the distribution of the measured soil variables at the four different canopy positions. Labels A, B, C and D represent positions at the trunk, midcanopy, the canopy edge, and outside the canopy, respectively. The upper and lower boundaries of each box represent the interquartile distance (IQD). The horizontal midline is the median value. The whiskers extend to±1.5x IQD. Outliers are displayed as horizontal lines beyond the range of the whiskers. If the notches of any two boxes do not overlap vertically, this suggests a significant difference at a rough 5% confidence interval. (A) Log(soil moisture); (B) soil pH; (C) log(soil nitrate); and (D) square root of total inorganic nitrogen.
even after accounting for the effects of soil moisture and pH, there was still a coherent spatial pattern in the ratio of nitrate to ammonium beneath the canopy of
Q. agrifolia. This implies that there were other canopy
related factors, such as those mentioned earlier, influ-encing either organic nitrogen levels or populations of autotrophic nitrifying bacteria, i.e. those that are ca-pable of transforming nitrogen from the ammonium pool into the nitrate pool.
4.2.6. Field treatment effects
Since exclosure and control plots were placed at the midcanopy position beneath each tree (Fig. 2), we were able to compare soil properties for the two dif-ferent treatments (exclosures and controls) for soils that were sampled only from the midcanopy
posi-tion (posiposi-tion B). The potentially confounding effect of canopy position, demonstrated earlier, is thus con-trolled. There was no significant difference in any soil property sampled from exclosure versus control plots in either 1989, 1990, or 1993. In 1989, 4–5 months following the construction of the experimental plots, the most notable difference between soils from the two treatments was nitrate concentration, with 43.7 and 33.3mg g−1 in exclosures and controls, respectively
(Table 1). By 1990, this apparent trend had reversed, with nitrate concentrations of 42.7 and 51.5mg g−1
in exclosures and controls, respectively (Table 1). By 1993 no apparent difference remained in nitrate con-centration or any other soil property (Table 1).
Fig. 6. Boxplot comparing the distribution of residuals from the nitrate/ammonium ratio regression model summarized in Table 2 across the four different canopy positions. Differences in the distributions illustrated by the boxplot indicate the remaining position effect after controlling for the effect of soil moisture and pH on the the nitrate/ammonium ratio. See caption of Fig. 5 for explanation of boxplot.
position, the field treatment effect was insignificant for all soil properties considered. Nevertheless, there were considerable differences in mean nitrate values that were suggestive of a field treatment effect. It is possible that increased biomass productivity within exclosures (Peart et al., 1994) resulted in rates of nitrate uptake that were sufficient to draw nitrate concentrations below those found in control plots in 1990. In 1993, however, nitrate concentrations from exclosures were only marginally lower than those in control plots, although both were depressed relative to 1989 and 1990, possibly due to leaching.
5. Conclusions
In Q. agrifolia woodlands, as in other savanna-type ecosystems, the transition from tree trunk to open grassland encompasses strong gradients in light, wind, and temperature regimes; mediation of precipitation; and organic matter inputs. These gradients, in turn,
can influence soil physical and chemical properties (such as soil moisture, pH, and nutrient dynamics) in complex and interrelated ways. The resulting spa-tial patterns in soil characteristics are themselves small-scale environmental gradients that may impact oak regeneration and patterns in subcanopy plant communities (Maranon and Bartolome, 1993). The effects of soil disturbance (such as rooting by feral pigs) can be better understood if examined in the context of other factors such as spatial and temporal patterns produced by plant/soil/climate relationships.
This work establishes that, in Santa Cruz Island
Q. agrifolia woodlands, soil properties did vary with
canopy position. In general, soil moisture and nitrate had similar spatial patterns relative to canopy position, with highest values at midcanopy positions, while soil acidity and ammonium highest values near the trunk (Table 1, Fig. 3).
of nitrate to ammonium between canopy positions. This residual position effect could have been related to either chemical alteration of precipitation at differ-ent canopy positions; varying abundance or chemical composition of organic matter inputs; redistribution of nitrogen through lateral root uptake and subsequent subcanopy deposition; or by subcanopy temperature regimes.
Second, the lack of any significant effect on soil properties from experimental exclusion of feral pigs for 5 years indicates that physical disturbance of soils had no direct influence on resource conditions in this environment. By 1992 pig exclosures had more than double the number of woody seedlings than controls (Peart et al., 1994). However, in 1993, pig exclosures still were no different than controls in any soil property.
Spatial variability in soil properties under Q.
agri-folia was primarily associated with position beneath
the canopy. Soil characteristics also varied tempo-rally in response to fluctuations in rainfall over the period from 1989 to 1993. However, different levels of biotic disturbance did not significantly contribute to heterogeneity in percent soil moisture, pH, or in-organic nitrogen concentrations. We, thus, cannot conclude that disturbance by feral pigs contributes to either the spatial or temporal variability in the soil properties studied in this semi-arid oak woodland. Over longer time periods, removal of pig disturbance, or fluctuations in pig populations, may influence soil characteristics directly through changes in the regime of soil disruption and nutrient inputs, or indirectly through changes in the suppression of understory vegetation.
Acknowledgements
This research was supported by grants from The Nature Conservancy, The Island Foundation, and a Faculty Career Development Award to Julia Jones from the University of California at Santa Barbara. The authors thank Pamela Cashman, Shirley Clarke, Scott Jones, Steve Junak, Lyndal Laughrin, Diann Peart, Peter Schuyler, Frank Setaro, and Carey Stan-ton for logistical support, field and laboratory assis-tance, and thoughtful comments. Finally, we thank two anonymous scientists for valuable reviews.
References
Anderson, J.M., Ingram, J.S.I., 1989. Tropical Soil Biology and Fertility: a Handbook of Methods. CAB International, London. Attiwill, P.M., Leeper, G.W., 1987. Forest Soils and Nutrient
Cycles. Melbourne University Press, Victoria.
Barber, S.A., 1984. Soil Nutrient Bioavailability. Wiley, New York. Barrett, R.H., 1978. The feral hog at the Dye Creek Ranch.
Hilgardia 46 (9), 283–355.
Barrett, R.H., 1980. Mammals of California oak habitats — management implications. In: Plumb, T.R. (Ed.), Proceedings of the Symposium on the Ecology, Management, and Utilization of California oaks. U.S. Department of Agriculture, Forest Service, Pacific Southwest Forest and Range Experiment Station, General Technical Report PSW-44, pp. 275–291. Barrett, R.H., 1982. Habitat preferences of feral hogs, deer, and
cattle on a Sierra foothill range. J. Range Manage. 35 (3), 342–346.
Belsky, A.J., Mwonga, S.M., Amundson, R.G., Duxbury, J.M., Ali, A.R., 1993. Comparative effects of isolated trees on their undercanopy environments in high- and low-rainfall savannas. J. Appl. Ecol. 30, 143–155.
Bennett, S.G., 1993. The effects of feral animals on soil mites recovered from Catalina Ironwood groves (Lyonothamnus
floribundus) on Santa Catalina Island, California. In: Hochberg,
F.G. (Ed.), Proceedings of the Third California Islands Symposium on Recent Advances in California Islands Research, Santa Barbara Museum of Natural History, Santa Barbara, CA, pp. 155–170.
Birkeland, P.W., 1984. Soils and Geomorphology. Oxford University Press, New York, pp. 262–268.
Brady, N.C., 1984. The Nature and Properties of Soils. Macmillan, New York.
Brumbaugh, R.W., 1980. Erosion and Soils, Santa Cruz Island, California. The Nature Conservancy Report, Department of Geography, University of California, Los Angeles, CA, 110 pp. Burrough, P.A., 1983. Multiscale sources of spatial variation in soil. II. A non-Brownian fractal model and its application in soil survey. J. Soil Sci. 34, 599–620.
Butterworth, J., Jones, J.A., Jones, P.S., 1993. Soil forming factors, morphology, and classification on Santa Cruz Island, California. In: Hochberg, F.G. (Ed.), Proceedings of the Third California Islands Symposium on Recent Advances in California Islands Research, Santa Barbara Museum of Natural History, Santa Barbara, CA, pp. 39–44.
Callaway, R.M., 1990. Effects of soil water distribution on the lateral root development of three species in California oaks. Am. J. Bot. 77, 1469–1475.
Callaway, R.M., D’Antonio, C.M., 1991. Shrub facilitation of coast live oak establishment in central California. Madrono 38, 158– 169.
Callaway, R.M., Davis, F.W., 1993. Vegetation dynamics, fire, and the physical environment in coastal central California. Ecology 74, 1567–1578.
Challinor, D., 1968. Alteration of surface soil characteristics by four tree species. Ecology 49, 286–290.
Dunn, P.H., 1980. Nutrient-microbial considerations in oak management. In: Plumb, T.R. (Ed.), Proceedings of the Symposium on the Ecology, Management and Utilization of California oaks. U.S. Forest Service Pacific Southwest Forest and Range Experiment Station, General Technical Report PSW-44, pp. 149–160.
Garcia-Moya, E., McKell, C.M., 1970. Contributions of shrubs to the nitrogen economy of a desert-wash plant community. Ecology 51, 81–88.
Gersper, P.L., Holowaychuk, N., 1970. Effects of stemflow on a Miami soil under a beech tree. II. Chemical properties. Proc. Soil Sci. Soc. Am. 34, 786–794.
Graves, W.C., 1977. Oaks provide habitat for 86 species of birds, 11 mammals. Outdoor Calif. 38 (5), 17–18.
Griffin, J.R., 1971. Oak regeneration in the upper Carmel valley, California. Ecology 52 (5), 862–868.
Harradine, F.H., 1954. Factors influencing the carbon and nitrogen levels in California soils. Ph.D. Dissertation, Soils Department, University of California, Berkeley.
Holland, V.L., 1973. A study of soil and vegetation under Quercus
douglasii compared to open grassland. Ph.D. Dissertation,
Department of Botany, University of California at Berkeley, Berkeley, CA.
Hook, P.B., Lauenroth, W.K., Burke, I.C., 1994. Spatial patterns of roots in a semiarid grassland: abundance of canopy openings regeneration gaps. J. Ecol. 82 (3), 485–494.
Jones, J.A., Junak, S.A., Paul, R.J., 1993. Progress in mapping vegetation on Santa Cruz Island and a preliminary analysis of relationships with environmental factors. In: Hochberg, F.G. (Ed.), Proceedings of the Third California Islands Symposium on Recent Advances in California Islands Research, Santa Barbara Museum of Natural History, Santa Barbara, California, pp. 97–104.
Laughrin, L.L., 1977. The Island Fox: a field study of its behavior and ecology. Ph.D. Thesis, University of California, Santa Barbara.
Maranon, T., Bartolome, J.W., 1993. Reciprocal transplants of herbaceous communities between Quercus agrifolia woodland and adjacent grassland. J. Ecol. 81, 673–682.
Mergen, F., Malcolm, R., 1955. Effect of hemlock and red pine on physical and chemical properties of two soil types. Ecology 36, 468–473.
Neter, J., Wasserman, W., Kutner, M.H., 1990. Applied Linear Statistical Models, 3rd Edition. Richard D. Irwin Inc., Illinois. Padien, D.J., Lajtha, K., 1992. Plant spatial pattern and nutrient distribution in pinyon-juniper woodlands along an elevational
gradient in northern New Mexico. Int. J. Plant Sci. 163 (3), 425–433.
Parker, V.T., 1977. Dominance relationships of tree associated herbs in some California grasslands. Ph.D. Dissertation, University of California, Santa Barbara.
Parker, V.T., Muller, C.H., 1982. Vegetation and environmental changes beneath isolated live oak trees (Quercus agrifolia) in a California annual grassland. Am. Midl. Natural. 107 (1), 69– 81.
Paul, E.A., Clark, 1989. Soil Microbiology and Biochemistry. Academic Press, London.
Peart, D., Patten, D.T., Lohr, S.L., 1994. Feral pig disturbance and woody species seedling regeneration and abundance beneath coast live oaks (Quercus agrifolia) on Santa Cruz Island, California.
Philbrick, R.N., Haller, J.R., 1977. The southern California Islands. In: Barbour, M., Major, J. (Eds.), Terrestrial Vegetation of California. Wiley, New York, pp. 893–906.
Ryel, R.J., Caldwell, M.M., Manwaring, J.H., 1996. Temporal dynamics of soil spatial heterogeneity in sagebrush-wheatgrass steppe during a growing season. Plant Soil 184 (2), 299– 309.
Schlesinger, W.H., Raikes, J.A., Hartley, A.E., Cross, A.F., 1996. On the spatial patterns of soil nutrients in desert ecosystems. Ecology 77 (2), 364–374.
Schuyler, P., 1988. Feral pigs (Sus scrofa) on Santa Cruz Island: the Need for a Removal Program. The Nature Conservancy, Santa Barbara, CA, 24 pp.
Schuyler, P., 1993. Control of feral sheep (Ovis aries) on Santa Cruz Island, California. In: Hochberg, F.G. (Ed.), Proceedings of the Third California Islands Symposium on Recent Advances in California Islands Research, Santa Barbara Museum of Natural History, Santa Barbara, CA, pp. 443–452.
Singer, F.J., Swank, W.T., Clebsch, E.E.C., 1984. Effects of wild pig rooting in a deciduous forest. J. Wildl. Manage. 48 (2), 464–473.
Stanford, G., Epstein, E., 1974. Nitrogen mineralization–water relations in soils. Proc. Soil Sci. Soc. Am. 38, 103–106. Stanford, G., Smith, S.J., 1972. Nitrogen mineralization potential
of soils. Proc. Soil Sci. Soc. Am. 36, 465–472.
Sterner, J., 1990. Population characteristics, home range, and habitat use of feral pigs on Santa Cruz Island, California. M.S. Thesis, University of California at Berkeley.
Tiedemann, A.R., Klemmedson, J.O., 1973. Effect of mesquite on physical and chemical properties of the soil. J. Range Manage. 26, 27–29.