Logistics service quality: a new
way to loyalty
Irene Gil Saura
Departamento de Comercializacio´n e Investigacio´n de Mercados,
Facultad de Economı´a, Universidad de Valencia, Valencia, Spain
David Servera France´s
Facultad de Estudios de la Empresa,
Universidad Cato´lica de Valencia San Vicente Ma´rtir, Valencia, Spain
Gloria Berenguer Contrı´
Departamento de Comercializacio´n e Investigacio´n de Mercados,
Facultad de Economı´a, Universidad de Valencia, Valencia, Spain, and
Marı´a Fuentes Blasco
Facultad de Ciencias Empresariales, Universidad Pablo de Olavide,
Sevilla, Spain
Abstract
Purpose– Now-a-days, logistics research focuses on the ability of logistics to deliver a quality service and generate greater satisfaction with the delivered service. Therefore, the aim of this work is to analyze the quality, satisfaction, and loyalty sequence in the logistic service delivery context, with the purpose of considering the role of information and communication technologies (ICT) in this chain of effects.
Design/methodology/approach– After reviewing the different approaches given by the literature, SEM analysis is used to contrast the hypotheses for the analyzed constructs in the presence of high/low ICT level. A questionnaire based on personal survey was conducted among manufacturers. The study collected data from 194 companies. Structural equation modeling was applied to these data to test relationships among the variables in the study.
Findings– The reliability and validity tests show satisfactory results. The conclusions confirm this chain of consequences, and emphasize the incidence of ICT in the description and intensity of these relations.
Research limitations/implications– As non-probabilistic sampling methods have been used, in subsequent research, it would be useful to obtain a more representative population sample. In future, works relations between the variables proposed would be analyzed contemplating the sectoral nature of the sample, accepting that relationship intensity may be modified according to the company’s sector of activity.
Originality/value– This paper describes a framework to explore the relationships between service quality, customer satisfaction and loyalty in the supply chain from the perspective of ICT.
KeywordsCommunication technologies, Distribution management, Service levels, Customer loyalty, Customer satisfaction
Paper typeResearch paper
The current issue and full text archive of this journal is available at
www.emeraldinsight.com/0263-5577.htm
The authors are grateful to the Spanish Ministry of Science and Technology for financial support for this work (I þD del Plan Nacional SEJ2004-05988).
IMDS
qEmerald Group Publishing Limited 0263-5577
1. Introduction
The inclusion of concepts such as service quality and relationship marketing has significantly changed both the academic study and business practice of logistics. Logistics has traditionally been considered necessary for connecting production and consumption. From this perspective, a company’s logistics function was seen only as a generator of costs with no capacity for differentiation (Ballou, 2004). This began to change in the mid-1990s as logistics research based on marketing principles began to analyze the capacity of logistics to deliver quality and thus generate greater customer satisfaction and loyalty (Mentzeret al., 2004; Richeyet al., 2007). The logistics industry today is a classical example of service-based industry development (Chapman
et al., 2003) and more in-depth studies of logistics are needed from the perspective of supply channel relationships (Lambertet al., 2004; Knemeyer and Murphy, 2004, 2005; Fogginet al., 2004). In addition, the generalized use of information and communication technologies (ICT) has brought far reaching transformations to different business areas and logistics is no exception. Stock and order management, warehousing and transport are logistics activities which can benefit from the new opportunities offered by the technologies to organize new forms of supply chain relationships. Given the relatively recent application of ICT to logistics management, however, there is yet no clear understanding of how ICT are applied or of their impact (Feng and Yuan, 2006).
This work presents an in-depth study, in an inter-organizational context, of the relationship between logistics service quality (LSQ), with a particular emphasis on its defining factors and customer satisfaction and loyalty. We also propose to determine how logistics ICT influences this consequence chain. Our objective therefore, is to examine the moderator effect of ICT intensity on said variables, in other words, we want to analyze the influence of high levels of ICT in comparison to low levels of ICT on the perception of LSQ and how this can affect satisfaction and in the final instance, loyalty.
The study is divided into three parts. First, through a literature review we define the theoretical framework for examining the different consequence chain variables. Secondly, we establish the methodology used in the empirical research and evaluate the results obtained. Finally, we report the most significant conclusions which can be drawn from this study.
2. Theory development and hypotheses
2.1 Logistics service quality
Since the mid-1980s, service quality has been a priority theme in both marketing and logistics research, running parallel to the interest in quality, quality management and satisfaction in companies (Fisk et al., 1993; Shet et al., 2006; Richey et al., 2007). Research by Millenet al.(1999) identifies significantly improved customer satisfaction as a key benefit of LSQ. On these lines, research in Spain by Va´zquez Casielleset al.
(2002, p. 40) confirms that quality in supplier physical distribution activities has the greatest influence on customer satisfaction.
The notion of LSQ has been studied from two different perspectives: objective and subjective quality. The first approach relates quality with adapting the service to service provider defined specifications (Crosby, 1991). This industrial view of service sees quality as an accurate evaluation of all the stages and operations necessary to
LSQ: a new way
to loyalty
deliver the service, likening the process to that of manufacturing a product by considering the service as a physical object which can be observed and with attributes that can be evaluated (Garvin, 1984). The second approach transfers evaluation of quality to the customer, that is subjective quality. From this perspective, service quality is “a global judgment or attitude, concerning the superior nature of the service” (Parasuramanet al., 1988, p. 16).
In the sphere of logistics service, the contribution from Bienstock et al. (1997), includes this development by identifying objective variables measured through customers’ perceptions in relation to their expectations (subjective components) as the main components of LSQ. More recent studies (Millen and Maggard, 1997; Sohalet al., 1999; Mentzeret al., 2001), contribute to this line by considering LSQ as the difference between the expected and the perceived service. This subjective character makes quality highly relative and volatile in nature as it varies in time and space (Holbrock and Corfman, 1985).
In terms of modeling and measurement proposals, there are two schools in the literature, the Nordic and the American. The former differentiates two components in service quality (Gro¨nroos, 1982):
(1) technical quality expressed as the service being technically acceptable and leading to a concrete result; and
(2) functional quality which includes the way the customer is treated during the service provision process.
Later work by Rust and Oliver (1994) adds a third component: the service environment. The American school has predominantly used the SERVQUAL scale to measure and dimension service quality. This multi-item scale evaluates five quality dimensions from a global perspective (Parasuramanet al., 1988):
(1) reliability; (2) reactivity; (3) guarantee/safety; (4) empathy; and (5) tangible elements.
According to this model, perceived quality is measured by the imbalance between two separate scales, one measuring expectations and the other the perception of the result. Later revisions of the scale, however, led Cronin and Taylor (1994) to reject measurement of expectations and consider only the result measurement scale (SERVPERF). The debate is ongoing, although in the sphere of logistics specific measurement models are being developed on the basis of the above models, but adapted to the special features of logistics service. These features include in particular the fact that the people object of the service are replaced by “things” (objects, materials, products, ...) and the physical separation of customer and supplier. We would
underline two important contributions from Bienstocket al.(1997) and Mentzeret al.
(1999). The former developed a specific model known as physical distribution service quality, based on result, rather than on functional or process dimensions. Mentzeret al.(1999) carried out a study to confirm the accuracy of the model developed by Bienstocket al.(1997) with an integral logistics focus. This revision and validation
IMDS
108,5
provided a new multidimensional model which they called LSQ. Analysis of these and other significant contributions (Novack et al., 1994; Anderson et al., 1994; Rutner and Langley, 2000; Stank et al., 2003; Richey et al., 2007; Rafid and Jaafar, 2007) has allowed us to identify a set of dimensions for measuring LSQ (timeliness, condition and accuracy of the order, quality of information, availability and quality of contact personnel). Of all these dimensions, timeliness has the greatest influence (La Londe and Zinszer, 1991; Perrault and Russ, 1974; Novack et al., 1994; Bienstock et al., 1997; Mentzeret al., 2001), and is understood to mean reception of the order placed by the customer at the agreed moment (Mentzeret al., 2001). A more recent study (Rahman, 2006) confirms these results, showing that the most important component is “on time delivery.”
2.2 Satisfaction and loyalty in inter-company relationships
We now proceed to analyze the main consequences of quality delivery which are satisfaction and loyalty. There is a long research tradition into both these concepts which gives different nuances to their conceptualization. Satisfaction has been studied with a dual process-result focus and is defined by some authors (Hunt, 1977; Westbrook, 1980) as a process of evaluating or measuring a purchase experience where expectations are compared with the result. Other authors relate satisfaction to process result, in other words to the response or state of the customer considering consumption of the product. This response may be cognitive (Howard and Sheth, 1969; Churchill and Surprenant, 1982; Day, 1984), with satisfaction as the result of a consumption experience in which the consumer cognitively evaluates the variables (expectations and results, effort and reward) or satisfaction may be affective (Woodruff and Gardial, 1996; Giese and Cote, 2000; Vanhamme and Snelders, 2001; Eggert and Ulaga, 2002) and reflect the feelings of the consumer or the company (Anderson and Narus, 1984) in terms of product enjoyment. The most useful theoretical basis for explaining the process which leads to judgments of satisfaction has proved to be the disconfirmation of expectations paradigm based on evaluating or measuring certain variables, mainly the perception of the results (performance) and certain comparison standards. Analysis of the most recent contributions shows a certain convergence towards understanding satisfaction as a phenomenon linked to cognitive judgments and affective responses (Oliveret al., 1997; Phillips and Baumgartner, 2002; Wirtz and Bateson, 1999). Some studies share this dual focus, assuming that satisfaction is an affective response arising from a cognitive judgment (Halsteadet al., 1994; Giese and Cote, 2000; Yu and Dean, 2001).
Satisfaction can also be interpreted from the point of view of a specific transaction or from an accumulative view (Bouldinget al., 1993). Most approaches in the literature use the first perspective (Giese and Cote, 2000), although proposals like those by Fornell et al. (1996) and Anderson et al. (1994) consider satisfaction as a global evaluation based on consumption experience over time or on a set of similar experiences. More recent contributions adopt this last approach in the wide sense supporting the idea of satisfaction as “a global measurement of a set of satisfactions with specific prior experiences” (Yu and Dean, 2001, p. 235). According to Jones and Suh (2000), satisfaction defined from this point of view would explain behavioral intentions better.
Finally, the consequence chain closes with loyalty. The literature coincides in pointing to loyalty as the “sine qua non of an effective business strategy” (Heskett,
LSQ: a new way
to loyalty
2002, p. 355), pointing out that delivering quality and achieving satisfaction can be the basis for developing said relationship (Rauyruen and Miller, 2007), so that it is possible to speak of a conceptual quality-satisfaction-loyalty network. The link between the last two items, however, is asymmetric so that although consumers are normally satisfied, satisfaction does not universally translate into loyalty (Oliver, 1999). It is true though, that while satisfaction influences loyalty, there are other determining factors and predictors of loyalty which are not included in the conceptual structure of satisfaction.
The literature review allowed us to identify two different approaches to the conceptual definition of loyalty. One view is that loyalty is simply another word for expressing customer retention: “a customer who continues to buy is a loyal customer” (Buttle and Burton, 2002, p. 218). Another view is that customer loyalty has an affective component where feelings are important. Research into loyalty has thus developed from the perspective of effective, evident behavior which implies repeat purchase/consumption or from the perspective of attitude (Dick and Basu, 1994; de Ruyteret al., 1998; Oliver, 1999). These two perspectives can be reconciled through the definition offered by Gremler and Brown (1996, p. 173):
[...] loyalty is the degree to which a customer shows repeat purchase behavior towards a
supplier, is positively disposed towards the supplier and considers using only this supplier when he needs that service.
These conceptual differences have given rise to different measurements for loyalty. Behaviorally, loyalty is understood to be the degree of customer repeat purchase from a service provider and some typical measurements used are repurchase rate, purchase behavior in a period of time and so on (Martı´nez-Ribeset al., 1999); measurements with more affinity to the affective perspective are based on intention to frequent a service supplier, continuing to purchase the same type of service or brand in the future, recommendation, and so on. The latter approach to measuring loyalty has been widely accepted after the proposal by Zeithaml et al. (1996). Specifically, in the logistics context, different contributions clearly show the importance (Innis and La Londe, 1994; Daughertyet al., 1998; Stanket al., 2003) and direct, positive influence of satisfaction on loyalty.
2.3 Logistics function and ICT
Finally, we have study the influence of ICT on the consequence chain described above. The use of ICT in logistics has been truly revolutionary (Christopher, 1992; Novack et al., 1992; Closs and Xu, 2000; Ballou, 2004), especially in terms of improving LSQ for the customer. Rather than merely evolving, the concept of logistics has been revolutionised, especially in terms of inter-company relationships (Parasuraman and Grewal, 2000; Chen and Dwivedi, 2007), to the extent that the conceptual structure has been redesigned to include information technologies which facilitate information gathering, processing and distribution so that decision taking can be improved both internally (Lewis and Talalayevsky, 1997) and in the supply chain (Angeles, 2000).
This very recent relevance of ICT, has led us to include them in this study in order to verify any moderator effect they may have on the quality-satisfaction-loyalty consequence chain.
IMDS
108,5
Information management, as Lewis and Talalayevsky (1997) suggest, does not have to follow the same structure as the physical flow. ICT can be used to shorten the channel and reduce intermediaries, generating direct contact with customers in terms of information and communication (Sua´rez A´ lvarezet al., 2004). This shortening of the channel improves communication speed, reducing information transmission costs (Christopher, 1992). Differentiated management of the information flow and the physical flow makes it possible to optimize each of them independently and improve company productivity. Differentiated information management is done through what is known as the logistics information system (LIS). LIS is defined as “the interactive structure composed of people, teams, methods and controls which together, give the information management needs to form a basis for decision making on planning, implementation and control” (Casanovas and Cuatrecasas, 2001, p. 191). The importance of LIS lies in its capacity to transform data into useful and relevant information to facilitate decision making in business management (Introna, 1993).
The external dimension of information management is one of the most relevant characteristics of ICT logistics. The logistics function has a clear inter-company nature to the extent that it interacts with other agents in the supply chain such as suppliers and customers (Bowersox and Closs, 1996; Morashet al., 1997; Ballou, 2004) and this interaction is even greater when logistics activities are subcontracted (Dura´net al., 2001). The need to interact externally makes gathering and transmitting information beyond the limits of the organization essential. It is a question of creating inter-organizational information systems to improve a company’s competitiveness by sharing updated information (Sa´nchez Ferna´ndez, 2002).
From the literature review, we have extracted the most widely applied ICT in logistics and in particular those used to improve LSQ. We especially note the following (Taylor Nelson Sofres, 2001; Feng and Yuan, 2006):
. Enterprise resource planning business software which allows companies to plan and control all the resources required for collecting, making, sending and entering customer orders in production, distribution and service companies (Edwardset al., 2001; Manetti, 2001; Huanget al., 2008).
. Material resources planning software used to optimize material needs planning (Bardiet al., 1994).
. Electronic data interchange which is the telematic transmission of information in a standardized format from one company’s computer application to another company’s system, without the need for manual intervention, through a third party-managed network (Bath, 2001; Martı´nez Sa´nchez and Pe´rez Pe´rez, 2004; Leonard and Davis, 2006).
. Technologies for optimizing transport such as GPS and route planning software. In our study, intensity of technology use is taken to be an indicator of ICT intensity in the companies analyzed.
Based on the above contributions in this conceptual framework, we define the following research hypotheses:
H1. LSQ has a direct, positive effect on customer satisfaction.
H2. Customer satisfaction has a direct, positive effect on loyalty.
LSQ: a new way
to loyalty
H3. The effect of LSQ is greater when ICT intensity in the supplier-customer relationship is high.
H4. The effect of satisfaction on loyalty is greater when ICT intensity in the supplier-customer relationship is high.
3. Research methods
The literature review has made it possible to offer a conceptual definition of the variables being studied here and establish the best scales for evaluating them, thus providing guidelines for designing the empirical research.
The research started by identifying the companies to be studied. In a second stage, a qualitative study was done which provided a first proposal for a questionnaire. The questionnaire was evaluated by a pre-test which enabled some of the scales to be purged. The final proposal was an ad hoc questionnaire which permitted data collection by means of personal interviews in field work carried out between May and June 2004. The sample consisted in 194 companies, which were contacted by telephone to arrange a meeting for the personal interview.
A first characterization of the companies examined shows large sized companies with an average turnover of e32 million and over 200 employees and an average
ICT investment of 0.5 percent of the total turnover, spanning all sectors of business in the Valencian region. This characterization agrees with the results reported by Chuang et al. (2007) which identify company size as a key factor in ICT adoption.
3.1 Developing the measurement scales
We analyzed contributions from different authors in order to identify measurement scales for the variables in our study. In relation to the variable LSQ, the literature review showed that the measurement scale developed by Mentzer et al. (2001) has been used repeatedly and is up-to-date. Our evaluation proposal is based on that scale (Table I). However, given that various works identify “timeliness” as the most significant dimension in LSQ (La Londe and Zinszer, 1991; Perrault and Russ, 1974; Novack et al., 1994; Bienstock et al., 1997; Mentzer et al., 2001), we decided it should be retained as an independent variable in the model in order to verify its specific effect on satisfaction and compare it with the effect of the other LSQ dimensions.
Analysis of the different contributions has suggested a scale for evaluating satisfaction (Table I) based on a minor adaptation of Stank et al. (2003) which is a current piece of research focusing on inter-company logistics service and has been used before (Daughertyet al., 1998). Finally, our proposal for measuring loyalty (Table I) is based mainly on the contribution by Zeithamlet al.(1996) based on evaluating loyalty as behavioral intention.
3.2 Measurement model results
The different scales in this study were dimensioned using exploratory factor analysis with varimax rotation using the eigenvalues greater than 1 criterion. The LSQ scale extracted two factors, presenting a total accumulated variability of 58.60 percent. The scales for satisfaction and loyalty were unidimensional, with an explained variance of 86.37 percent for satisfaction and 74.02 percent for loyalty.
IMDS
108,5
Author Dimensions Items Mean SD
Logistics service quality
Adapted from Mentzeret al.(2001)
Dim. 1. Personnel quality, information quality and order quality
QS1. The contact person appointed by the supplier
makes an effort to understand my position 4.06 0.66
QS2. The product knowledge/experience of the firm’s
personnel is adequate 4.19 0.62
QS3. The information about the order is available
and appropriate for its purpose 4.18 0.62
QS4. Ordering procedures are effective and easy to
use 4.36 0.69
QS5. Products ordered from the firm meet technical
requirements 4.34 0.61
QS6. If a problem arises. it is solved in a satisfactory
form 4.26 0.64
Dim. 2. Timeliness QS7. Time between placing an order and receiving
delivery is short 3.82 0.86
QS8. Deliveries arrive on the date promised 3.83 0.76
QS9. Orders not delivered in time are subsequently
sent quickly 4.07 0.73
QS10. The supplier organizes efficiently the logistics
management of product return (reverse logistics) 3.63 0.8
Satisfaction Adapted from
Stanket al.(2003) and Zeithamlet al.(1996)
SA1. We are delighted with the overall distribution service relationship with them 3.97 0.79
SA2. We wish more of our suppliers were like this one 3.72 0.91
Loyalty L1. Consider this supplier your first choice to buy these services 3.99 0.75
L2. If all the other attributes are similar (price, product, quality,...), we will buy
always to this supplier by their logistics service 3.59 0.91
Table
I.
Scales
used
to
evaluate
the
different
variables
LSQ:
a
new
way
to
loyalty
With regard to reliability of subscales (acoefficient for the two multi-item dimensions of LSQ was 0.821 and 0.790) and scales (a coefficient for the satisfaction scale was 0.837 and loyalty was 0.739), all the coefficients exceed the minimum recommended threshold of 0.7 (Nunnally, 1987) and so we can confirm initial scale reliability.
Then we went on to confirm scale dimensionality before verifying the causal relations using confirmatory factor analysis and EQS 6.1 statistical software. This analysis enabled us to include theoretical and statistical considerations in developing the scales following Anderson and Gerbing (1988). The confirmatory model was estimated using the robust maximum likelihood method (Bentler, 1995).
The results obtained in estimating the measurement model show that the variables measured converge perfectly towards the factors established in the exploratory factor analysis, as all the measurement parameters are significant (Table II).
Construct validity of the scales was analyzed by studying convergent and divergent validity. Convergent validity shows the degree to which two or more attempts to measure the same concept agree. To measure this relationship in unidimensional factors, the variables must have significant, high weighting (Anderson and Gerbing, 1988). Validity was therefore checked through standardized loads for each dimension (Table II). Saturations were almost always above 0.5 and all the t-student statistic associated values were significant at 5 percent. We can therefore conclude that the scale has convergent validity (Anderson and Gerbing, 1988; Steemkamp and van Trijp, 1991).
To verify discriminant validity of the measurement scales, we calculated the square of linear correlations between each pair of scales, to see if this was lower than the level of variance extracted from each of them. Correlations between the different scales (standardized covariances between factors) show evidence of discriminant validity as values are well below eigenvalue (lower than 0.8). After squaring, they are almost all lower than the extracted variance. In addition, confidence levels between parameters (Table I) which indicate correlation between latent factors are sufficiently below the eigenvalue to guarantee discriminant validity of the latent variables or scales (Anderson and Gerbing, 1988).
Finally, Table II shows the quality indexes for the fit of the measurement model with highly satisfactory levels of fit.
4. Discussion and implications of the structural model
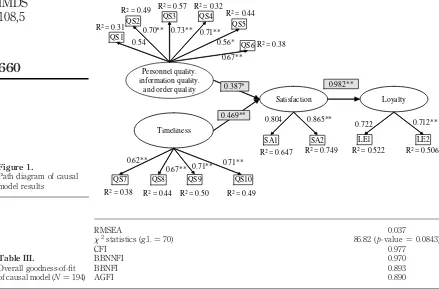
Our main interest is to contrast the LSQ-satisfaction-loyalty consequence chain in the logistics sphere and examine the moderator effect of ICT intensity. Thus, after verifying scale psychometric properties and before the multi-sample analysis we focused on estimating the causal relationships considered in the hypotheses for the consequence chain. With regard to these estimates for the causal relationships (Figure 1), the results obtained for the first two hypotheses for the model under consideration allow us to state that there is a clear, positive and significant influence of personnel, information and order quality on satisfaction. Similarly, satisfaction is positively and significantly dependent on timeliness. Furthermore, in terms of the satisfaction-loyalty relationship, the results show that satisfaction has a direct, significant influence on the consequent variable loyalty. All the coefficients are significant at 99 percent and so we can verify the hypotheses considered for the sample as a whole (H1andH2). Finally, it should be noted that the indexes for model fit (Table III) are satisfactory and so we can state that our results are robust.
IMDS
108,5
Dimensions Items
Standardized loadings
l(t-student)
Composed reliability in percent
AVE in percent
Discriminant validity (IC 95 percentage correlations)
Personnel quality, information quality, and order quality
QS1 0.564 80.16 52.44 QS1-QS2 (0.725; 0.845)
QS2 0.699 (5.61*) QS1-SAT (0.681; 0.805)
QS3 0.748 (5.11*) QS1-LE (0.722; 0.838)
QS4 0.706 (4.68*) QS2-SAT (0.620; 0792)
QS5 0.562 (5.82*) QS2-LE (0.615; 0.759)
QS6 0.665 (5.69*) SAT-LE (0.701; 0.877)
Timeliness QS7 0.611 80.16 50.34
QS8 0.672 (9.88*)
QS9 0.706 (8.88*)
QS10 0.706 (7.29*)
Satisfaction SA1 0.804 81.85 69.30
SA2 0.860 (12.55*)
Loyalty L1 0.726 81.85 69.30
L2 0.708 (6.94*)
Overall goodness-of-fit
RMSEA ¼0.033;x2satistics (g.l.¼68)¼81.05 (p-value¼ 0.133); CFI¼ 0.982; BBNNFI¼ 0.976; BBNFI¼ 0.900; AGFI¼ 0.894
Note:Sat. (g.l.¼68)¼81.05 (*p-value¼0.133)
Table
II.
Dimensionality,
reliability
and
validity
of
the
scales
LSQ:
a
new
way
to
loyalty
After verifying the proposed causal relations we then verified the moderator role of ICT intensity in the relations defined between LSQ, satisfaction and loyalty.
Generally, a moderator “is a qualitative or quantitative variable which affects the direction or intensity of the relation between a predictive or independent variable and a dependent variable or criterion” (Baron and Kenny, 1986, p. 1174). In our research scenario, we felt it was appropriate to distinguish between companies with the highest ICT intensity scores and those with the lowest, defining two groups of companies with above average and below average ICT intensity. By differentiating two levels of ICT intensity, we were able to measure the effect of the preceding variable in the consequent variable through the estimated parameters for the causal relationships and thus test the difference between said coefficients – g and b according to LISREL notation – using an appropriate moderation test (Baron and Kenny, 1986). The subgroups were therefore analyzed to test the moderator effect of ICT intensity in the analyzed variables. In this way, we attempted to show if high- and low-ICT intensity influence the perception of service quality measured through the 2D identified – timeliness and personnel, information and order quality – and how this can affect customer satisfaction and loyalty.
(¼2.96) on a five-item scale – taking the most representative ICT in the logistics field as reference (reliability Cronbach’saof the ICT scale is 0.760). This index or variable criterion allowed us to segment the sample to give one segment of 93 companies with a low-technology intensity and a second segment with 101 companies with above average technology intensity. This has been corroborated through the average differences described in Table IV, which shows that the average values for the items on the ICT scale are significantly higher in the companies with higher intensity in comparison to the companies in the first segment.
Based on these differences, we carried out a multi-sample analysis using EQS 6.1 statistical software (Bentler, 1995) following the methodological recommendations proposed by Jaccard and Wan (1996).
The first step consists in estimating the parameters which define the different causal relations for each of the two groups and a goodness-of-fit measurement for the global model for both groups. This multi-group solution is shown in Table V.
The multi-sample analysis shows that the causal relations between both groups do not reveal themselves in the same way. As Table IV shows, according to global estimates for each of the groups in the variables for the service quality, satisfaction and loyalty scales, companies with above average ICT intensity show slightly stronger relations in the first dimension of service quality and in the satisfaction-loyalty relationship responding to the hypotheses proposed for the moderator effect. That is to say, that while personnel, information and order quality do not significantly influence satisfaction in the group of companies with low-ICT intensity, they do show significant
Low-ICT
Logistics information systems (LIS) TIC1 2.66 (1.13) 3.81 (1.12) 27.80* Material requirements planning (MRP) TIC2 2.95 (1.20) 3.94 (0.93) 27.18*
Enterprise resource planning (ERP) TIC3 2.67 (1.21) 4.04 (0.86) 28.12*
Electronic data interchange (EDI) TIC4 1.58 (0.88) 3.29 (1.47) 28.44*
Information technology to optimise
the transport system TIC5 1.64 (0.89) 2.94 (1.19) 27.21*
Note:*Difference is significant at the 0.01 level
Table IV. Means scores of use of ICT between groups firms
Estimated value (t-student) Low-ICT
Personnel quality, information quality, and order quality-satisfaction 0.569 (1.286) 0.787 (1.985)
Timeliness-satisfaction 0.761 (2.832) 0.390 (1.107)
Satisfaction-loyalty 0.556 (3.946) 1.026 (7.322)
(Overall goodness-of-fit)
RMSEA¼ 0.034;x2statistics (g.l.138)¼166.476 (p-valor ¼0.049); CFI ¼0.962; BBNNFI¼ 0.949; BBNFI¼ 0.819; AGFI¼ 0.810
influence in the group of companies with higher ICT intensity. Timeliness, however, has the opposite effect, significantly influencing the consequent variable satisfaction only in the group of companies with low-ICT intensity.
In order to check for significant differences between the causal parameter estimations, we estimated the proposed model again, introducing the restriction as null hypothesis which establishes that regression coefficients in a structural model (gandb
according to LISREL notation) are the same in the two groups (Iglesias and Va´zquez, 2001). In this second stage and thanks to the Lagrange multiplier test (Imtest), significant differences can be observed between the parameters for both subsamples. That is, we can verify that eliminating restrictions causes significant change in x2
statistic, which would mean rejecting the equal parameter restriction as model fit would be significantly improved if it were eliminated (Table VI).
The statistic associated to x2 for each of the restrictions shows that only the restriction between satisfaction and loyalty has a positive affect on model fit. We can therefore state that ICT intensity has a positive influence on the relationship between satisfaction and loyalty in the logistics sphere (H4), but not in the other relationships considered. These results therefore, confirm that ICT intensity moderates the effect of satisfaction on loyalty.
5. Conclusions, managerial implications and future research
In this paper, we aimed to analyze the LSQ-satisfaction-loyalty consequence chain in the sphere of inter-company relationships and research the moderator effect of ICT in the proposed relationships.
From the conceptual point of view and after reviewing progress in the main lines of research into LSQ, we identified timeliness as the most significant dimension together with personnel, information and order quality. We therefore approached the analysis of quality from its two basic components. The literature review also allowed us to propose a relationship model which begins with LSQ and ends with loyalty through satisfaction. The results of the empirical research on a sample of 194 Spanish, mainly manufacturing companies, show that LSQ-associated to timeliness and personnel, information and order quality, has a clear, positive and significant influence on satisfaction and loyalty shown by customer companies. In addition, the results suggest that ICT logistics intensity in the supplier-customer relationship moderates the effect of the proposed links between the variables. Thus, we can conclude that in situations of high-ICT intensity the effect of the predictors, personnel, information, order quality and satisfaction on loyalty is intensified. Here, slightly stronger relationships are evident in the first dimension of service quality and especially in the satisfaction-loyalty relationship.
This work also shows that this chain of effects exists around logistics service and underlines the significance and ability of ICT to affect relationship intensities between these variables. In particular, ICT improve the quality of the logistics service offered to customers.
Constraints Gl x2difference p-Value
Personnel quality, information quality, and order quality-satisfaction 1 0.006 0.939
Timeliness-satisfaction 1 0.018 0.894
Satisfaction-loyalty 1 3.964 0.046
Table VI.
Results of multigroup analysis
IMDS
108,5
These conclusions offer a series of managerial implications. Firstly, companies should invest in ICT to improve information flow management both internally and throughout the supply chain. This is because, as we have shown, improved information management is a key factor in improving LSQ for the customer. This, in turn, has an impact on customer satisfaction and loyalty towards the company. Secondly, companies who wish to improve the quality of their customer service must attend particularly to improving the order process, making it easier and complying with the delivery terms agreed with the customer. Finally, this study has shown the important role of customer contact personnel in customer satisfaction. Therefore, companies should provide employees with the training and resources necessary to provide good customer service. In future works, we intend to study the importance of the human factor in B2B relationships in greater depth.
References
Anderson, E.W., Fornell, C. and Lehrmann, D.R. (1994), “Customer satisfaction, market share, and profitability: findings from Sweden”,Journal of Marketing, Vol. 58, pp. 53-66. Anderson, J.C. and Narus, J.A. (1984), “A model of the distributor’s perspective of distributor
– manufacturer working relationships”,Journal of Marketing, Vol. 48 No. 4, pp. 62-74. Anderson, J.C. and Gerbing, D.W. (1988), “Structural equation modeling in practice: a review and
recommended two-step approach”,Psychological Bulletin, Vol. 103 No. 3, pp. 411-23. Angeles, R. (2000), “Revisiting the role of internet-EDI in the current electronic commerce scene”,
Logistics Information Management, Vol. 13 No. 1, pp. 45-57.
Ballou, R.H. (2004),Logı´stica. Administracio´n de la cadena de suministro, Prentice-Hall, Pearson Educacio´n, Me´jico.
Bardi, E.J., Raghunathan, T.S. and Bagchi, P.K. (1994), “Logistics information systems: the strategic role of top management”,Journal of Business Logistics, Vol. 15 No. 1, pp. 71-85. Baron, R.M. and Kenny, D.A. (1986), “The moderator-mediator variable distinction in social psychological research: conceptual, strategic, and statistical considerations”,Journal of Personality and Social Psychology, Vol. 51 No. 6, pp. 1173-82.
Bath, G.D. (2001), “Business process improvement through electronic data interchange (EDI) systems: an empirical study”,Supply Chain Management, Vol. 6 No. 2, pp. 60-73. Bentler, P. (1995), EQS Structural Equations Program Manual, Multivariate Software,
Encino, CA.
Bienstock, C.C., Mentzer, J.T. and Bird, M.M. (1997), “Measuring physical distribution service quality”,Journal of the Academy of Marketing Science, Vol. 25 No. 1, pp. 31-44.
Boulding, W., Kalra, A., Staelin, R. and Zeithaml, V.A. (1993), “A dynamic process model of service quality: from expectations to behavioral intentions”, Journal of Marketing Research, Vol. 30, pp. 7-27.
Bowersox, D.J. and Closs, D.J. (1996), Logistical Management: The Integrate Supply Chain Management, McGraw-Hill, London.
Buttle, F. and Burton, J. (2002), “Does service failure influence customer loyalty?”,Journal of Consumer Behavior, Vol. 1 No. 3, pp. 217-27.
Casanovas, A. and Cuatrecasas, L. (2001),Logı´stica Empresarial, Gestio´n 2000, Barcelona. Chapman, R.L., Soosay, C. and Kandampully, J. (2003), “Innovation in logistic services and the
new business model”, International Journal of Physical Distribution & Logistics Management, Vol. 33, pp. 630-50.
LSQ: a new way
to loyalty
Chen, H. and Dwivedi, Y.K. (2007), “Conceptualising the relationship between integration needs and integrations technologies adoption: comparing cases of SMEs with a large organisation”,International Journal of Management and Enterprise Development, Vol. 4 No. 4, pp. 459-76.
Christopher, M. (1992),Logistics & Supply Chain Management, Pitman Publishing, London. Chuang, T., Rutherford, M. and Lin, B. (2007), “Owner/manager characteristics, organisational
characteristics and IT adoption in small and medium enterprises”,International Journal of Management and Enterprise Development, Vol. 4 No. 6, pp. 619-34.
Churchill, G.A. and Surprenant, C. (1982), “An investigation into the determinants of customer satisfaction”,Journal of Marketing Research, Vol. 19, pp. 491-504.
Closs, D.J. and Xu, K. (2000), “Logistics information technology practice in manufacturing and merchandising firms – an international benchmarking study versus world class logistics firms”, International Journal of Physical Distribution & Logistics Management, Vol. 30 No. 10, pp. 869-79.
Cronin, J.J. and Taylor, S.A. (1994), “SERVPERF versus SERVQUAL: reconciling performance-bases and perceptions minus expectation measurement of service quality”, Journal of Marketing, Vol. 58, pp. 125-31.
Crosby, P. (1991),La calidad no cuesta. El arte de cercionarse de la calidad, CECSA, Me´jico. Daugherty, P.J., Stank, T.P. and Ellinger, A.E. (1998), “Leveraging logistics/distributions
capabilities: the effect of logistics service on market share”,Journal of Business Logistics, Vol. 19 No. 3, pp. 35-51.
Day, R.L. (1984), “Modeling choices among alternative responses to dissatisfaction”,Advances in Customer Research, Vol. 11, pp. 496-9.
de Ruyter, K., Wetzels, M. and Bloemer, J. (1998), “On the relationship between perceived service quality, service loyalty and switching costs”, International Journal of Service Industry Management, Vol. 9 No. 5, pp. 436-53.
Dick, A. and Basu, K. (1994), “Customer royalty: toward an integrated conceptual framework”, Journal of the Academy of Marketing Science, Vol. 22 No. 2, pp. 99-113.
Dura´n, A., Gutie´rrez, G. and Sa´nchez, T. (2001), La logı´stica y el comercio electro´nico, McGraw-Hill, Madrid.
Edwards, P., Peters, M. and Sharman, G. (2001), “The effectiveness of information systems in supporting the extended supply chain”,Journal of Business Logistics, Vol. 22 No. 1, pp. 1-28. Eggert, A. and Ulaga, W. (2002), “Customer perceived value: a substitute for satisfaction in business markets?”, The Journal of Business & Industrial Marketing, Vol. 17 Nos 2/3, pp. 107-18.
Feng, C-M. and Yuan, C-Y. (2006), “The impact of information and communication technologies on logistics management”,International Journal of Management, Vol. 23 No. 4, pp. 909-24. Fisk, R.F., Brown, S.W. and Bitner, M.J. (1993), “Teaching the evolution of services marketing
literature”,Journal of Retailing, Vol. 69 No. 1, pp. 61-103.
Foggin, J.H., Mentzer, J.T. and Monroe, C.L. (2004), “A supply chain diagnostic tool”, International Journal of Physical Distribution & Logistics Management, Vol. 34 No. 10, pp. 827-55.
Fornell, C., Johnson, M.D., Anderson, E.W., Cha, J. and Bryant, B.E. (1996), “The American customer satisfaction index: nature, purpose, and findings”,Journal of Marketing, Vol. 60 No. 4, pp. 7-18.
Garvin, D.A. (1984), “What does product quality really mean”,Sloan Management Review, Vol. 26 No. 1, pp. 25-43.
IMDS
108,5
Giese, J.L. and Cote, J.A. (2000), “Defining cosumer satisfaction”,Academy of Marketing Science Review, Vol. 1, pp. 1-34.
Gremler, D.D. and Brown, S.W. (1996), “Service loyalty: its nature, importance and implications”, Citado en Gilet al.(2004).
Gro¨nroos, C. (1982), “An applied service marketing theory”,European Journal of Marketing, Vol. 16 No. 7, pp. 30-41.
Halstead, D., Hartman, D. and Schmith, S.L. (1994), “Multisource effects on the satisfaction formation process”,Journal of the Academy of Marketing Science, Vol. 22 No. 2, pp. 114-29. Heskett, J.L. (2002), “Beyond customer loyalty”,Managing Service Quality, Vol. 12 No. 6, pp. 355-7. Holbrock, M.B. and Corfman, K.P. (1985), “Quality and value in the consumption experience: phaedrus rides again”, in Jacoby, J. and Olson, J.C. (Eds), Perceived Quality. How Consumers View Stores and Merchandise, Lexington Books, Lexington, MA, pp. 31-57. Howard, J.A. and Sheth, J.N. (1969),The Theory of Buyer Behavior, Wiley, New York, NY. Huang, S., Hsieh, P., Tsao, H. and Hsu, P. (2008), “A structural study of internal control for ERP
system enviroments: a perspective from the Sarbanes-Oxley act”,International Journal of Management and Enterprise Development, Vol. 5 No. 1, pp. 102-21.
Hunt, H.K. (1977), “CS/D overview and future research directions”, in Hunt, H.K. (Ed.), Conceptualization and Measurement of Customer Satisfaction and Dissatisfaction, Marketing Science Institute, Cambridge, MA, pp. 455-88.
Iglesias, V. and Va´zquez, R. (2001), “The moderating effects of exclusive dealing agreements on distributor satisfaction”,Journal of Strategic Marketing, Vol. 9 No. 3, pp. 215-31. Innis, D.E. and La Londe, B.J. (1994), “Costumer service: the key to customer satisfaction,
customer loyalty, and market share”,Journal of Business Logistics, Vol. 15 No. 1. Introna, L.D. (1993), “The impact of information technology on logistics”,Logistics Information
Management, Vol. 6 No. 2, pp. 37-47.
Jaccard, J. and Wan, C.K. (1996),Lisrel Approach to Interaction Effects in Multiple Regression, Sage, Thousand Oaks, CA.
Jones, M.A. and Suh, J. (2000), “Transaction-specific satisfaction and overall satisfaction: an empirical analysis”,Journal of Services Marketing, Vol. 2, pp. 147-59.
Knemeyer, A.M. and Murphy, P.R. (2004), “Evaluating the performance of third-party logistics arrangements: a relationship marketing perspective”, Journal of Supply Chain Management, Vol. 40 No. 1, pp. 35-51.
Knemeyer, A.M. and Murphy, P.R. (2005), “Exploring the potential impact of relationship characteristics and customer attributes on the outcomes of third party logistics arrangements”,Transportation Journal, Vol. 44 No. 1, pp. 5-19.
La Londe, B.J. and Zinszer, P.H. (1991), “Customer service: meaning and measurement”, in Ballou, R. (Ed.),Logı´stica empresarial, control y planificacio´n, Ediciones Dı´az de Santos, Madrid.
Lambert, D.M., Knemeyer, A.M. and Gardner, J.T. (2004), “Supply chain partnerships: model validation and implementation”, Journal of Business Logistics, Vol. 25 No. 2, pp. 21-42.
Leonard, L.N.K. and Davis, C.C. (2006), “Supply chain replenishment: before-and-after EDI implementation”,Supply Chain Management: An International Journal, Vol. 11 No. 3, pp. 225-32.
Lewis, I. and Talalayevsky, A. (1997), “Logistics and information technology: a coordination perspective”,Journal of Business Logistics, Vol. 18 No. 1, pp. 141-57.
LSQ: a new way
to loyalty
Manetti, J. (2001), “How technology is transforming manufacturing”,Productions and Inventory Management Journal, Vol. 42 No. 1, pp. 54-64.
Martı´nez-Ribes, J.M., de Borja, L. and Carvajal, P. (1999),Fidelizando clientes. Detectar y mantener al cliente leal, EADA Gestio´n. Gestio´n 2000, Barcelona.
Martı´nez Sa´nchez, A. and Pe´rez Pe´rez, M. (2004), “EDI and cooperation in the supply chain: an empirical study in the Spanish automotive supply chain”, International Journal of Automotive Technology and Management, Vol. 4 No. 1, pp. 74-83.
Mentzer, J.T., Flint, D.J. and Hult, T.M. (2001), “Logistics service quality as a segment-customized process”,Journal of Marketing, Vol. 65 No. 4, pp. 82-104.
Mentzer, J.T., Flint, D.J. and Kent, J.L. (1999), “Developing a logistics service quality scale”, Journal of Business Logistics, Vol. 20 No. 1, pp. 9-32.
Mentzer, J.T., Myers, M.B. and Cheung, M-S. (2004), “Global market segmentation for logistics services”,Industrial Marketing Management, Vol. 33, pp. 15-20.
Millen, R. and Maggard, M. (1997), “The change in quality practices in logistics: 1995 versus 1991”,Total Quality Management, Vol. 8 No. 4, pp. 173-9.
Millen, R., Sohal, A. and Moss, S. (1999), “Quality management in the logistics function: an empirical study”,The International Journal of Quality & Reliability Management, Vol. 16 No. 2, pp. 166-80.
Morash, E.A., Droge, C. and Vickery, S. (1997), “Boundary-spanning interfaces between logistics, production, marketing, and new product development”,International Journal of Physical Distribution & Logistics Management, Vol. 27 No. 2, pp. 350-69.
Novack, R.A., Rinehart, L.M. and Langley, C.J. (1994), “An internal assessment of logistics value”, Journal of Business Logistics, Vol. 15 No. 1, pp. 113-52.
Novack, R.A., Rinehart, L.M. and Wells, M.V. (1992), “Rethinking concept foundations in logistics management”,Journal of Business Logistics, Vol. 13 No. 2, pp. 233-67.
Nunnally, J.C. (1987),Teorı´a Psicome´trica, Trillas, Me´xico.
Oliver, R.L. (1999), “Whence consumer loyalty?”,Journal of Marketing, No. 63, pp. 33-44. Oliver, R.L., Rust, R.T. and Varki, S. (1997), “Customer delight: foundations findings, and
managerial insight”,Journal of Retailing, Vol. 73 No. 3, pp. 311-36.
Parasuraman, A. and Grewal, D. (2000), “The impact of technology on the quality-value-loyalty chain: a research agenda”, Journal of Academy of Marketing Science, Vol. 28 No. 1, pp. 168-74.
Parasuraman, A., Zeithaml, V.A. and Berry, L.L. (1988), “SERVQUAL: a multiple-item scale for measuring consumer perceptions of service quality”,Journal of Retailing, Vol. 64, pp. 2-40. Perrault, W.D. and Russ, F.A. (1974), “Physical distribution service in industrial purchase
decisions”,Journal of Marketing, No. 40, pp. 3-10.
Phillips, D.M. and Baumgartner, H. (2002), “The role of consumption emotions in the satisfaction response”,Journal of Consumer Psychology, Vol. 12 No. 3, pp. 243-52.
Rafid, M. and Jaafar, H.S. (2007), “Measuring customers’ perceptions of logistics service quality of 3PL service providers”,Journal of Business Logistics, Vol. 28 No. 2, pp. 159-75. Rahman, S. (2006), “Quality management in logistics: an examination of industry practices”,
Supply Chain Management: An international Journal, Vol. 11 No. 3, pp. 233-40.
Rauyruen, P. and Miller, K.E. (2007), “Relationships quality as a predictor of B2B customer loyalty”,Journal of Business Research, Vol. 60, pp. 21-31.
IMDS
108,5
Richey, R.G., Daugherty, P.J. and Roath, A. (2007), “Firm technological readiness and complementarity: capabilities impacting logistics service competency and performance”, Journal of Business Logistics, Vol. 28 No. 1, pp. 195-228.
Rust, R.T. and Oliver, R.L. (1994), “Service quality insight and managerial implications from the frontiers”,Service Quality, New Directions in Theory and Practice, Sage, London, pp. 5-20.
Rutner, S.M. and Langley, C.J. (2000), “Logistics value: definition, process and measurement”, International Journal of Logistics Management, Vol. 1 No. 2, pp. 73-82.
Sa´nchez Ferna´ndez, J. (2002), “Percepciones de fabricantes y distribuidores respecto a los efectos del uso del EDI en el canal de distribucio´n”,Revista Europea de Direccio´n y Economı´a de la Empresa, Vol. 11 No. 2, pp. 77-94.
Shet, N., Deshmukh, S.G. and Vrat, P. (2006), “A conceptual model for quality of service in the supply chain”, International Journal of Physical Distribution & Logistics Management, Vol. 36 No. 7, pp. 547-75.
Sohal, A.S., Millen, R., Maggard, M. and Moss, S. (1999), “Quality in logistics: a comparison of practices between Australian and North American/European firms”,International Journal of Physical Distribution & Logistics Management, Vol. 29 No. 4, pp. 267-74.
Stank, T.P., Goldsby, T.J., Vickery, S.K. and Savitskie, K. (2003), “Logistics service performance: estimating its influence on market share”,Journal of Business Logistics, Vol. 24 No. 1, pp. 27-55.
Steemkamp, E.M. and van Trijp, C.M. (1991), “The use of LISREL in validating marketing constructs”,International Journal of Research in Marketing, Vol. 8, pp. 283-99.
Sua´rez A´ lvarez, L., Va´zquez Casielles, R. and Dı´az Martı´n, A.M. (2004),El marketing de relaciones y las nuevas tecnologı´as de la informacio´n y la comunicacio´n: ana´lisis del caso de las agencias de viaje minoristas, Libro actas XVI Encuentros de Profesores Universitarios de Marketing, Alicante.
Taylor Nelson Sofres (2001),Impact des NTIC sur la logistique des entreprises commerciales, Commission Europe´enne (DG Enterprise), Paris.
VanHamme, J. and Snelders, D. (2001), “The role of surprise in satisfaction judgments”,Journal of Consumer Satisfaction, Dissatisfaction, and Complaining Behavior, Vol. 14, pp. 27-45.
Va´zquez Casielles, R., Iglesias Argu¨elles, V., Dı´az Martı´n, A.M. and del Rı´o Lanza, A.B. (2002), “Calidad y satisfaccio´n en mercados industriales: influencia de las relaciones entre proveedor y comprador”,Revista Europea de Direccio´n y Economı´a de la Empresa, Vol. 11 No. 2, pp. 23-48.
Westbrook, R.A. (1980), “Intrapersonal affective influences on customer satisfaction with products”,Journal of Consumer Research, Vol. 7 No. 2, pp. 49-54.
Wirtz, J. and Bateson, J.E.G. (1999), “Consumer satisfaction with services: integrating the environment perspective in services marketing into the traditional disconfirmation paradigm”,Journal of Business Research, Vol. 44, pp. 55-66.
Woodruff, R.B. and Gardial, S.F. (1996),Know Your Customer: New Approaches to Customer Value and Satisfaction, Blackwell, Cambridge, MA.
Yu, Y.T. and Dean, A. (2001), “The contribution of emotional satisfaction to consumer loyalty”, International Journal of Service Industry Management, Vol. 12 No. 3, pp. 234-50.
Zeithaml, V.A., Berry, L.L. and Parasuraman, A. (1996), “The behavioral consequences of service quality”,Journal of Marketing, Vol. 60, pp. 31-46.
LSQ: a new way
to loyalty
Further reading
Novack, R.A., Langley, C.J. and Rinehart, L.M. (1995), Creating Logistics Value, Council of Logistics Management, Oak Brook, IL.
Novack, R.A., Rinehart, L.M. and Langley, C.J. (1996), “A comparative assessment of senior and logistics executives’ perceptions of logistics value”,Journal of Business Logistics, Vol. 17 No. 1, pp. 135-78.
Oliver, R.L. (1999), “Value as excellence in the consumption experience”, in Holbrook, M.B. (Ed.), Consumer Value. A Framework for Analysis and Research, Routledge, London, pp. 43-62. van der Veeken, J.M. and Rutten, W.G.M.M. (1998), “Logistics service management: opportunities for differentiation”, The International Journal of Logistics Management, Vol. 9 No. 2, pp. 91-7.
Corresponding author
David Servera France´s can be contacted at: [email protected]
IMDS
108,5
668
To purchase reprints of this article please e-mail:[email protected]