Debit, Credit, or Cash: Survey Evidence on
Gasoline Purchases
Kenneth A. Carow and Michael E. Staten
We analyzed the consumer’s payment option to use debit, general purpose credit cards, gasoline credit cards, or cash. Based on the results from a nested multinomial logit model, we found consumers are more likely to use cash when they have less education, lower incomes, are middle-aged, and own fewer credit cards. Debit and credit card users are younger, more educated, and hold more credit cards. Respondents who use their debit card are less likely to use their gasoline credit card. The results suggest that greater debit card usage will place the greatest competitive pressure on the gasoline credit card
program. © 1999 Elsevier Science Inc.
Keywords: Payment choices; Debit; Credit JEL classification: G21
I. Introduction
For three decades, experts on payment systems have forecast the imminent arrival of a completely electronic, paperless payment system. The centerpiece of this revolutionized payment system is the debit card, a magnetically-encoded plastic card which virtually eliminates the need for cash or checks at the point of sale. Over 4,000 banks currently issue off-line debit cards which are accepted wherever Visa or MasterCard are accepted. In 1997, these cards were used by 21 million households in the United States, a 75% increase in usage from 1994. Also in 1997, on-line debit cards (which double as ATM cards) were accepted at 261,000 merchants, and in the hands of over 55 million house-holds. The average annual transaction volume growth from 1990 through 1995 was 19% for bank cards, 61% for on-line debit cards, 106% for off-line debit cards, and 14% for ATM usage [Card Industry Directory (1997, p. 26)]. As recently as 1993, debit cards
Department of Finance, Kelley School of Business, Indiana University, Indianapolis, Indiana; Credit Research Center, Georgetown School of Business, Washington, DC.
Address correspondence to: Dr. K. A. Carow, Indiana University, Kelley School of Business, Department of Finance, 801 West Michigan Street, Indianapolis, IN 46202-5151.
accounted for approximately 2% of all retail store transactions.1By 1997, debit cards were used in over 1.4 billion transactions. Visa, U.S.A., has announced it hopes to lead the industry to the point in 2001 when 10% of all consumer payments will be made with debit cards [Keenan (1999)].
Using a survey of gasoline credit cardholders, we examined the consumer’s charac-teristics and reasons for using cash, general purpose credit cards (i.e., Visa, MasterCard, Discover, American Express), proprietary credit cards, and debit cards for retail gasoline purchases.2 The retail gasoline market is a prime example of transactions traditionally dominated by cash, but which have also long accepted plastic payment devices. The rise of debit cards is causing many retailers, including oil companies, to re-evaluate the purpose and viability of their proprietary (in-house) credit card programs [Lunt (1996)]. We used the survey evidence to assess how debit will impact the use of alternative payment systems. Specifically, we asked the following questions:
1. What factors determine a consumer’s choice between cash and non-cash methods of payment?
2. Among credit card users, what factors impact the choice of proprietary card versus general purpose cards?
3. What are the characteristics of debit users versus non-debit users and how do these characteristics compare with cash, general purpose card users, and gasoline card users?
4. Are debit cards more likely to impact the frequency of cash or credit card usage?
II. Survey Techniques and Analytical Methodology
We focused our empirical work on the payment choices of consumers who own at least one gasoline credit card and one general purpose credit card. Restricting the survey to customers who own both types of cards ensures that consumers had a full range of payment choices. The retail gasoline market also provides a homogenous group of transactions. Inventory models suggest that payment size influences a consumer’s pay-ment choice.3By utilizing the gasoline retail environment, we controlled for payment size by experimental design, as the transactions typically fell into a narrow range of $5 to $25.
The Data
We conducted a mail survey of gasoline credit cardholders during the spring and summer of 1992. The Credit Research Center (CRC) at Purdue University provided questionnaires, cover letters and envelopes to twelve participating oil companies with proprietary credit card programs.4The companies mailed 24,000 questionnaires to samples of their
card-1This statistic reflects the use of on-line debit, off-line debit, and prepaid debit cards in 1993. [Caskey and
Sellon (1994)].
2Previous literature on credit card usage includes Duca and Whitesell (1995), Boeschoten (1992), Lindley
et al. (1989), Hirschman (1982), and Martell and Fitts (1981).
3See Whitesell (1989, 1992) for a review of inventory models of payment choice.
4Participating companies include: Mobil, Total, United, Citgo, Phillips, Marathon, Cenex, Fina, Exxon,
holder base.5The particular company sending the questionnaire was not identified to the consumer. Consequently, the consumers’ responses relate to their general use of gasoline credit cards and not to their behavior with respect to a specific company (unless they owned only one gasoline card). Questionnaires were returned directly to the CRC. The overall response rate was 25.9% (6451 total surveys). The sample size was reduced by 965, due to incomplete demographic and credit information. The sample was further reduced by 322 respondents who did not have both a gasoline credit card and a general purpose credit card, leaving a total of 5,164 useable responses.6
Logit Estimation Model
To analyze the respondent’s choice between debit and non-debit payment methods, we used a multinomial logit model [Greene (1990, Ch. 21)]. To analyze the respondent’s choice of cash, general purpose card, and gasoline card we used the generalized extreme value (GEV) model (also called the nested multinomial logit model). Although the multinomial logit model of choice is extremely robust, even when its underlying assump-tions are violated, critics state that the property of independence of irrelevant alternatives, also called the constant ratio rule, is too restrictive. This property implies that if a new option is added to a choice set, the shares of existing options decrease in direct proportion to original share size. For a gasoline station this new option may be allowing customers to use a general purpose card, where the choices had previously been limited to only using cash or the company’s own proprietary credit card. Based on the multinomial logit model, the proportion of customers who will choose to use the general purpose card will draw in proportion to the market share of those who previously used cash and those who previously used a gasoline card. The GEV model relaxes this assumption. Maddala (1984, Ch. 3) showed that the GEV model is superior to the multinomial logit model when a sequence of decisions can be analyzed.
The use of the GEV model is a sequence of logit models. First, we analyzed the estimates for a model of choice within a given subset (gasoline or general purpose credit card). Second, we used the sum of the utilities for all the items in the subset (also called the inclusive value) as an explanatory variable in a higher-level model of choice (cash versus any credit card).
III. Analysis of the Payment Choice
Cash Versus Credit Decision and Gas Card Versus General Purpose Card Decision
In the survey, we asked respondents the following question: “Please think about your gasoline purchases over the past year. Indicate the approximate percentage of time you used each of the four payment methods listed below for your purchase. If you never used
5Several companies chose to divide their cardholders into two samples, active and inactive cardholders; from
these samples the companies then chose a random sampling of respondents. The response rate from active cardholders was 26.5%, and the response rate from inactive cardholders was 23.5%. In all future analyses, tests were done to determine if the inclusion of active versus inactive cardholders significantly influenced the characteristics of the sample. When significant, these differences are discussed.
a particular method, write 0%.” The four methods include cash/check, debit card, gasoline company credit card, and other credit card.7
We analyzed the cash versus credit decision through the use of a GEV model.8For each purchase, the respondent had the choice of using cash, a gasoline credit card, or a general purpose credit card. The GEV model requires an analysis of the gasoline card versus general card decision first (Table 12, Model 1). We incorporated the inclusive value from
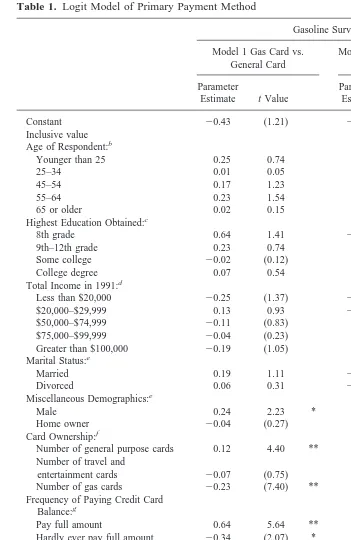
the gas versus general credit card decision into the logit model analyzing the cash versus credit decision (Table 1, Model 2). In Model 1, the dependent variable is equal to 1 if the respondent used the general purpose card a larger percentage of the time than the gasoline card. We assigned all other respondents a value of zero. We omitted 178 respondents who only used cash during the previous year, leaving a sample of 4986 respondents. The average value for the dependent variable was 16.4%, showing that 16.4% of respondents used their general purpose card more frequently than their gasoline card. Independent variables in Model 1 include demographic characteristics, credit characteristics, and the reasons given for using a particular type of credit card. The dependent variable in Model 2 is equal to 1 if the respondent used credit cards (gasoline plus general purpose credit card usage) a greater percentage of the time than cash (cash/check plus debit card usage).9
Of the respondents, 69.2% used credit more than cash. The independent variables in Model 2 are the inclusive value calculated in Model 1, demographic variables, and credit variables. Model 2 does not include responses about the importance of the general and gasoline card attributes, because these attributes primarily relate to the gas versus general purpose card decision.
The demographic characteristics were generally insignificant (exception: males were more likely to use general purpose cards). However, the greater the number of general purpose credit cards owned, the more likely the primary payment method was general purpose credit cards. Similarly, the greater the number of gasoline credit cards owned, the more likely gasoline credit cards were the primary payment method. Thus, respondents revealed their preferences for a particular type of card through their card ownership. Bank card revolvers were more likely to use a gasoline credit card as their primary payment method. This finding is consistent with credit-constrained individuals utilizing a wider variety of credit cards in order to keep the credit line on their general purpose cards open [Jappelli (1990)]. Respondents also ranked their reasons for using proprietary cards and general purpose cards (15“very important” to 45“not a factor”).10The most important reasons for consumers to use their general purpose credit cards were shopping with fewer cards, and obtaining rebates and enhancements. However, general purpose card users placed less importance on lower monthly payments. This is consistent with general purpose card users being more concerned with the convenience of the card than its credit
7Debit card users were not included in the nested logit analysis, as only 1% of respondents used debit as their
primary payment vehicle. Thus, analysis of debit card users was made separately from the nested logit model. When the debit card users were added to the nested multinomial logit model, the results were inconclusive.
8An ordered multinomial logistic model was also considered; however, no matter in which order the choices
of gas card, bank card, and cash were placed, the test for the proportional odds assumption showed that assuming parallel lines was not consistent with the data.
9The debit decision is not analyzed in this part of the paper, due to the infrequency of its use among
respondents (less than 1% of purchases).
10Inclusion of the no-responses or exclusion did not impact the conclusions from Table 1. In Table 1, we
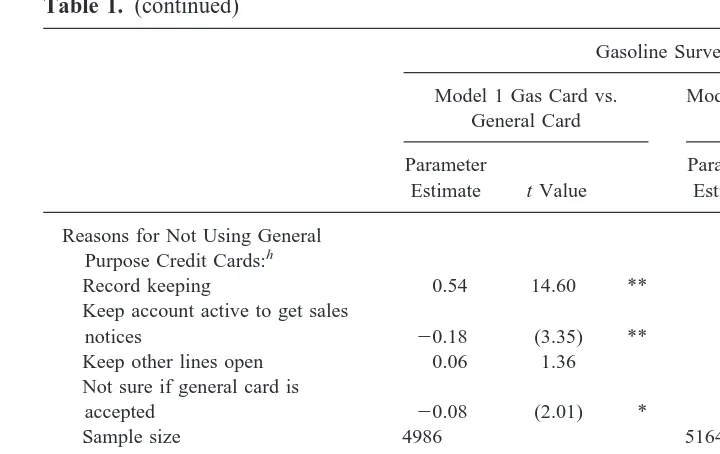
function.11A separate record for gasoline purchases was the most important reason to use a gasoline credit card.12 Other significant factors in the decision to use a gasoline card included keeping the account active to get sales notices, and not knowing whether a general purpose card would be accepted.13
The slope coefficients give the change in the log of the odds ratio of choosing a general purpose credit card. The change in the predicted probability of choosing a general purpose credit card depends not only on the estimated coefficient, but also on the level of the predicted probability from which the change is measured. The change in predicted probability for a unit increase in variable Xi is equal to Bi(1 2 P)*P, where Bi is the
estimated coefficient, and P is the initial predicted probability. For our hypothetical respondent— 40 years of age, high school diploma, $40,000 income, single, female, renting, with three general purpose cards, three gasoline cards—who rated all the reasons for using a general purpose card with a 4, and who rated all the reasons for not using a general purpose card with a 3, the predicted probability of choosing a general purpose card, P, was 13.0%. If the hypothetical respondent was a male, the predicted probability of using a general purpose card was 15.7%, an increase of 2.7% [.24*(1 2 .13)*.13]. Owning one more general purpose card increased the predicted probability of using a general purpose card by 1.4%, but owning one more gasoline card decreased the predicted probability of using a general purpose card by 2.6%. If the hypothetical respondent had considered the ease of shopping with one more card important enough to choose a 3 instead of a 4, the predicted probability of using a general purpose card would have increased by 5.9%. Choosing a 2 instead of a 3 for record keeping would have decreased the predicted probability of using a general purpose card by 6.1%.14
Model 2 of Table 4 provides the results from the GEV model concerning the cash versus credit decision. The inclusive value is the simple exponential average of the strict utility of credit card type. The coefficient of the credit card inclusive value term is significantly different from zero and lies in the interval [0, 1]. This shows that the GEV model is consistent with utility maximization [McFadden (1978)].15
Demographic variables are highly significant in the cash versus credit decision. A U-shaped relationship for age is evident. Relative to consumers aged 35– 45, both younger and older people are more likely to use credit cards. This is consistent with older customers valuing the security of credit card usage and younger customers being budget-constrained. Consistent with the convenience of having a payment source which does not need replenishing, respondents with greater education and higher income use credit cards
11Many gasoline cards do not permit fuel purchases to revolve, which means up to 100% minimum payment
for many users, but bank cards typically require only 2%–5% minimum payment.
12It is interesting to note that the co-branded Shell Master Card, introduced subsequent to this survey, does
separate out gasoline purchases from other purchases.
13Exclusion of the demographic and credit characteristics provided very similar results for Model 1. For
Model 1, keeping other credit lines open became positive and significant at the 5% level.
14Unlike in linear programming, where the change in probability remains constant, the change in predicted
probability is highly dependent on the starting value of P (which is determined by the level of the other coefficients). Due to this variability, any transformation of these original estimates must be done with caution. Based on these concerns, we do not interpret the change in the predicted probability in the remaining logit models, but provide the probability, P, for our hypothetical respondent in this footnote and footnote 20. For Model 2, the probability for our hypothetical respondent was 31.69%. Our hypothetical respondent is not the average respondent, but chosen to match with the omitted categories as stated in the footnotes to Table 1.
15Omission of the inclusive value did not have a significant impact on the level or significance of the other
Table 1. Logit Model of Primary Payment Method
Gasoline Surveya
Model 1 Gas Card vs. General Card
Model 2 Cash vs. Any Credit Card
Younger than 25 0.25 0.74 1.04 4.20 **
25–34 0.01 0.05 0.33 2.97 **
45–54 0.17 1.23 0.26 2.59 **
55–64 0.23 1.54 0.22 2.03 *
65 or older 0.02 0.15 0.30 2.70 **
Highest Education Obtained:c
8th grade 0.64 1.41 20.19 (0.52)
9th–12th grade 0.23 0.74 0.12 0.52
Some college 20.02 (0.12) 0.08 0.83
College degree 0.07 0.54 0.33 3.42 **
Total Income in 1991:d
Less than $20,000 20.25 (1.37) 20.19 (1.55)
$20,000–$29,999 0.13 0.93 20.05 (0.54)
$50,000–$74,999 20.11 (0.83) 0.14 1.47
$75,000–$99,999 20.04 (0.23) 0.12 0.85
Greater than $100,000 20.19 (1.05) 0.31 2.17 *
Marital Status:e
Married 0.19 1.11 20.04 (0.35)
Divorced 0.06 0.31 20.15 (1.06)
Miscellaneous Demographics:e
Male 0.24 2.23 * 0.04 0.56
Home owner 20.04 (0.27) 0.07 0.67
Card Ownership:f
Number of general purpose cards 0.12 4.40 ** 0.06 2.55 *
Number of travel and
entertainment cards 20.07 (0.75) 0.09 1.23
Number of gas cards 20.23 (7.40) ** 0.28 11.25 **
Frequency of Paying Credit Card Balance:g
Pay full amount 0.64 5.64 ** 0.48 5.76 **
Hardly ever pay full amount 20.34 (2.07) * 0.07 0.68
Cash vs. Credit Questions:
Importance of cash discounth 0.52 17.49 **
Frequency of self-servicei
20.03 (0.68)
Reasons for Using General Purpose Credit Cards:h
Lower interest rates 20.07 (1.25)
Lower monthly payment 0.27 3.89 **
Rebates/enhancements 20.31 (7.04) **
Ease of shopping with one card 20.52 (13.92) **
Paid fee; use card 0.09 (1.54)
more frequently. Marital status, sex, and home ownership did not differentiate between credit and cash users.
Not surprisingly, the number of credit cards owned was positively related to the use of credit. Convenience users were also more likely to use credit, while revolvers paid with cash more frequently.
We also asked respondents to specify the importance of cash discount and self service
(1 5 “very important” to 4 5 “not important”). As expected, cash users considered
discounts to be more important.16Respondents who used self-service were no more likely to use credit than respondents who used full-service.
16Given that all respondents owned at least one gasoline card, this result suggests that dropping the discount
for cash removed a major impediment to card usage. The elimination of virtually all national discount-for-cash programs since 1992 suggests that oil company issuers recognized this, too. See Barron et al. (1992).
Table 1. (continued)
Gasoline Surveya
Model 1 Gas Card vs. General Card
Model 2 Cash vs. Any Credit Card
Keep account active to get sales
notices 20.18 (3.35) **
Keep other lines open 0.06 1.36
Not sure if general card is
accepted 20.08 (2.01) *
Sample size 4986 5164
Mean of dependent variable 16.4% 69.2%
22 Log L 3229 5505
x2 1216 872
p Value 0.0001 0.0001
Concordant 84.4% 74.6%
Goodness-of-fit statistic (p-value) 0.1550 0.1834
aThe samples are limited to those respondents with at least one general purpose credit card and one gasoline credit card. bRespondents in the 35–44 age group are the omitted category.
cRespondents with a high school degree are the omitted category. dRespondents with $30,000–$49,999 income are the omitted category.
eIndicator variables are equal to 1 if the respondent has the characteristic, and 0 otherwise.
fEqual to the number of the type of card owned by the respondent. Values are from 1 to 10; respondents who answered that
they had more than 10 cards were given the value of 10.
gRespondents who stated that they sometimes pay their balance in full are the omitted category.
hRespondents ranked the importance of each reason as: 1) very important; 2) somewhat important; 3) not very important;
4) not a factor; and 5) no response.
iRespondents ranked the frequency of full-service usage: 1) almost always use self-serve island; 2) use self-serve island more
frequently than full-serve; 3) use self-serve and full-serve about equally, 4) use full-serve more than self-serve, and 5) almost always use full-serve islands.
This table utilizes a nested multinomial logit model to analyze the general purpose credit card versus gas credit card decision in Model 1, and the cash versus any credit card decision in Model 2. In column 1, the dependent variable is equal to 1 if the respondent stated they used a general purpose card more than a gasoline credit card, and 0 otherwise. If credit was never used, the observations were omitted from Model 1, but used in Model 2. In column 2, the dependent variable is equal to 1 if the respondent stated that they used credit (gasoline or general purpose cards) more than cash, and 0 otherwise.
Preliminary Comparisons of the Characteristics of Debit Versus Non-Debit Users
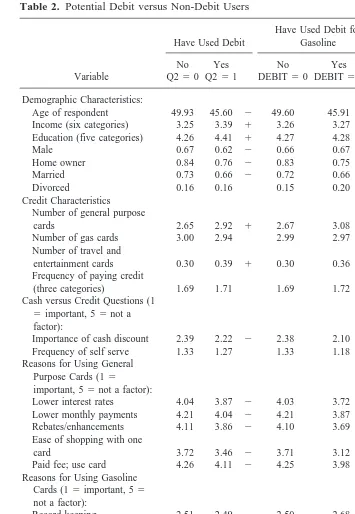
Debit card growth could significantly change consumer payment patterns. We provide an analysis of debit and potential debit users in Table 2. For each of the three categories, we examined differences in demographic characteristics, credit characteristics, attitudes to-ward credit card usage, and frequency of payment method. The first category is for the question “Have you ever used a debit card to make a purchase at a gasoline station, grocery store, or other retail store?” The second category is for respondents who stated that they have used a debit card for gasoline purchases.17 The third category is for the question “If a company offered you a debit card, at no cost to you, and charged the same price per gallon for debit card purchases as for cash purchases, would you be more likely to use the debit card or cash?” Each category has three columns. The first column is the mean value for respondents who stated they do not use debit or would not use debit. The second column is the mean value for respondents who stated that they do use debit or would use debit. The third column is a difference in means test.
The results are consistent for each of the three categories. Debit and potential debit users are younger, have higher income, are more educated, are less likely to own their home, and are less likely to be married. For the credit characteristics, debit card users generally have more credit cards. Debit and potential debit users also consider the reasons to use a general purpose card to be more important than non-debit users. In general, debit card users are more likely to consider lower interest rates, lower monthly payments, rebates, shopping with one card, and using a card due to having paid a fee to be important. We did not find consistent differences between debit and non-debit users for responses to the reasons for using gasoline cards.
The final section of Table 2, “Payment Frequency”, includes a summary of the percent of purchases made via each payment method. Generally, debit card users and potential debit card users made fewer cash purchases. This is consistent with the debit card serving as a cash substitute. More importantly, respondents who used debit to pay for gasoline purchases had significantly lower gasoline credit card usage than non-debit card users. However, debit card users used their cash and general purpose cards approximately the same percentage of the time as non-debit card users. Thus, for gasoline purchases, debit card usage is a substitute for gasoline card usage. This has important implications for the viability of proprietary card programs. Although there is some evidence of debit serving as a cash substitute, the results based on consumers who have already switched to debit card usage indicate that increased debit card usage will negatively impact gasoline credit card usage.
Debit Versus Non-Debit Users
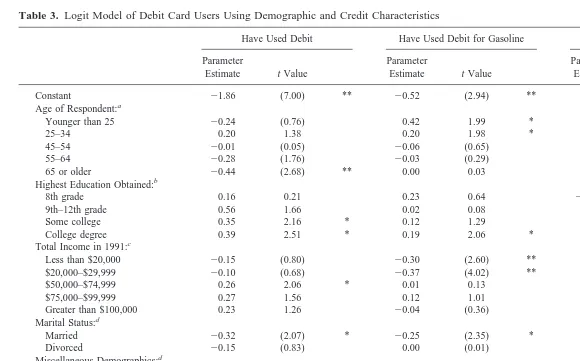
Using logistic regression in Table 3, we present the results for the characteristics of debit versus non-debit users. In general, the results provide evidence consistent with debit users having characteristics more closely related to credit card users than cash users, and preliminary evidence that debit card users are more closely related to general purpose card
17Gasoline purchases by debit were determined based on responses to question 4. If a respondent had ever
Table 2. Potential Debit versus Non-Debit Users
Age of respondent 49.93 45.60 2 49.60 45.91 2 49.89 48.28 2
Income (six categories) 3.25 3.39 1 3.26 3.27 3.23 3.32 1
Education (five categories) 4.26 4.41 1 4.27 4.28 4.23 4.33 1
Male 0.67 0.62 2 0.66 0.67 0.67 0.65
Home owner 0.84 0.76 2 0.83 0.75 2 0.84 0.80 2
Married 0.73 0.66 2 0.72 0.66 0.74 0.69 2
Divorced 0.16 0.16 0.15 0.20 0.15 0.17
Credit Characteristics Number of general purpose
cards 2.65 2.92 1 2.67 3.08 1 2.61 2.77 1
Number of gas cards 3.00 2.94 2.99 2.97 2.91 3.06 1
Number of travel and
entertainment cards 0.30 0.39 1 0.30 0.36 0.29 0.32
Frequency of paying credit
(three categories) 1.69 1.71 1.69 1.72 1.71 1.68
Cash versus Credit Questions (1 5important, 55not a factor):
Importance of cash discount 2.39 2.22 2 2.38 2.10 2 2.33 2.42 1
Frequency of self serve 1.33 1.27 1.33 1.18 2 1.33 1.30
Reasons for Using General Purpose Cards (15 important, 55not a factor):
Lower interest rates 4.04 3.87 2 4.03 3.72 2 4.06 3.94 2
Lower monthly payments 4.21 4.04 2 4.21 3.87 2 4.22 4.14 2
Rebates/enhancements 4.11 3.86 2 4.10 3.69 2 4.15 3.98 2
Ease of shopping with one
card 3.72 3.46 2 3.71 3.12 2 3.77 3.55 2
Paid fee; use card 4.26 4.11 2 4.25 3.98 2 4.27 4.19 2
Reasons for Using Gasoline Cards (15important, 55 not a factor):
Record keeping 2.51 2.49 2.50 2.68 2.56 2.42 1
Keep account active to get
sales notices 3.73 3.67 3.73 3.68 3.75 3.66 1
Keep other lines open 3.38 3.32 3.37 3.33 3.41 3.30 2
Not sure if general card is
accepted 3.66 3.55 2 3.65 3.45 2 3.69 3.54 2
Payment Frequency (in percent):
Cash 29.57 25.43 2 29.13 29.18 35.96 19.29 2
Debit 0.09 5.44 1 18.95 1 0.07 1.65 1
Gasoline card 60.34 60.02 60.95 42.31 2 55.31 67.44 1
General purpose 9.65 10.24 9.65 11.83 8.41 11.55 1
Total observations 4604 553 4984 180 3089 1909
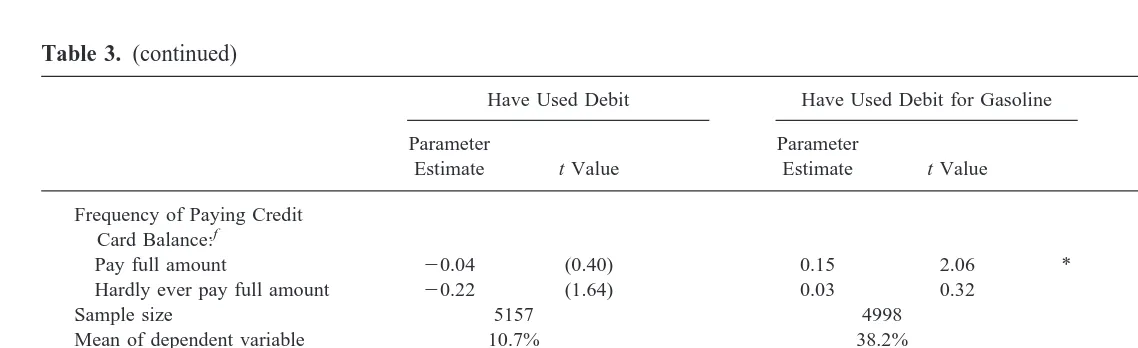
Table 3. Logit Model of Debit Card Users Using Demographic and Credit Characteristics
Have Used Debit Have Used Debit for Gasoline Potential Debit User
Parameter
Estimate t Value
Parameter
Estimate t Value
Parameter
Estimate t Value
Constant 21.86 (7.00) ** 20.52 (2.94) ** 23.29 (7.50) **
Age of Respondent:a
Younger than 25 20.24 (0.76) 0.42 1.99 * 0.14 0.27
25–34 0.20 1.38 0.20 1.98 * 0.11 0.46
45–54 20.01 (0.05) 20.06 (0.65) 20.08 (0.34)
55–64 20.28 (1.76) 20.03 (0.29) 20.31 (1.21)
65 or older 20.44 (2.68) ** 0.00 0.03 20.69 (2.47) *
Highest Education Obtained:b
8th grade 0.16 0.21 0.23 0.64 221.51 (0.00)
9th–12th grade 0.56 1.66 0.02 0.08 0.74 1.66
Some college 0.35 2.16 * 0.12 1.29 20.01 (0.06)
College degree 0.39 2.51 * 0.19 2.06 * 20.09 (0.36)
Total Income in 1991:c
Less than $20,000 20.15 (0.80) 20.30 (2.60) ** 20.20 (0.66)
$20,000–$29,999 20.10 (0.68) 20.37 (4.02) ** 0.06 0.26
$50,000–$74,999 0.26 2.06 * 0.01 0.13 0.09 0.42
$75,000–$99,999 0.27 1.56 0.12 1.01 0.33 1.16
Greater than $100,000 0.23 1.26 20.04 (0.36) 20.25 (0.73)
Marital Status:d
Married 20.32 (2.07) * 20.25 (2.35) * 0.05 0.20
Divorced 20.15 (0.83) 0.00 (0.01) 0.48 1.60
Miscellaneous Demographics:d
Male 20.19 (1.86) 20.19 (1.40) 0.16 0.95
Home owner 20.35 (2.58) ** 20.14 (1.55) 20.41 (1.86)
Card Ownership:e
Number of general purpose
cards 0.07 2.45 * 0.04 2.26 * 0.12 2.81 **
Number of travel and
entertainment cards 0.18 2.18 * 0.01 0.18 0.04 0.31
Number of gas cards 20.04 (1.51) 0.04 2.38 * 20.03 (0.65)
K.
A.
Carow
and
M.
E.
Table 3. (continued)
Have Used Debit Have Used Debit for Gasoline Potential Debit User
Parameter
Estimate t Value
Parameter
Estimate t Value
Parameter
Estimate t Value
Frequency of Paying Credit Card Balance:f
Pay full amount 20.04 (0.40) 0.15 2.06 * 0.00 (0.00)
Hardly ever pay full amount 20.22 (1.64) 0.03 0.32 20.25 (1.13)
Sample size 5157 4998 5164
Mean of dependent variable 10.7% 38.2% 3.5%
22 Log L 3414 6560 1523
x2 100 88 39
p value 0.0001 0.0001 0.0185
Concordant 62.3% 57.3% 61.4%
Goodness-of-fit statistic (p
value) 0.7989 0.3235 0.3391
aRespondents in the 35–44 age group are the omitted category. bRespondents with a high school degree are the omitted category. cRespondents with $30,000–$49,999 income are the omitted category.
dIndicator variables are equal to 1 if the respondent had the characteristic, and 0 otherwise.
eEqual to the number of the type of card owned by the respondent. Values are from 1 to 10; respondents who answered that they had more than 10 cards were given the value of 10. fRespondents who stated that they sometimes pay their balance in full are the omitted category.
This table utilizes a logit model to analyze the characteristics of debit card users compared to non-debit card users. In the first model, the dependent variable is equal to 1 if the respondent stated that they have used a debit card in any type of purchase, and 0 otherwise. In the second model, the dependent variable is equal to 1 if the respondent stated that they used the debit card in a gasoline purchase, and 0 otherwise. In the third model, the dependent variable is equal to 1 if the respondent stated that they might use the debit card in the future, and 0 otherwise. Only observable characteristics are used in this table.
*Significant at the .05 level. **Significant at the .01 level.
Credit,
or
Cash
users than gasoline card users. The respondents’ demographic characteristics show that debit card users are younger, more educated, less likely to be married, and less likely to own their own home. The credit characteristics show that debit card users have more general purpose credit cards; however, payment patterns do not provide any differentiation between debit and non-debit card users. The debit card characteristics of having higher income and having more education are similar to the characteristics of credit card users. The fact that debit card users placed the greatest importance on the reasons for using a general purpose card, and owned more general purpose cards provides evidence that debit card users share similar characteristics with general credit card users.18
IV. Conclusions
In this study, we provided an analysis of the payment choices at gasoline stations, as well as an in-depth look at the characteristics of actual debit card users and potential debit card users in the gasoline retail context. We analyzed the cash versus credit card, the general purpose credit card versus gasoline credit card, and the debit versus non-debit card payment decisions.
For the cash versus credit decision, respondents with more education, greater income, and a greater number of cards owned, and convenience users were more likely to use credit than cash. Convenience, and not the borrowing capacity of credit, was the greatest determinant of a credit card user. Given the decision to use credit, respondents with more general purpose cards and convenience users were more likely to use a general purpose credit card. Respondents with more gasoline cards and revolvers were more likely to use a gasoline credit card.19 For revolvers, using a gasoline credit card keeps their general purpose credit line available. General purpose card users placed the greatest importance on reducing the number of cards held and receiving rebates. Record keeping was the most important reason for using a gasoline card.
The characteristics of potential debit card users are similar to the characteristics of credit card users. Those who indicated they had used or would use a debit card are younger, more educated, and hold more credit cards. Furthermore, debit card users have characteristics more closely related to general purpose card users than to gasoline card users. Debit card users hold more general purpose cards, place greater importance on the reasons for using a general purpose card, and are interested in a payment source which reduces the number of credit cards carried. More importantly, respondents using their debit cards for gasoline purchases had significantly lower gasoline credit card usage, but did not have lower cash or general purpose card usage. These results suggest that the respondents most likely to switch to debit card usage are gasoline card users with characteristics more closely related to general purpose card users.
References
Barron, J., Staten, M., and Umbeck, J. Oct. 1992. Discounts for cash in retail gasoline. Contem-porary Policy Issues 29(4):89–102.
18Our hypothetical respondent had a predicted probability, P, of 14.6%, 43.1%, and 4.65% in Models 1, 2,
and 3, respectively. See footnote 14 for reference concerning greater interpretation of the estimated coefficients.
19This is also consistent with revolvers being more likely to use cash than credit. Credit-constrained
Boeschoten, W. 1992. Currency Use and Payment Patterns. Financial and Monetary Policy Studies, Vol. 23. Norwell, MA: Kluwer Academic Publishing.
Card Industry Directory. 1997. New York: Faulkner and Gray.
Caskey, J., and Sellon, G. 1994. Is the debit card revolution finally here? Economic Review, Federal Reserve Bank of Kansas City 79(4):79–95.
Duca, J., and Whitesell, W. 1995. Credit cards and money demand: A cross-sectional study. Journal of Money, Credit, and Banking 27(2):604–623.
Green, W. 1990. Econometric Analysis. New York: Macmillan Publishing Company.
Hirschman, E. Oct. 1982. Consumer payment systems: The relationship of attribute structure to preference and usage. Journal of Business 55(4):531–545.
Jappelli, T. Feb. 1990. Who is credit constrained in the U. S. economy? The Quarterly Journal of Economics 105(1):219–234.
Keenan, C. Feb. 4, 1999. Prospects are grim for Visa’s latest debit card. American Banker: 14. Lindley, J., Rudolph, P., and Selby, E., Jr. May 1989. Credit card possession and use: Changes over
time. Journal of Economics and Business 41(2):127–142.
Lunt, P. Sept. 1996. Is it first and goal for debit cards? ABA Banking Journal 88(9):44–50. Maddala, G. S. 1984. Limited Dependent and Quantitative Variables in Econometrics. Cambridge,
UK: Cambridge University Press.
Martell, T., and Fitts, R., Winter 1981. A quadratic discriminate analysis of bank credit card user characteristics. Journal of Economics and Business 33(2):153–159.
McFadden, D. 1978. Modeling the choice of residential location. In Spatial Interaction Theory and Residential Location (Karlgvist, ed.) North Holland: Amsterdam, pp. 75–96.
Whitesell, W. May 1989. The demand for currency versus debitable accounts. Journal of Money Credit and Banking 21(2):483–498.