ANALISA HARGA DAN PEMASARAN UNTUK
MENINGKATKAN PROFITABILITAS UKM KERAJINAN
KULIT DENGAN SISTEM DINAMIK
STUDI KASUS :
Laboratorium Sistem Pendukung Keputusan
dan Intelegensia Bisnis
Kurnia Sari D. S
5208100085
Pembimbing I :
Erma Suryani, ST, MT, Ph.D
Pembimbing II :
Latar Belakang Permasalahan
Permasalahan
Pemasaran
UKM
Analisa harga
dan pasar
UKM
Sistem
Dinamik
Meningkatkan
Profitabilitas
UKM
SISTEM DINAMIK
Karakteristik Model Sistem Dinamik, antara lain :
Dinamika sistem yang kompleks
Perubahan perilaku sistem terhadap waktu
Adanya sistem umpan balik tertutup
Adanya umpan balik ini menggambarkan
informasi baru tentang keadaan sistem, yang
kemudian akan menghasilkan keputusan
Rumusan Masalah
1.
Apakah faktor-faktor yang mempengaruhi harga (pricing)
dan pemasaran (
marketing
) UKM Dwi Jaya Abadi
Tanggulangin berdasarkan kondisi saat ini ?
2.
Bagaimana model sistem harga (pricing) dan pemasaran
(
marketing
) produk kerajinan kulit berdasarkan kondisi
UKM Dwi Jaya Abadi Tanggulangin saat ini ?
3.
Skenario apa sajakah yang bisa di pertimbangkan oleh
UKM Dwi Jaya Abadi Tanggulangin untuk meningkatkan
profitabilitas produk kerajinan tangan?
Tujuan dari pengerjaan tugas akhir ini adalah :
a. membuat model sistem dinamik yang sesuai
dengan kondisi UKM Kerajinan kulit.
b. membuat skenario yang dapat meningkatkan
profitabilitas UKM dari segi harga dan
pemasaran berdasarkan kondisi optimis, most
likely dan pesimis.
Sistematika Penulisan Buku TA
BAB I
PENDAHULUAN
BAB II
TINJAUAN PUSTAKA
BAB III
METODOLOGI PENELITIAN
BAB IV
MODEL DAN IMPLEMENTASI
BAB V
PERANCANGAN SKENARIO MODEL
Metodologi
Penelitian
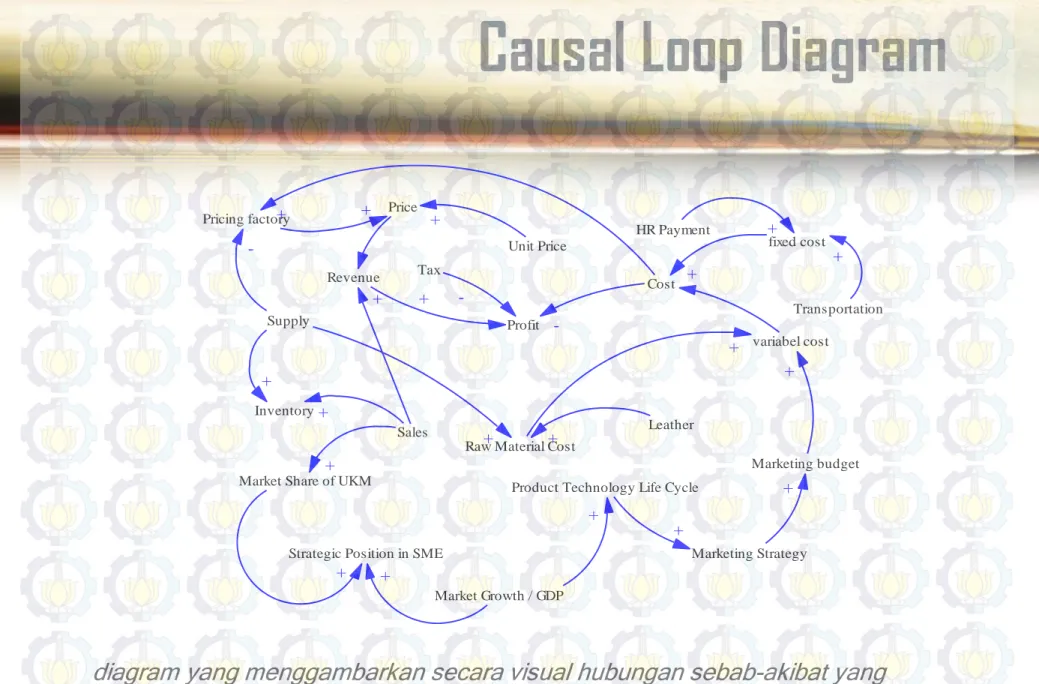
Mulai Studi Literatur Survei Kasus (UKM Kerajinan Kulit) Pendefinisian Sistem Pembuatan Model Kausatik Sesuai dengan sistem nyata? Tidak Pengumpulan Data Ya Pembuatan model Matematis Verifikasi Tidak Validasi Ya Tidak Pembuatan Skenario Ya Pembuatan laporan SelesaiCausal Loop Diagram
diagram yang menggambarkan secara visual hubungan sebab-akibat yang
terjadi diantara variabel-variabel yang saling mempengaruhi dalam suatu sistem.
HR Payment
Marketing budget
fixed cost
variabel cost
+
Marketing Strategy
Strategic Position in SME
Market Share of UKM
Market Growth / GDP
+
+
Price
Profit
Cost
+
Product Technology Life Cycle
+
+
+
Tax
Transportation
+
+
Raw Material Cost
+
Leather
+
Sales
Supply
Unit Price
Inventory
-Revenue
+
-+
+
+
+
+
Pricing factory
-+
+
+
Pengembangan Model
HR Payment
Marketing budget
Fixed cost
Variabel cost
Strategic
Position in
SME
Market Share
Market Growth
Price
Pricing Factory
Profit
Cost
Tax
Transportation
Number of Promotion
Raw Material Cost
Leather
Number of Distribution
Number of
distribution in
Current
Sales UKM Competitor
Cash Cows
Dogs
Question Mark
Star
Unit Price
Unit Price Rate
Inventory
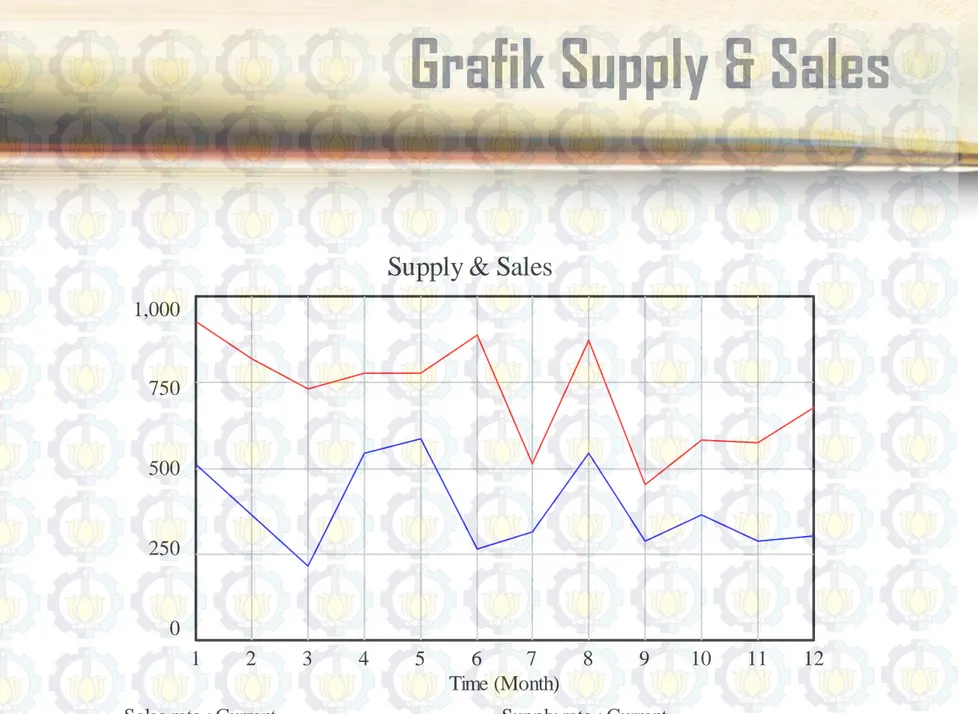
Supply rate
Sales rate
Revenue
Fabric
Average Sales per
Distributor
Percentage sales
per distributor
Supply
Promotion
Transportation Cost
Persamaan Strategic Position in SME
Sub-model
Skala Strategic Position
0 < I <= 20 Market Share Scenario = j Question Mark -20 <= I < 0 Cash Cow Yes No Yes Finish Finish Cond fval-3 tval-1 Start Market Growth Development =i 0 <= j <= 50 Yes 50 < j <= 100 Yes Star No tval-2 Finish Dogs Finish No fval-4
Marketing Strategy Sub-model
• Distributor
• Promotion
• Transportation
Marketing
Strategy
• pemasaran
berkaitan
dengan dana
pemasaran
Marketing
Budget
Market Share Sub-model
nilai penjualan perusahaan dalam memenuhi
permintaan pasar akan suatu produk.
1) Market Share = (Sales UKM/ Total Sales UKM
Competitor)*100
2) Sales UKM Competitor = Sales UKM Competitor
= RANDOM NORMAL( 112 , 550 , 386.17 ,
Pricing Sub-model
menentukan harga produk kerajinan kulit untuk
mendapatkan keuntungan yang bisa diraih
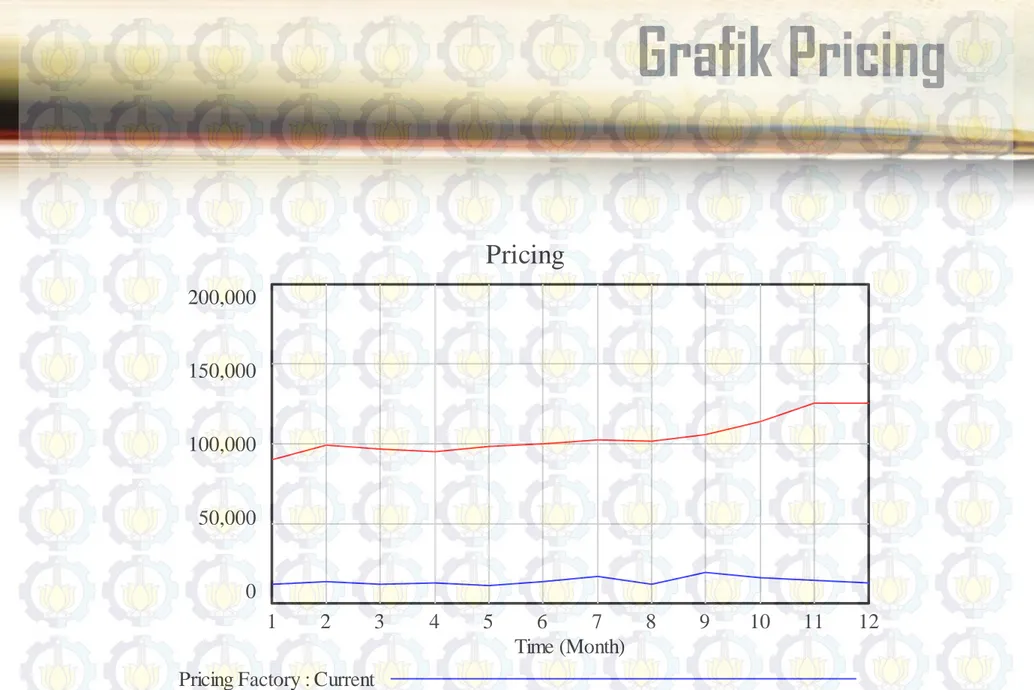
1) Pricing factory = (Total Cost/Supply rate)
2) Unit Price = RANDOM UNIFORM(-0.65, 0.91 , 9)
3) Unit Price Rate = Unit Price
Cost Sub-model
Total Cost =
fixed cost+variabel
cost
Fixed cost = HR
Payment
HR Payment =
3.5e+006
Variable cost = Marketing
budget+Raw Material Cost
Raw Material Cost =
(((Leather*5.34)+(Fabric*5.34))*Sup
ply)
Leather = RANDOM
NORMAL( 1, 2 , 1.5 , 0.5 ,
1)
Fabric =
RANDOM
NORMAL( 225 , 505 ,
382.08 , 82.83 , 1 )
Revenue sub-model
pendapatan kotor yang diiperoleh melalui penjualan produk setiap bulannya.
Revenue = Price*Sales rate
Sales rate = Average Sales per Distributor*Number of Distribution
Average Sales per Distributor = (Percentage sales per distributor/100)*(Supply/Number
of Distribution)
Percentage sales per distributor = RANDOM NORMAL(0.28, 0.8, 0.54, 0.13, 1)*100
Supply = RANDOM NORMAL( 394 , 968 , 694.84 , 189.62 , 15 )
Profit Sub-model
pendapatan bersih atau keuntungan yang diperoleh
oleh UKM melalui penjualan produk nya.
1) Profit = (Revenue-Cost)-((Revenue-Cost)*Tax)
2) Tax = (0.5/12)/100
Strategic Position in SME
Strategic Position in SME
4
3
2
1
0
1
2
3
4
5
6
7
8
9
10
11
12
Time (Month)
Strategic Position in SME : Current
Grafik Supply & Sales
Supply & Sales
1,000
750
500
250
0
1
2
3
4
5
6
7
8
9
10
11
12
Time (Month)
Grafik Pricing
Pricing
200,000
150,000
100,000
50,000
0
1
2
3
4
5
6
7
8
9
10
11
12
Time (Month)
Pricing Factory : Current
Grafik Cost, Revenue and Profit
Cost, Revenue & Profit
60 M
45 M
30 M
15 M
0
1
2
3
4
5
6
7
8
9
10
11
12
Time (Month)
rupi
ah
Profit : Current
Cost : Current
Revenue : Current
Perancangan Skenario Model
Validasi Model
Scenario Model
Structure Scenario Parameter
Scenario
Question Mark
Scenario Star Scenario
Optimistic Scenario Most Likely Scenario Pessimistic Scenario Verifikasi Model Cash Cow
Skenario Struktur
No
Strategic position in
SME
Marketing
Stratgy
Strategy Breakdown
1
Question Mark
Build atau
Develop
Market Penetration
Product Development
Market Development
2
Star
Hold
Market Penetration
Product Development
Market Development
3
Cash Cow
Harvest
Price Development
Retrenchment
4
Dog
Divest
Retrenchment
Skenario Struktur
Build atau develop
Hold
Harvest
Divest
Product Development
Market Development
Skenario
Struktur
HR Payment Marketing budget Fixed cost Variabel cost Strategic Position in SME Market Share Market GrowthPrice Pricing Factory Profit Cost Tax Transportation Number of Promotion Raw Material Cost
Leather Number of Distribution Number of distribution in Current Total Sales UKM Competitor Cash Cows Dogs Question Mark Star Unit Price
Unit Price Rate
Inventory Supply rate Sales rate
Revenue Fabric Sales of Discount Item Discount Discount Price Percentage sales of inventory Revenue of Discount Item
Average Sales per Distributor Percentage sales per distributor Supply Price Scenario Pricing Factory Scenario Profit Scenario
Tax 0 Unit Price Scenario
Unit Price Rate Scenario Revenue Scenario
Cost Cutting
Market Share Scenario
Develop Product development Market Development Number of Distribution Development Strategic Position in SME Scenario Market Penetration <Time> Supply Development Sales Development
Inventory Scenario
Supply rate Scenario Sales rate Scenario
Innovation Product Promotion Market Growth Development Marketing budget Scenario Variabel cost Scenario Transportation Scenario Raw Material Cost
Scenario Ratio of Profit Transportation Cost Transportation Cost Scenario Profit Minimum Profit Maksimum Sales UKM Competitor 1 Sales UKM Competitor 2 Sales UKM Competitor 3
Flow diagram sub-model
Question Mark skenario
Hasil Skenario Struktur
Profit Scenario
80 M
60 M
40 M
20 M
0
1
6
11
16
21
26
31
36
Time (M onth)
rupi
ah
Profit Scenario : skenario
Profit Scenario : Current
Rata-Rata
Profit Awal
(rupiah)
Rata-Rata
Profit
Develop
(rupiah)
Rata-Rata
Ratio
Kenaikan
Profit
Mean
38,388,494
41,537,497
8.2%
Rata-Rata Profit Awal, Develop dan Ratio Kenaikan
Skenario
Struktur
Flow diagram sub-model
Star scenario
HR Payment Marketing budget Fixed cost Variabel cost Strategic Position in SMEMarket Share Market Growth
Price Pricing Factory Profit Cost Tax Transportation Number of Promotion Raw Material Cost
Leather Number of Distribution Number of distribution in Current Total Sales UKM Competitor Cash Cows Dogs Question Mark Star Unit Price
Unit Price Rate
Inventory Supply rate Sales rate
Revenue Fabric Sales of Discount Item Discount Discount Price Percentage sales of inventory Revenue of Discount Item
Average Sales per Distributor Percentage sales per distributor Supply Price Scenario Pricing Factory Scenario Profit Scenario
Tax 0 Unit Price Scenario
Unit Price Rate Scenario Revenue Scenario
Cost Cutting
Market Share Scenario
Hold Product development Market Development Number of Distribution Development Strategic Position in SME Scenario Market Penetration <Time> Supply Development Sales Development
Inventory Scenario
Supply rate Scenario Sales rate Scenario
Innovation Product Promotion Market Growth Development Marketing budget Scenario Variabel cost Scenario Transportation Scenario Raw Material Cost
Scenario Ratio of Profit Transportation Cost Transportation Cost Scenario Profit Minimum Profit Maksimum
Hasil Skenario Struktur
Rata-Rata Profit Awal, Hold dan Ratio Kenaikan
Profit Scenario
100 M
75 M
50 M
25 M
0
1
6
11
16
21
26
31
36
Time (M onth)
rupi
ah
Profit Scenario : skenario
Profit Scenario : Current
Rata-Rata
Profit Awal
Rata-Rata
Profit Hold
Rata-Rata
Ratio
Kenaikan
Profit
Mean
38,388,494
43,548,614
13.4%
Skenario
Struktur
Flow diagram sub-model
Cash Cow scenario
HR Payment Marketing budget Fixed cost Variabel cost Strategic Position in SME
Market Share Market Growth
Price Pricing Factory Profit Cost Tax Transportation Number of Promotion Raw Material Cost
Leather Number of Distribution Number of distribution in Current Total Sales UKM Competitor Cash Cows Dogs Question Mark Star Unit Price
Unit Price Rate
Inventory
Supply rate Sales rate Revenue
Fabric
Average Sales per Distributor Percentage sales per distributor Supply Price Scenario Pricing Factory Scenario Profit Scenario
Tax 0 Unit Price Scenario Unit Price Rate
Scenario Revenue Scenario
Cost Cutting
Market Share Scenario
Harvest Price Development Retrenchment Number of Distribution Development Strategic Position in SME Scenario <Time> Supply Development Sales Development
Inventory Scenario
Supply rate Scenario Sales rate Scenario
Promotion Market Growth Development Marketing budget Scenario Variabel cost Scenario Transportation Scenario Raw Material Cost
Scenario Ratio of Profit Transportation Cost Transportation Cost Scenario Profit Minimum Profit Maksimum
Hasil Skenario Struktur
Profit Scenario
80 M
60 M
40 M
20 M
0
1
6
11
16
21
26
31
36
Time (M onth)
rupi
ah
Profit Scenario : skenario
Profit Scenario : Current
Perbandingan profit awal
dan
profit pada harvest
Rata-Rata
Profit Awal
(rupauh)
Rata-Rata
Profit Harvest
(rupiah)
Rata-Rata Ratio
Kenaikan Profit
Mean
38,388,494
38,511,239
0.32%
Skenario
Struktur
Flow diagram sub-model
Dog scenario
HR Payment Marketing budget Fixed cost Variabel cost Strategic Position in SMEMarket Share Market Growth
Price Pricing Factory Profit Cost Tax Transportation Number of Promotion Raw Material Cost
Leather Number of Distribution Number of distribution in Current Total Sales UKM Competitor Cash Cows Dogs Question Mark Star Unit Price
Unit Price Rate
Inventory Supply rate Sales rate
Revenue
Fabric
Average Sales per Distributor Percentage sales per distributor Supply Price Scenario Pricing Factory Scenario Profit Scenario
Tax 0 Unit Price Scenario
Unit Price Rate Scenario Revenue Scenario
Cost Cutting
Market Share Scenario
Divest Retrenchment Number of Distribution Development Strategic Position in SME Scenario <Time>
Supply Development Sales Development Inventory
Scenario
Supply rate Scenario Sales rate Scenario
Promotion Market Growth Development Marketing budget Scenario Variabel cost Scenario Transportation Scenario Raw Material Cost
Scenario Ratio of Profit Transportation Cost Transportation Cost Scenario Profit Minimum Profit Maksimum
Hasil Skenario Struktur
Perbandingan profit awal
dan
profit pada divest
Profit Scenario
80 M
60 M
40 M
20 M
0
1
6
11
16
21
26
31
36
Time (M onth)
rupi
ah
Profit Scenario : skenario
Profit Scenario : Current
Rata-Rata Profit
Awal
Rata-Rata Profit
Harvest
Rata-Rata Ratio
Kenaikan Profit
Mean
Rp. 38,388,494
Rp. 38,550,675
0.42 %
Analisis Hasil – Skenario Struktur
Skenario
Rata-Rata Profit Awal
Rata-Rata Profit
Skenario
Ratio Kenaikan
Rata-Rata
Profit
Question
Mark
Rp. 38,388,494
Rp. 41,537,497
8.2%
Star
Rp. 38,388,494
Rp. 43,548,614
13.4%
Cash Cow
Rp. 38,388,494
Rp.
38,511,239
0.32%
Dog
Rp. 38,388,494
Rp. 38,550,675
0.42%
Skenario
Parameter
Flow diagram sub-model
Optimistik scenario
HR Payment Marketing budget Fixed cost Variabel cost Strategic Position in SMEMarket Share Market Growth Price Pricing Factory Profit Cost Tax Transportation Number of Promotion Raw Material Cost
Leather Number of Distribution Number of distribution in Current Total Sales UKM Competitor Cash Cows Dogs Question Mark Star Unit Price
Unit Price Rate
Inventory
Supply rate Sales rate Revenue Fabric Sales of Discount Item Discount Discount Price Percentage sales of inventory Revenue of Discount Item
Average Sales per Distributor Percentage sales per distributor Supply Price Scenario Pricing Factory Scenario Profit Scenario
Tax 0 Unit Price Scenario
Unit Price Rate Scenario Revenue Scenario
Cost Cutting
Market Share Scenario
Divest Harvest Develop Hold Product development Price Development Market Development Retrenchment Number of Distribution Development Strategic Position in SME Scenario Market Penetration <Time>
Supply Development Sales Development Inventory
Scenario
Supply rate Scenario Sales rate Scenario
Innovation Product Promotion Market Growth Development Marketing budget Scenario Variabel cost Scenario Transportation Scenario Raw Material Cost
Scenario Ratio of Profit Transportation Cost Transportation Cost Scenario Profit Minimum Profit Maksimum
Hasil Skenario Parameter
Perbandingan profit awal
dan
profit skenario
Profit Scenario
200 M
150 M
100 M
50 M
0
1
6
11
16
21
26
31
36
Time (M onth)
ru
p
ia
h
Profit Scenario : strategy\divest
Profit Scenario : strategy\harvest
Profit Scenario : strategy\hold
Profit Scenario : strategy\develop
Profit Scenario : Current
Profit
Rata-Rata Profit
(Rp)
Persentase
Perningkatan
Profit (%)
Current
38,388,494
0
Develop
42,153,069
9.79
Hold
44,575,575
16.10
Harvest
38,521,147
0.33
Divest
38,582,789
0.49
Persentase Rata-Rata Profit
Skenario
Parameter
Flow diagram sub-model
Most Likely scenario
HR Payment Marketing budget Fixed cost Variabel cost Strategic Position in SME
Market Share Market Growth Price Pricing Factory Profit Cost Tax Transportation Number of Promotion Raw Material Cost
Leather Number of Distribution Number of distribution in Current Total Sales UKM Competitor Cash Cows Dogs Question Mark Star Unit Price
Unit Price Rate
Inventory
Supply rate Sales rate Revenue Fabric Sales of Discount Item Discount Discount Price Percentage sales of inventory Revenue of Discount Item
Average Sales per Distributor Percentage sales per distributor Supply Price Scenario Pricing Factory Scenario Profit Scenario
Tax 0 Unit Price Scenario
Unit Price Rate Scenario Revenue Scenario
Cost Cutting
Market Share Scenario
Divest Harvest Develop Hold Product development Price Development Market Development Retrenchment Number of Distribution Development Strategic Position in SME Scenario Market Penetration <Time> Supply Development Sales Development
Inventory Scenario
Supply rate Scenario Sales rate Scenario
Innovation Product Promotion Market Growth Development Marketing budget Scenario Variabel cost Scenario Transportation Scenario Raw Material Cost
Scenario Ratio of Profit Transportation Cost Transportation Cost Scenario Profit Minimum Profit Maksimum
Hasil Skenario Parameter
Perbandingan profit awal
dan
profit skenario
Profit Scenario
100 M
75 M
50 M
25 M
0
1
6
11
16
21
26
31
36
Time (M onth)
ru
p
ia
h
Profit Scenario : strategy\divest
Profit Scenario : strategy\harvest
Profit Scenario : strategy\hold
Profit Scenario : strategy\develop
Profit Scenario : Current
Profit
Rata-Rata Profit
(Rp)
Persentase
Perningkatan
Profit (%)
Current
38,394,444
0
Develop
39,955,556
4.07
Hold
40,936,111
6.62
Harvest
38,463,889
0.18
Divest
38,466,667
0.19
Persentase Rata-Rata Profit Most
Skenario
Parameter
Flow diagram sub-model
Pesimistik scenario
HR Payment Marketing budget Fixed cost Variabel cost Strategic Position in SMEMarket Share Market Growth Price Pricing Factory Profit Cost Tax Transportation Number of Promotion Raw Material Cost
Leather Number of Distribution Number of distribution in Current Total Sales UKM Competitor Cash Cows Dogs Question Mark Star Unit Price
Unit Price Rate
Inventory
Supply rate Sales rate Revenue Fabric Sales of Discount Item Discount Discount Price Percentage sales of inventory Revenue of Discount Item
Average Sales per Distributor Percentage sales per distributor Supply Price Scenario Pricing Factory Scenario Profit Scenario
Tax 0 Unit Price Scenario
Unit Price Rate Scenario Revenue Scenario
Cost Cutting
Market Share Scenario
Divest Harvest Develop Hold Product development Price Development Market Development Retrenchment Number of Distribution Development Strategic Position in SME Scenario Market Penetration <Time> Supply Development Sales Development
Inventory Scenario
Supply rate Scenario Sales rate Scenario
Innovation Product Promotion Market Growth Development Marketing budget Scenario Variabel cost Scenario Transportation Scenario Raw Material Cost
Scenario Ratio of Profit Transportation Cost Transportation Cost Scenario Profit Minimum Profit Maksimum