2011 International Conference on Electrical Engineering and Informatics
17-19 July 2011, Bandung, Indonesia
Optimum Configuration of Stand-alone Hybrid
Distributed Generation: A Case of Eastern Indonesia
Yusak Tanoto
Electrical Engineering Department, Petra Christian University Jl. Siwalankerto 121-131 Surabaya 60236, Indonesia
Abstract— This paper presents analysis of electricity generation using stand-alone hybrid renewable energy resources for typical household in remote area situated in the eastern Indonesia. In the previous study, the optimum sizing problem is solved with PV/battery/wind-hybrid system without any generator addition. In this study, gasoline generator is added as a non-renewable resource option for 3 hybrid system alternatives, for which system’s reliability and economic, and energy storage requirement is analyzed. The main objective is to determine the optimum size to meet the daily energy requirement based on available technology options. The analysis results show that PV/battery/wind-hybrid system is the most economically feasible with the cost of energy US$ 0.817/kWh, and system reliability remains unaffected in the absence of generator.
Keywords— Hybrid stand-alone, optimum size, renewable energy, distributed generation, cost of energy.
I. INTRODUCTION
Electricity is one of the most important factors in wealth generation and economic and social development, predominantly for developing country like Indonesia. As about 75% of total populations settle in the rural areas, rural electrification program is becoming a major concern and currently under way. The overall national electrification rate climbed from 58.3% in 2005 to 65% in 2009. However, electrification rate for eastern region of Indonesia improved very slow as it reached 31.8% in 2009, insignificantly changed as compared to 30.1% in 2005 [1]. In case of eastern part of Indonesia, many villages and isolated areas are currently unconnected to the utility network and still they may not be connected in the near future due to high cost of lines extension and lack of load demand. Hence, utilization of off-grid electricity generation is a promising method.
In fact, the use of renewable energy technology to meet energy demands has been steadily increasing over the years, worldwide [2]. In the previous study, the optimal sizing problem is solved for photovoltaic (PV)/battery-wind hybrid system. It has been proved that combination of PV/battery and wind offer excellent inherent reliability [3]. Moreover, it has no fuel requirement. In this paper, a gasoline generator instead of diesel generator is considered to be added into the hybrid system. Gasoline type generator offer a cheaper price and small size is accommodated compared to diesel generator. This is to analyze effect of adding generator regarding the issue of
reducing the energy storage requirement and increasing system reliability [4], [5].
II. METHODOLOGY
The feasibility of the proposed system is determined based on the simulation carried out using Hybrid Optimization Model for Electric Renewable (HOMER) software, developed by the US National Renewable Energy Laboratory [6]. Important system characteristics are discussed in this section.
A. Load Profile
The hybrid system is considered to be implemented as the electricity source for household in Baa, Rote Ndao District of the Rote Island. Located on 10°50’ South latitude and 123°0’ East longitude, it is the south outermost island under East Nusa Tenggara province.A typical rural household load demand used in this study is presented in Table 1. Typical daily household load profile for selected site is shown in Fig. 1.
TABLEI
TYPICAL RURAL HOUSEHOLD’S INSTALLED ELECTRIC EQUIPMENT Equipment Power
(W)
Daily Usage (hour)
Energy (Watt hr/day)
Lamps
• Terrace 10 10 100
• Room 30 6 180
• Kitchen 10 3 30
• Toilet 10 1 10
Tape/Radio 30 4 120
VCR/TV 70 3 210
Total 650
Fig. 1 Typical daily load profile for the selected site
E6 - 1
As seen on Fig. 1, the peak load demand of a typical household in this study is occurred around 6 PM to 9 PM, for which the major appliances is utilizing for lighting and entertainment purposes.
B. Renewable Energy Resources
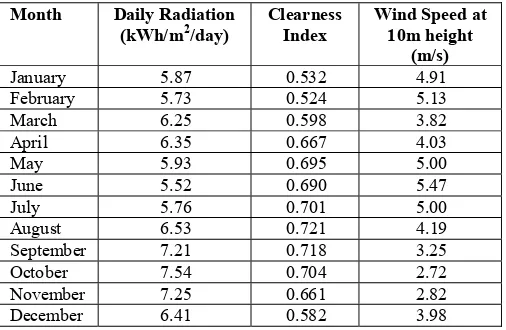
Energy from solar radiation and wind speed are used to produce electricity as part of a hybrid stand-alone system. Both type of energy are sufficiently available throughout the year in the selected location. As hourly data for solar radiation measurement are not available, the monthly average global radiation data were taken from NASA through NASA’s Surface Solar Energy Data Set. The annual average daily radiation and the clearness index are summarized in Table 2. For the wind resource, as the hourly wind speed data is not available, hourly data can be generated synthetically from the monthly average. For this study, the monthly wind speed is obtained from NASA database. This is the average of the last ten years, measured at the height of 10 meters above the ground. The selected rural location is received a fairly good wind speed despite the average wind speed in Indonesia is rather low. The average monthly wind speed throughout the year is given in Table 2 as well.
TABLEII
RENEWABLE ENERGY RESOURCES CHARACTERISTICS Month Daily Radiation
(kWh/m2/day)
Clearness Index
Wind Speed at 10m height
(m/s)
January 5.87 0.532 4.91 February 5.73 0.524 5.13
March 6.25 0.598 3.82
April 6.35 0.667 4.03
May 5.93 0.695 5.00
June 5.52 0.690 5.47
July 5.76 0.701 5.00
August 6.53 0.721 4.19
September 7.21 0.718 3.25
October 7.54 0.704 2.72
November 7.25 0.661 2.82
December 6.41 0.582 3.98
C. Hybrid System Modelling and Specifications
Hybrid power systems is the integration of two or more resources as of different combinations of components such as diesel generators, wind turbines, photovoltaic systems, hydro turbines and various energy storage devices, one of which is generally renewable, in order to form a power supply. In this regards, renewable energy sources, especially wind and solar, are inherently stochastic in nature and thus are unreliable power sources by themselves [7]. Therefore, energy storage systems will be required for each of renewable energy systems in order to satisfy the power demands. Usually storage system is expensive and the size has to be reduced to a minimum possible for the renewable energy system to be cost effective. In this study, an AC gasoline generator is added as non renewable resource to the prior system consisting renewable
energy resource. A converter is therefore needed to maintain the flow of energy between the AC and DC component. The schematic of the proposed hybrid systems are shown in Fig. 2.
Fig. 2 The proposed hybrid system with a diesel generator
The modeling and specification of the proposed hybrid system consists of solar home system (PV module), home wind turbine, battery, an AC gasoline generator, and converter are discussed bellows.
1) PV Module: The PV Modules produce electricity in direct proportion to the global solar radiation. The power output of the PV Modules by ignoring the effect of temperature is calculated as [5]:
⎟⎟ ⎟ ⎠ ⎞ ⎜⎜
⎜ ⎝ ⎛ =
STC T G
T G PV f PV Y PV P
,
(1)
w
herePV
Y is the power output under standard test condition
(kW)
,
PV
f is the PV de-rating factor
,
GT is the solarradiation incident on the PV array in the current time step
(kW/m2)
,
GT,STC is PV cell temperature under standard testconditions (25 °C)
.
Several PV module sizes in terms of ratedpower output are considered, including 50, 85, 100, 125, 135,
180, and 270Wpeak. For example, the maximum voltage of a
135W peak PV panel is 17.7V with the maximum current of 7.63A. The open circuit voltage is 22.1 V, short circuit current is 8.37A, and maximum system voltage is 600V DC. The initial cost of a 135W peak solar PV panel is US$ 530 with a replacement cost of US$ 430. Each PV panel produces direct current with no tracking system. The de-rating factor, which is a factor which accounts for losses and dirt, is 85%. The ground reflectance of solar radiation is 20% and the lifetime expectancy of the solar PV panels is 25 years.
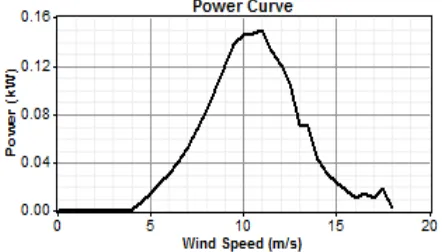
turbine. Maximum power output that can be generated by a wind turbine is based on [5]:
PMax
wind velocity (m/s), and CPMax is theoretical maximum
power efficiency (0.59). The wind turbine used in this study has a rotor diameter of 1.15 m and working at nominal voltage of 12/24/48 V DC. Its nominal capacity per month is 38 kWh at the wind speed of 5.4 m/s with the starting speed of 3.58 m/s. The initial cost is US$ 700 and the replacement cost is US$ 300, with annual operation and maintenance cost is neglected. The hub and anemometer of this wind turbine is located at a height of 10 m as the location is located 50 m above the sea level, and it is estimated to serve for 15 years. The scaled annual average wind speed is determined in the range of the start up speed of the wind turbine to the highest wind speed, which is 3.5 m/s, 4 m/s, 5 m/s, and 5.5 m/s.
Fig. 2 Power curve with respect to wind speed for the selected wind turbine
3) Battery: A battery capacity to store electricity at fixed round-trip energy efficiency is limited as to how quickly it can be charged or discharged, how deeply it can be discharged without causing damage, and how much energy can cycle through it before it needs to be replaced. The maximum charging and discharging power are calculated as in [8]:
)
Q is the available energy (kWh) in the battery at the
beginning of the time step, Q is the total amount of energy
(kWh) at the beginning of the time step, c is the battery
capacity ratio, k is the battery rate constant (hour-1), Δt is the
length of the time step (hour), and
max
Q is the total capacity
of the battery bank (kWh). The battery is rated at a nominal voltage of 12 V DC with nominal capacity of 200 Ah, 2.4 kWh. The battery state of charge is 40% and the lifetime throughput is 917 kWh. Initial cost is US$ 480 and the replacement cost is US$ 380 with operating and maintenance cost US$ 3 per year.
4) AC Gasoline Generator: The cost of energy from the generator can be divided into two parts. The first part is the fixed cost of energy which represents the cost per hour of simply running the generator without producing any electricity. The first part is calculated from [8]:
eff
, is the operation and maintenance cost (US$/hour),
gen rep C
, is the replacement cost (US$), Rgen
is the generator lifetime (hour), 0
F is the fuel curve intercept
coefficient (liter/kWh),
gen
Y is the capacity of generator
(kW),
eff fuel C
, is the effective price of fuel (US$/liter). The second part is the marginal cost of energy which represents the additional cost per kilowatt-hour of producing electricity from the generator. This cost is given as in:
eff
F is the fuel curve slope (liter/kWh),
eff fuel C
, is the effective price of fuel (US$/liter). The initial cost of a 1 kW AC gasoline generator is US$ 240 with a replacement cost of US$ 200 and hourly maintenance of US$ 0.04. This generator is estimated to operate during 15,000 hours with a minimum load ratio of 30%. The gasoline is priced at US$ 0.80 per liter. Sizes to be considered are 1 kW, 2 kW, and 2.5 kW.
5) Converter: The initial capital cost a 1 kW converter is US$ 730 with a replacement cost of US$ 730. The expected lifetime of the converter is 25 years in which the efficiency of the inverter is 90% and the rectifier 85%.
)
, is the total annualized cost (US$/year),
CRFis the capital recovery factor, i is the interest rate (%),
proj
R is the project life time (year), and N is number of
years.
All prices are assumed to escalate at the same rate over the project lifetime. The real annual interest rate is considered 8% and project lifetime is taken 25 years. Salvage value is assumed linear depreciation of components and is given by:
comp
component lifetime (year), and
rep
R is the replacement cost
duration (year).
Lastly, the cost of energy is defined as the average cost per kWh of useful electrical energy produced by the system. It is calculated from dividing the annualized cost of producing electricity (the total annualized cost minus the cost of serving the thermal load) with respect to the total useful electric energy production. Since there is no thermal load, the equation for the cost of energy is as follows:
AC
the total annualized cost (US$/year), DC E and
AC
E is DC
and AC primary load served, respectively (kWh/year).
III.SIMULATION RESULTS AND DISCUSSION
HOMER simulates the operation of a system by making energy balance calculations for each of the 8,760 hours in a year. For each hour, HOMER compares the electric demand in the hour to the energy that the system can supply in that hour, and calculates the flows of energy to and from each component of the system. It then determines whether a configuration is feasible, i.e., whether it can meet the electric demand under the specified conditions, and estimates the cost of installing and operating the system over the lifetime of the project. Simulations are carried out under the predetermined system control constraint which is the annual maximum
system shortage. The predetermined value is set to 0, meaning during a year the hybrid generation should be able to supply electricity uninterrupted with respect to the load power demand.
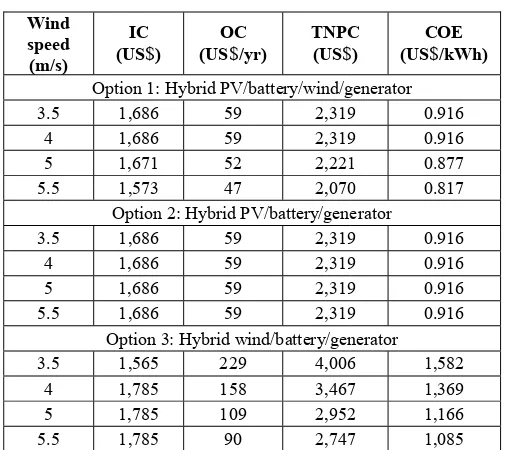
The system cost calculations account for costs such as capital, replacement, operation and maintenance, fuel, and interest. In this study, the alternative hybrid systems are developed according to the number of possible combination over all component size for sensitivity condition, namely wind speed (3.5, 4, 5, and 5.5 m/s), to meet the technical conditions. The economic parameters such as initial cost (IC), total net present cost (TNPC), and cost of energy (COE) are calculated for each alternative system. Because there are totally 4 sensitivity conditions, the optimum hybrid system for each sensitivity case is the system having minimum IC, minimum TNPC, and minimum COE for that case. In this study, optimum hybrid system based on simulations is presented in Table 3. In addition, economic indicator for each optimum sizing is shown in Table 4.
TABLEIII
Option 1: Hybrid PV/battery/wind/generator
3.5 0.185 - 2 - -
4 0.185 - 2 - -
5 0.125 1 1 - -
5.5 0.100 1 1 - -
Option 2: Hybrid PV/battery/generator
3.5 0.185 - 2 - -
4 0.185 - 2 - -
5 0.185 - 2 - -
5.5 0.185 - 2 - -
Option 3: Hybrid wind/battery/generator
3.5 - - 2 1 0.5
4 - 1 1 1 0.5
5 - 1 1 1 0.5
5.5 - 1 1 1 0.5
PV is Photovoltaic, Batt is Battery, Gen is Generator, WT is wind turbine, Conv is Converter.
case, the possible lowest COE might reac for 5.5 m/s wind speed.
TABLEIV ECONOMIC INDICATOR FOR OPTIMUM CON Wind
speed (m/s)
IC (US$)
OC (US$/yr)
TNPC (US$
Option 1: Hybrid PV/battery/wind/g 3.5 1,686 59 2,319 4 1,686 59 2,319 5 1,671 52 2,221 5.5 1,573 47 2,070 Option 2: Hybrid PV/battery/gene 3.5 1,686 59 2,319 4 1,686 59 2,319 5 1,686 59 2,319 5.5 1,686 59 2,319 Option 3: Hybrid wind/battery/gen 3.5 1,565 229 4,006 4 1,785 158 3,467 5 1,785 109 2,952 5.5 1,785 90 2,747
IC is Initial Cost, OC is Operating Cost, TNPC is Total is Cost of Energy
In option 2, the absence of wind turbine system consists of only PV and battery, for power as well as the number of battery re 0.185 kW and 2 units, respectively. Economi constant IC, OC, TNPC, and COE irrespec changes. In this case, COE might reach US$ In option 3, the absence of PV makes ge are feasible choices for the lowest wind spe wind speed, wind turbine comes into serv battery and generator. In this case, there wi lower OC, TNPC, and COE as increa However, the possible lowest COE is indicating option 3 is the most expensive options. In case of PV, battery, wind turb are available as options, optimum hybrid sy of PV, battery, and wind turbine for all sen In addition, based on Table 3 the energy st i.e. battery could be minimized to only presence of wind turbine.
For all options, the highest IC, OC, and T by hybrid systems in option 3 compared to condition is mainly caused by the use of gas The lowest IC, OC, TNPC, and more im obtained by PV, wind turbine, and batt option 1, in which generator is also inclu power generation source. Thus, optimu supplying electricity for a typical house comprised of PV, battery and wind turb simulations.
ch US$ 0.817/kWh
NFIGURATION
C
$)
COE (US$/kWh)
generator
9 0.916 9 0.916 1 0.877 0 0.817
erator
9 0.916 9 0.916 9 0.916 9 0.916 nerator
6 1,582 7 1,369 2 1,166 7 1,085
l Net Present Cost, COE
e makes the hybrid which the PV rated emain constant, i.e.
ically, there will be ctive to wind speed $ 0.916/kWh.
nerator and battery ed case. For higher vice together with ill be higher IC but asing wind speed.
US$ 1.085/kWh, compared to other bine, and generator ystem is comprised nsitivity conditions. torage requirement y 1 unit with the
TNPC are exhibited other options. This soline for generator. mportantly COE is
tery, coming from uded as a possible um hybrid system
hold is preferable bine, based on all
Monthly average electricity hybrid system under option 1 i the system’s economic and optim account all wind speed con production from wind turbine i increasing along with the incre wind speed, 50% electricity cou turbine. Moreover, electricity p could be reached up to 61% a highest wind speed condition.
Regarding to the system’s r configuration in option 1 prov the annual maximum system irrespective to the absence of ge
Fig. 3 Monthly average electricity p
Fig. 4 Monthly average electricity
Fig. 5 Monthly average electricity p
production (kW) for optimum is also presented in addition to mum configuration, taking into nditions. Share on electricity
is considerably significant and easing wind speed. For 5 m/s uld be produced from the wind production from wind turbine against 39% of PV during the
eliability, the optimum hybrid vides excellent reliability since m shortage constraint is met
enerator.
roduction for 3.5-4 m/s wind speed
y production for 5 m/s wind speed
IV.CONCLUSIONS
In this study, the configuration of PV module, battery, and wind turbine has shown the most viable solution both in technical and economical over a range of considered technology options included AC gasoline generator. It is proved that the economic indicator such as initial cost, operating cost, total net present cost, and more importantly cost of energy of the optimum hybrid system under all sensitivity conditions, is relatively lower without the presence of generator in the system. This is mainly caused by the absence of fuel cost imposed in the system.
The system reliability remains unaffected and the issue of reducing energy storage requirement can be neglected in the case of hybrid stand-alone electricity supplying a typical rural household. In addition, energy produced from renewable energy resources is more environmentally friendly than that produced from generators. However, performance of hybrid renewable energy resource including the role of generator for the remote community-size electrification should be further investigated although the technical and economical objectives are considered to be similar.
REFERENCES
[1] PT. PLN (Persero), National Electricity Planning and Provisioning 2009-2018. Jakarta, Indonesia: Directorate of Planning and Technology PT. PLN (Persero), 2009.
[2] S. Jalilzadeh, H. Kord, A. Rohani, “Optimization and Techno-Economic Analysis of Autonomous Photovoltaic/Fuel Cell Energy,”
ECTI Transactions on Electrical Eng., Electronics, and Communications vol. 8, no. 1, Feb 2010: 118-125.
[3] Y. Tanoto, “Optimization Analysis of Modular Distributed Generation for Isolated Load (in Bahasa Indonesia),” in Proc. TEKNOIN 2010, paper p. D63-D69.
[4] Y. Hongxing, Z. Wei, L. Chengzhi, “Optimal Design and Techno-Economic Analysis of a Hybrid Solar Wind Power Generation System,”
Applied Energy 86, 2009: 163–169.
[5] A.M.A. Haidar, P.N. John, M. Shawal, “Optimal Configuration Assessment of Renewable Energy in Malaysia,” Renewable Energy 36, 2010: 881-888.
[6] T. Lambert, PG. Gilman, P. Lilienthal (2006). Micropower System Modeling with HOMER. [Online]. Available:
http://www.pspb.org/e21/media/HOMERModelingInformation.pdf
[7] M. Muralikrishna, V. Lakshminarayana, “Hybrid (Solar and Wind) Energy Systems for Rural Electrification,” ARPN Journal of Engineering and Applied Sciences vol. 3, no. 5, Oct 2008: 50-58. [8] A.H. Mondal, M. Denich, “Hybrid Systems for Decentralized Power