FINAL PROJECT – RC14-1501
IMPROVING SURABAYA RIVER WATER QUALITY BY OBSERVING
HYDROLOGICAL SYSTEM INCLUDING POLLUTANT SOURCES
AND OPTIMIZING MONITORING SYSTEM
NURMALA DEVIANTI SUKMANIA
3113 100 138
Supervisor :
Dr. Tech. Umboro Lasminto, ST, Msc
TUGAS AKHIR-RC14-1501
PENINGKATAN KUALITAS AIR SUNGAI SURABAYA
DENGAN
MENINJAU
SISTEM
HIDROLOGI
TERMASUK SUMBER POLUTAN DAN OPTIMALISASI
SISTEM MONITORING
NURMALA DEVIANTI SUKMANIA NRP 3113 100 138
Dosen Pembimbing
Dr. Tech. Umboro Lasminto, ST. M.Sc NIP. 197212022199802001
FINAL PROJECT-RC14-1501
IMPROVING SURABAYA RIVER WATER QUALITY
BY
OBSERVING
HYDROLOGICAL
SYSTEM
INCLUDING
POLLUTANT
SOURCES
AND
OPTIMIZING MONITORING SYSTEM
NURMALA DEVIANTI SUKMANIA NRP 3113 100 138
Supervisor
Dr. Tech. Umboro Lasminto, ST. M.Sc NIP. 197212022199802001
ii
iii
HIDROLOGI TERMASUK SUMBER POLUTAN DAN
OPTIMALISASI SISTEM MONITORING
Nama Mahasiswa : Nurmala Devianti Sukmania
NRP : 3113100138
Jurusan : Teknik Sipil FTSP ITS
Dosen Pembimbing : Dr. Techn Umboro Lasminto,
S.T., M.Sc
Abstrak
Daerah Aliran Sungai (DAS) Brantas sebagai DAS terbesar kedua di Provinsi Jawa Timur secara perlahan terkontaminasi oleh air buangan dampak dari pembangunan di Pulau Jawa, Indonesia. Sungai Surabaya, sebagai salah satu cabangnya, pada hakikatnya mengalir sepanjang beberapa kabupaten dan kota menuju Laut Jawa digunakan oleh masyarakat untuk kebutuhan sehari-hari termasuk sebagai air minum. Namun, banyaknya polutan yang masuk mencemari Sungai Surabaya menyebabkan kualitas air Sungai Surabaya menjadi buruk. Selain itu, pemerintah masih menitik-beratkan pada kuantitas seperti kontrol banjir, namun kualitas dan sistem monitoring sebagai salah satu aspek terpenting untuk memberikan informasi kepada masyarakat dan institusi masih belum dikontrol sepenuhnya.
iv
dan beberapa rekomendasi dibuat dengan tujuan memperbaiki kualitas air Sungai Surabaya.
Berdasarkan perhitungan air buangan, ditemukan bahwa lebih dari 60 desa yang terletak sepanjang Sungai Surabaya berdampak kepada kualitas air sungai karena membuang air limbah domestik dengan atau tanpa pengelohan air limbah, seperti fasilitas sanitasi, menuju Sungai Surabaya. Diestimasikan air buangan yang masuk dapat mencapai 15207.20 m3/day, dengan beban BOD dari air limbah domestik dapat mencapai 7749.34 kg/day dan konsentrasi BOD rata-rata adalah 482.97 mg/L. Data sekunder dari Balai Besar Wilayah Sungai Brantas menunjang status air Sungai Surabaya sebagai air tercemar dengan membuktikan bahwa 6 dari 12 parameter yang dikontrol, termasuk parameter kimia dan parameter fisika, tidak memenuhi standar sebagai air kelas II sebagaimana telah ditetapkan oleh pemerintah. Data dari Program Penilaian Peringkat Kinerja perusahaan (PROPER) oleh Kementrian Lingkungan Hidup juga menunjukan bahwa setidaknya 16 industri melebihi kapasitas air limbah buangan yang diizinkan. Dengan bantuan Google Earth, dapat dilihat bahwa lokasi monitoring yang ada tidak sepenuhnya mengontrol area dan industry yang mencemari Sungai Surabaya sementara waktu yang dilakukan untuk memonitor Sungai Surabaya sangat kurang. Berdasarkan analisa diatas yang telah dilakukan, beberapa rekomendasi dibuat untuk optimalisasi sistem monitoring dengan harapan dapat memperbaiki kualitas sungai air Surabaya. Solusi dari tugas akhir ini adalah menambah lokasi-lokasi berpotensi untuk dimonitor, pemakaian data logger, melakukan biomonitoring, dan penelitian lebih dalam untuk kemungkinan pengaplikasian sensor kualitas air kreatif.
v
INCLUDING POLLUTANT SOURCES AND
OPTIMIZING MONITORING SYSTEM
Name : Nurmala Devianti Sukmania
Identity Number : 3113100138
Major Department : Teknik Sipil FTSP ITS
Supervisor : Dr. Techn Umboro Lasminto,
S.T., M.Sc
Abstract
Brantas River Basin as the second basin in East Java Province eventually contaminated by the wastewater as one of the impacts of development in Java Island, Indonesia. Surabaya River, as one of the sub-branches, flowing along some districts institution focus on quantity such as flood control, its quality has not been fully controlled yet, and monitoring stay behind.
vi
vii
In the Name of Allah, the Beneficent, the Merciful. First praise is to Allah SWT, on whom ultimately we depend for sustenance guidance, who gives me permission to the author can
finish this thesis project with the title of “Improving Surabaya
River Water Quality by Observing Hydrological Including Pollutant Sources and Optimizing Monitoring System” on time. Secondly, Shalawat and greetings remain poured to the Propher Muhammad SAW who has been fighting for Islam and guiding us on the path of Allah SWT the Almighty.
I would like to use this opportunity to express my gratitude to everyone for their continuous support and contributing throughout the writing of this thesis, making the writing of this study possible.
1. Dr. Ir. F (Floris) Boogaard from Hanze University of Applied Sciences Groningen as subject specialist, for his advices, support, guidance, valuable feedbacks, and provision that benefited his much in completion and success of this study;
2. Mr. Alex van Oost from Hanze University of Applied Sciences as university supervisor for tirelessly giving supports, guidance, and support during this thesis period; 3. Mr. Eric Boer from Hanze University of Applied
Sciences as the reader and international student coordinator, for his help and attention to lead the author focusing requires compenteces as a graduate student; 4. Mr. Michael Bosscher and Mr. Olof Akkerman from
Hanze University of Applied Sciences for giving support, advices, valuable discussion, and feedback tirelessly; 5. Mrs. Sandra Junier from TU Delft for her valuable
discussion;
viii
7. Indonesian people, especially Mr. Prigi Risandi from Ecoton and all the staff of Ecoton Indonesia, Mrs. Dian A. Prayitno from BBWS and all the staff of BBWS Brantas, and some students from Sepuluh Nopember Institute of Technology for providing valuable information regarding this graduation project;
8. Staff of Hanze University of Applied Sciences and Sepuluh Nopember Institute Technology for helping the writer handling administration problem during the period of completing this thesis project;
9. Her beloved bestfriends, friends, relation, classmate, colleagues, especially to Astriawati, Decyntya Puspa, Panglima Norman, Mohammad Afis Sunarno, and CEITS 2013 for their love, moral support, helps, remarkable encouragement, and for many memorable memories during the time I spent at the University;
10. Most importantly, her beloved parents, Hariawan Sukma Dewanto and Nuri Nurhayati and brother, Abdul Ghoffaar Noorwandi, for their patients, abundant love, caring, understanding, and infinity support to pursue this thesis project. It would be an understatement to say that, as a family, we have experienced some ups and downs in the past 4 years and everytime I was ready to quit, you did not let me and I am forever grateful;
11. And all the people that the author cannot mention here one by ine that helped her finishing this thesis project. The author completely understands that this report still needs to be improved. The author hopes this thesis report will be useful and easily understandable for whom it may concern.
Surabaya, July 2017
ix
2.5.
Surface Water Contamination
... 11
2.5.1.
Toxic Compounds
... 11
2.5.2
Suspended Solids
... 13
2.5.3.
Eutrophication
... 13
x
2.6.
Water Quality Monitoring System in Brantas River
and Surabaya River
... 17
3.4.1.
Interview with experts
... 22
3.4.2.
Quality data
... 22
3.4.3.
Map of water monitoring location
... 23
3.4.4.
Water quality monitoring schedule
... 23
3.4.5.
Amount of Population
... 23
3.5.
Hydrological Analysis (wastewater discharge)
.... 23
3.6.
Monitoring System Analysis
... 24
CHAPTER 4 DATA AND ANALYSIS ... 25
4.1.
General Review
... 25
4.2.
Wastewater discharge
... 26
4.3.
Investigation of the Quality of the Water in
Surabaya River
... 32
4.3.1.
Physical Parameter Result
... 33
4.3.2.
Chemical Parameter Result
... 38
xi
4.4.2.
Evalation by government’s law and Indonesia
National Standard
... 49
4.5.
Discussion and Result
... 52
4.6.
Solution to optimize the monitoring system
... 54
4.6.1.
Adding more location to monitor the quality
water
54
4.6.2.
Data logger as a first step to indicate the
pollution
... 56
4.6.3.
Biological monitoring (biomonitoring)
... 59
4.6.4.
Creative water quality sensor
... 62
CHAPTER 5 CONCLUSION AND RECOMMENDATION ... 65
5.1.
Conclusion
... 65
5.2.
Recommendation
... 67
BIBLIOGRAPHY ... 69
APPENDIX ... 73
xii
Figure 1. 2 Surabaya River ... 3
Figure 2. 1 Administrative map of Brantas River Basin ... 8
Figure 3. 1 Methodology Flowchart ... 21
Figure 4. 1 Villages Located 500 Meters near Surabaya River ... 27
Figure 4. 2 Increasing of Population using growth rate formula . 28 Figure 4. 3 Example of percentage population with and without sanitation facilities ... 29
Figure 4. 4 Scheme of domestic wastewater along Surabaya River ... 32
Figure 4. 5 Temperature result (in oC) ... 34
Figure 4. 6 Turbidity level ... 35
Figure 4. 7 Total Suspended Solids ... 35
Figure 4. 8 Total Dissolved Solids ... 36
Figure 4. 9 Conductivity Result ... 37
Figure 4. 10 PH result... 38
Figure 4. 11 Dissolved Oxygen Result ... 39
Figure 4. 12 BOD result ... 40
Figure 4. 13 COD Result ... 41
Figure 4. 14 Ammonia result ... 41
Figure 4. 15 Nitrate result... 42
Figure 4. 16 Nitrite result ... 43
Figure 4. 17 Phosphate Result ... 44
Figure 4. 18 Exact location of Bambe Bridge and Perning Bridge ... 47
Figure 4. 19 Location of monitoring point in Surabaya River .... 48
Figure 4. 20 New potential locations: point 1 and point 2 ... 55
Figure 4. 21 New potential location: Point 3 ... 55
Figure 4. 22 Locations where data logger can be applied as a first step to indicate contamination ... 57
Figure 4. 23 Example of data logger (Aqua TROLL 600 Multi Parameters by In-Situ Inc. Company) ... 58
Figure 4. 24 Example of biomonitoring ... 61
xiii
Table 2. 2 The standard parameters for each class ... 18
Table 2. 3 Standard determination of the quality of the water .... 19
Table 2. 4 Score Determination ... 20
Table 4. 1 Population growth in East Java, Indonesia 27 Table 4. 2 Monitoring locations ... 33
Table 4. 3 Water quality result ... 45
Table 4. 4 The state of the quality of the water in Surabaya River ... 45
Table 4. 5 Industries dispose excessed wastewater ... 46
Table 4. 6 Monitoring Segment ... 48
Table 4. 7 Villages and industries with no monitoring ... 49
Table 4. 8 Time and Location of Water Quality Monitoring in Brantas River ... 50
xiv
1
CHAPTER I
INTRODUCTION
1.1. Background
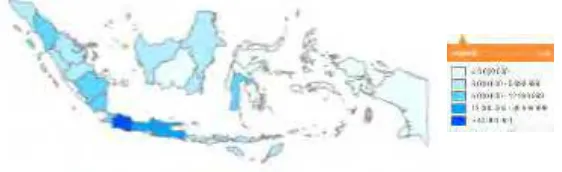
Indonesia, as the largest archipelago country in the world which strategically positioned between the Pacific and Indian oceans, consists of five biggest islands including Sumatra, Java, Borneo, Sulawesi, and Papua, and over than 17.500 small islands including Bali and Strait of Sunda. According to Indonesia census year 2010, the total population of the country is 237.641.326 with the average density of population is 124 per km2. However, the
population varies considerably from island to island, that lead to imbalance distribution of the population in each province as it shown figure 1.1. This uneven distribution of population impacts on several problems in each province, concerning on poor infrastructure as the major problem, especially water quality aspect. This also impacts on the quality of education in which less equal in some areas. As its consequence, this leads to lack of awareness from the community about environmental aspect as the most important thing to be maintained.
Java Island, as it stated as the most populous island in Indonesia, is also being influenced by the impact of this inequity of distribution. As its result, the quality of the water in Java Island has been deteriorated by urban development. One of the basin that is being the major concern from the government is Brantas River Basin.
According to Ministry of Public Works, it is explained that Brantas River Basin is the second biggest basin in Java Island, located in East Java Province, Indonesia. Its Brantas River has total length which is approximately 320 km and the basin area is around 14.103 km2, covering 25% of East Java province area.
Water resources in Brantas River Basin are an important aspect for people needs, from and for human civilization, and without any water resources development, the fulfillment of human needs has not reached a satisfying condition.
Figure 1. 2 Surabaya River
According to Living Environemntal of Ketapang District (2005), it is stated that monitoring system intends to inform the factual data about current condition on water quality in Brantas River Basin, tendencies and dependencies on the past and environmental changes prediction in the future, and moreover its information can be used as a reference for designing, evaluating, and controlling environmental surveillance, policymaking on management of the environment and legislation regulation. It can be concluded that monitoring system is the first and the most necessary role that needed to be improved before it leads to the improvement and the restoration of Surabaya River itself.
This research project is a follow-through of the research in which the author wants to focus on evaluating and optimizing the monitoring system in Surabaya River. In order to develop this research subject, the author will have some literature review and study case will be planned. The aim is to give a conclusion and recommendation to optimize monitoring system in Surabaya River of East Java, Indonesia.
1.2. Research Question
especially Surabaya, that have been explained above. Research hydrological system including pollutant sources and optimizing monitoring system in Indonesia?”
Sub-Questions:
What is water monitoring system?
- Literature review and explanation about water monitoring
system (conceptual background)
How does the water monitoring system work in Surabaya River of East Java, Indonesia?
- Find the data about the current performance of water
monitoring system (how it works, how many stations, etc) in Surabaya River of East Java
What is the main problem of water quality monitoring system in Surabaya River of East Java, Indonesia?
- Identify the main problem of water quality monitoring
system in Surabaya River of East Java, Indonesia. This can be based on literature review and interview with some responsible stakeholders of Surabaya River
How is the condition of water quality in Surabaya River of East Java, Indonesia?
- Analyze the existing condition of Surabaya River
Has the existing water quality monitoring system in Surabaya River been well optimized to control the quality of its water?
- Study case by hydrological analysis and water quality
What is the best solution to optimize the water quality monitoring system in Surabaya River of East Java, Indonesia by approaching the most sustainable system that has been used in some other countries?
- Approaching some countries as a reference to optimize the
water quality monitoring system in Surabaya River of East Java, Indonesia. In this case, the author chooses Netherlands as the referenced country.
1.3. Research Objective
Giving information about current water quality monitoring system in Brantas River, analyzing and evaluating the main problem of water quality monitoring system in Surabaya River, and recommending solution that can be adapted by the existing condition referenced to Netherlands.
1.4. Scope of Work
In this research, the author made some limitations and scopes to keep the concern on the main topic. These would make sure the research can be well conducted. Below are the limitations and scope of this research:
a. The period of this research is 3 months, start from 13 February 2017 until 29 May 2017
b. This research is based on the real project of Brantas River Basin of East Java, Indonesia
h. The author will not consider the impact of economic and social life
7
CHAPTER 2
LITERATURE REVIEW
2.1. Brantas River
Brantas River is the second longest river after Bengawan Solo River in Java Island, Indonesia. The water source is located in Sumber Brantas Village, Batu, flowing to Malang, Blitar, Tulungagung, Kediri, Nganjuk, Jombang, and Mojokerto. In Mojokerto, Brantas River split into two branches, Surabaya River (flowing into Surabaya) and Porong River (flowing into Porong, Sidoarjo District). (PUPR, 2005)
Brantas River Basin is a national strategic basin, authorized by the Central Government (Pemerintah Pusat), under the regulation of Ministry of Public Works (PerMen PU) number 11A Year 2006 on River Basin Establishment and Criteria. The area of Brantas River Basin is 14.013 km2, crossing through 9
districts and 6 cities, or similar with 26.5% of total area of East Java Province, Indonesia. The river length is 320 km, flowing accross an active volcano, Mount Kelud. In 2005, the population of Brantas River Basin is 15.844, approximately 43% of total population in East Java Province, with population density 1272 per km2. (PUPR, 2005)
The average rainfall intensity in Brantas River reached 2000 mm per year, with 85% of the total rainfall intensity falls in rainy season. The average surface water potential is 12 billion m3
per year, but the available dams can only utilize around 2.6 – 3 billion m3 per year. Brantas River has a really important role on
(Source: Ministry of Public Works)
2.2. Surabaya River
Surabaya River is the branch of Brantas River, flowing from Mlirip Floodgate into East-Sea, crossing Brantas delta and disembogue on Jagir Floodgate, Wonokromo area, Surabaya City. The total length of Surabaya River from Mlirip Dam into Jagir Dam is 41 km. The main function of Surabaya River is the main raw material for drinking water, irrigation, raw material for industrial water, and main water resources in Surabaya. For instance, Surabaya PDAM and Sidoarjo PDAM as the local drinking water company are the institution that takes benefit from the natural water from Surabaya River (PUPR, 2005).
Basin Authority in Brantas River (BBWS) stated that in Jagir Dam the River split into 2 sub-branches: Mas River and Wonokromo River in which both of them downstream in Java Sea. There are several small rivers in which dwastewater flows and contaminated Surabaya River: Mlirip River, Marmoyo River, Lamong River, Kedondong River, Central River, Kedurus River.
The quality of Surabaya River is mostly affected by industries. In these past few years, both of the government and non-government organizations are concerning Surabaya River to be the main sources for their natural drinking water, but at the
same time the quality is getting worse, indicated with a lot of dead fish, even extinction of some of fish types in Surabaya River that never been seen again in the river. These impacts encourage East Java Province Government, Non-Government Organization, and other responsible stakeholders to conduct variable events in order to improve and restore the condition of Surabaya River as it is supposed to be. (PUPR, 2005)
2.3. Hydrological System
Hydrological system is a term of entire cycle of water movement while total volume of water in the world remains constant. In addition, something that will change in the water are its quality and its availability. Research about hydrological system (Franks, 1987) stated that water is constantly moving, driven by solar energy. Evaporation is being known as the process of water heat into the sky by the sun. This process leads to cloud-form and precipitation (rainfall). Evaporation also occurs from lakes and rivers. When evaporation contributes significant quantities of the water by the plant, this process is called evapotranspiration. While 80% of precipitation falls back to the ocean, the remainder falls onto land. This water repenlishes soil and groundwater, fills the streams and lakes, and provides all the needed water. Movement of water is continuous and so water is a renewable resource.
2.4. Wastewater Discharge
In his book, Corcoran et al. (2010) stated that wastewater is defined as a combination of one or more of:
Domestic effluent consisting black water (excreta, urine, and faecal sludge), and grey water (kitchen and bathing wastewater);
Water from commercial establishment and institutions (including hospital);
Industrial effluent, storm water, and other urban run-off;
Agricultural, holticultural and aquaculture effluent, either dissolved or as suspended matter.
Wastewater discharge is based on freshwater consumption per person per day. The amount of freshwater turns to wastewater is estimated in range between 60% - 85%. Wastewater discharge can be accumulated by these following formulas:
Q avg = Fresh water needed per person x total population (2.1)
Q waste = (60% - 85%) x Q avg (2.2)
According to Research and Development Centre, Ministry of Public Works, potential pollution load (PBP) can be estimated with this following formula below:
PBP = Population x Emission Factor x Equivalent Ratio x ∝(2.3)
Value for population emission factor:
∝ = 0.3, used for area in range more than 500 meters from the has been contaminated by one or several kinds of pollutant. The major type of pollutants that caused contamination on surface water are divided into 3 types; toxic compounds, oxygen balance affecting compounds, suspended solids and mechanical pollution, and eutrophication (Akkerman, 2016). pH and temperature are some of parameters that will affect the characteristic of water.
2.5.1. Toxic Compounds
Toxic compounds are divided into 3 types: chemicals, microbes, and radioactivity.
Chemicals cause damage for humans and biological (aquatic) activity. Some common chemical toxics that might be found on surface water are metals such as lead, zinc, copper, arsene, mercury, and mineral oil. Mineral oil mainly consists of alkane carbon chains, therefore the longer the chain (up to 40 C-C), the more difficult it is degradated in nature. The brief example of mineral oil in daily activity is car petrol, which mostly consists of mineral oil and benzene, and other compounds. Some main sources of these chemicals come from industrial wastewater, sewage overflow, petrol, oil, and run-off from industrial sites or roads. (Akkerman, 2016)
Microbes are very tiny single-cell organism that can fit into eye of a needle with million amounts, including bacteria, archaea, fungi, and protest 1. Because their existences are
everywhere and they have a really unique characteristic, some of
them are contaminated the quality of water as “bad microbes”.
1
Some of main examples that can be found on water sampling test are including E-coli (indicating fecal contamination), Streptococcus faecalis (indicating recent fecal contamination such as dogs, geese, and human poo), Cyanobacteria, and Clostridium botunilum. These microbes are usually found in stagnant water visible nor smell, in which the nuclear isotopes are being unstable and emit some kind of radiation when the nucleus experienced some intense conflict between the two strongest forces in nature, causing varieties of radioactive decay, in which the mainly types are alpha, beta, and gamma radiation2. Referenced from Ghosh, caused by drinking water that contains radon.
Oxygen balance affecting compound means that the compounds influence the level of dissolved oxygen in the water. Some compounds are consuming oxygen and therefore being degradated by oxidation. Some examples of oxygen balance affecting compounds are cooling water discharge, sewage discharge, dead fish or birds and leaves, and duckweeds. Oxygen level result of how much water can enter through the water/air interface, and how much food is consumed. The amount of food is related to the amount of consumed oxygen which is notaby called as Biochemical Oxygen Demand (Akkerman, 2016).
2 Source available at
Biochemical Oxygen Demand, as known as BOD, is determined as general parameter to define wastewater pollution. Defining BOD from upstream into estuary is necessary in order to track pollution flow in the water. BOD is size of the amount of organic material decomposing in the water. BOD process will decrease the amount of dissolved oxygen. If the oxygen is being utilized, water condition will be septic which leads to problems of aesthetic. (Corbitt, 2004)
Chemical Oxygen Demand, as known as COD, is how much amount of oxygen in ppm or milligram per liter (mg/l) which is needed at specific condition to decompose organic particle chemically (Sugiharto, 1987). COD shows amount of needed oxygen in oxidize organic things chemically, either chemical things that can be easily or hardly decomposed (Agustiningsih, 2012).
2.5.2 Suspended Solids
Suspended solids are not dissolved compound that, under the circumstances e.g. turbulence, do not float and sedimentation does not occur. This means that these compounds are difficult to catch. The compounds are usually lutum or silt parts (nano-size sludge particles) that are electrically charged. This affect on how other contaminations such as toxics can cling and stick into these compounds. (Akkerman, 2016)
2.5.3. Eutrophication
Eutrophication is divided into three circumstances; oligotrophic, hypertrophic, and eutrophic. Oligotrophic signified by few nutrients, high oxygen level (>80% saturation), and complete mineralization (BOD < 3 mg/l). Meanwhile, hypertrophic seems to be the opposite of oligotrophic; excessed of nutrition, low oxygen level (0-10% saturation), no mineralization (BOD > 15 mg/l), and contents of pathogens (bacteria causing illness). Eutrophic is known in Netherlands surface water, indicated by good nutrition, day-night oxygen level (0 – 50% saturation), and limited mineralization (BOD 5 – 15 mg/l). (Akkerman, 2016)
2.5.4. PH and Temperature
When water released into the environment with some
differences of the temperature, either it’s higher or lower, a
problem of temperature differences will appear. Water temperature related with physics, chemistry, and biological condition. Aquatic ecosystem can be disturbed as a result of temperature differences. (Corbitt, 2004 cited in Natalia, 2014 p.11)
Normal water neither has characteristic of acid nor bases, with value of acidity (pH) = 7. Water with value of acidity (pH) less than 6.5 can damage distribution pipes.
2.5. Water Quality Assessment
In his work on water technology, Gray (2010) stated that assessment of the water quality is critical for pollution control and the protection of surface and groundwater. Water quality often remains dynamic, so the quality data are needed specifically:
(a) because quality varies in space; (b) because varies in time;
(c) because waste loads differ at different points in the system;
(d) for effluent description
(e) for setting consents, mass balance calculations, and/or river modeling
The main factors influencing the variation in quality are dilution, water temperature causing variation in biological activity and oxygen solubility, and seasonal changes in water inputs. Selection of parameters for water quality assessment is dependent on the
(a) river: Biochemical Oxygen Demand (BOD), oxygen temperature, NH3, NO3, PO4, Cl, etc.;
(b) lake: oxygen (at various depth), temperature (at various depth), NO3, PO4, SiOs, Fe, Mn, Na, K, etc.;
(c) groundwater: Fe, Mn, NH3, SO4, As, F, conductivity;
(d) estuary: oxygen, temperature, BOD, suspended solids;
(e) drinking water: coliforms, Fe, Mn, toxic metals, pesticides, etc.;
(f) effluents;
(ii) industrial – toxic: COD, BOD, suspended solids, NH3, metals, and/or other toxic
compounds;
(g) general characteristics – typing water source, hardness, alkalinity, pH, color, conductivity, Fe, Cl, Na, K, silica, SO4, temperature, etc.
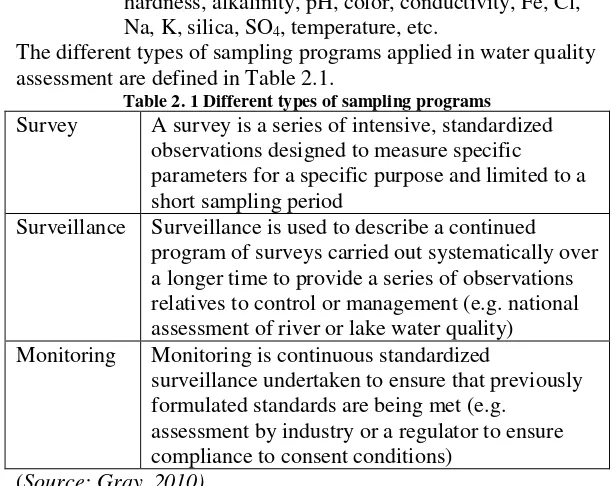
The different types of sampling programs applied in water quality assessment are defined in Table 2.1.
Table 2. 1 Different types of sampling programs
Survey A survey is a series of intensive, standardized observations designed to measure specific parameters for a specific purpose and limited to a short sampling period
Surveillance Surveillance is used to describe a continued program of surveys carried out systematically over a longer time to provide a series of observations relatives to control or management (e.g. national assessment of river or lake water quality) Monitoring Monitoring is continuous standardized
surveillance undertaken to ensure that previously formulated standards are being met (e.g.
assessment by industry or a regulator to ensure compliance to consent conditions)
(Source: Gray, 2010)
Research (Harmancioglu, et al., 1999) stated that water quality monitoring comprises all sampling activities to collect and process data on water quality for the purpose of obtaining information above the physical, biological, and chemical properties of water. Besides collecting data, monitoring activities cover the subsequent procedures, such as laboratory analysis, data processing, storage, and data analysis to produce expected information.
objective of maintaining the existing unpolluted or acceptable status of water quality; while the second one puts the emphasis on a control mechanism by reducing moderating pollution conditions. (Dandy and Moore, 1979; Karpuzu, et al., 1987 cited in Harmancioglu et al., 1999)
Monitoring system has an important role to define the quality status. Monitoring of the water quality can be performed in many ways depending on the reasons and the objectives of a particular monitoring programme, such as identification of state (concentration) and trends, identification of mass flow (loads), testing of compliance with standard and classifications, and early warning and detection.
2.6. Water Quality Monitoring System in Brantas River
and Surabaya River
There are 3 stakeholders that responsible in monitoring water quality; the first one is Jasa Tirta I which has a role to control the quality and report the progress into the government routinely; the second one is Basin Authority in Brantas River as a sub-directorate of Ministry of Public Works who has a role to manage and execute; and environmental consortium who has a role as security patrol of quality in Brantas River.
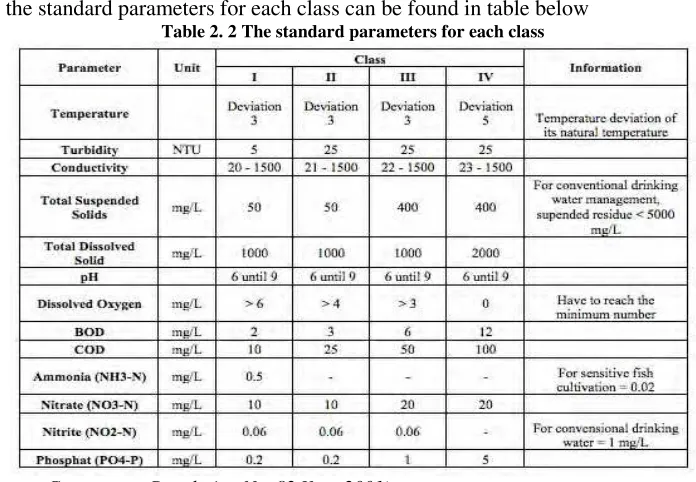
According to Government Regulation No. 82 Year 2001 of Water Quality and Water Pollutant Management, the water class is divided into 4 classes:
a. First Class: the utilization of the water is to being used as raw water for drinking water;
b. Second Class: the utilization of the water is to being used for recreation, fish cultivation, field and farms, and irrigation;
c. Third class: the utilization of the water is to being used for fish cultivation, farms, irrigation;
All the standard parameters for each class can be found in table below
Table 2. 2 The standard parameters for each class
According to Ministry of Environmental Regulation No.115 Year 2003 of Guidelines for Determining the State of the Water, determination of the quality is based on Storet Method. Storet Method is one of the most general methods to determine the status of water. With this method, the parameters that excess the limit can be known clearly. In general, this method is solely
comparing the quality data with the standard. “US-EPA (Environmental Protection Agency)” is referenced as the method to clarify the water quality in forth class, as it shown in table below.
Table 2. 3 Standard determination of the quality of the water
No Category Score Status
The procedure to determine the quality status of the water with Storet Method are explained below:
1. Making the time series data by collecting the data for the quality of the water and the discharge of the water in a periodic way;
2. Comparing the measurement result of the data of each parameters with the standard;
3. If the measurement result achieve the standard (measurement result < standard), mark it as 0;
4. If the measurement result does not achieve the standard (measurement result > standard), mark it as it explains in table 2.4;
Table 2. 4 Score Determination Total
Examples Value
Parameters
Physics Chemical Biology
< 10
Maximum -1 -2 -3
Minimum -1 -2 -3
Average -3 -6 -9
> 10
Maximum -2 -4 -6
Minimum -2 -4 -6
Average -6 -12 -19
Total examples are the total parameters that being used to determine the status of water quality
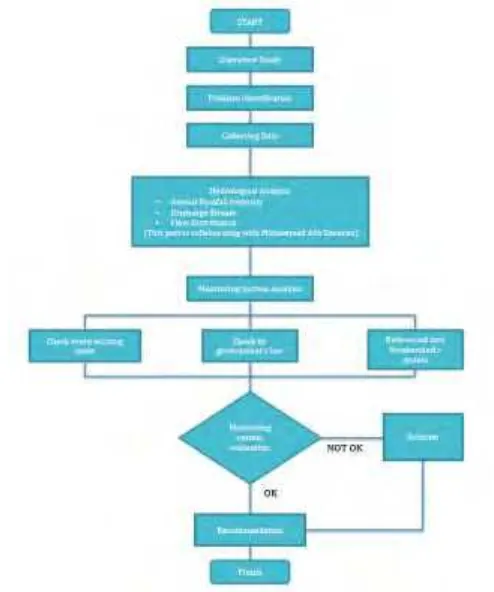
21
Figure 3. 1 Methodology Flowchart
CHAPTER 3
METHODOLOGY
In this chapter, a flowchart for the graduation project has been designed in order to lead every steps from beginning until the end of the process. Every steps will be explained briefly.
3.2. Literature Study
The purpose of literature study is to derive any other explanation and information of the site area. This literature study can be done by a thorough review of books, journals, articles, and any other sources that can support the author to learn deeper knowledge when conduct the research project. This also helps the author to analyze, calculate, finds solution and recommendation for this graduation project.
3.3. Problem Identification
By doing literature study as it mentioned, problem of the area can be indicated to solve a matter. A good and complete of identification results a better output. In this research project, a problem identification is summarized by interviewing some experts and related institution and surveying the site area.
3.4. Collecting Data
3.4.1. Interview with experts
In this research project, the author has conducted some interviews with some of responsible stakeholders in Surabaya River. This interview has undergone on April 2017. The author came to Indonesia with the purpose of collecting data and deepening knowledge about Surabaya River. All result of interview will be explained in chapter 4.
3.4.2. Quality data
3.4.3. Map of water monitoring location
The map of the sampling water points is obtained from the Basin Authority in Brantas River, known as BBWS. This represents the existing points used to take the sample of the water when it comes to assess the parameters at intended laboratories. Map of sampling water points can be found on Appendix.
3.4.4. Water quality monitoring schedule
Time schedule of when BBWS does the monitoring is obtained from BBWS itself. This represents time schedule of when BBWS executes the monitoring in every location.
3.4.5. Amount of Population
Amount of population is obtained through website General Directorate of Village Administration, Ministry of Home Affairs. This data will be used to calculate wastewater discharge.
3.5. Hydrological Analysis (wastewater discharge)
In this case, due to the limitation of the data, the hydrological analysis will be the domestic wastewater analysis. The steps to calculate wastewater are stated below:
1. Determine the estimation area along the Surabaya River
2. Determine the city/district, sub-district, and village 3. Find the population which disposal the domestic
wastewater into the Surabaya River
a. For uncompeleted data, using data population in 1994 and population growth rate in Indonesia based on Central Bureau of Statistic determine population estimation in 2016
4. Find percentage of population which does not use sanitation facility in every district/city
5. Calculate how many population(s) that does not use sanitation facility
7. Calculate how much the wastewater discharge per m3 per day
8. Calculate the concentration of BOD
3.6. Monitoring System Analysis
To do the monitoring system analysis, the author will connect every point that has been obtained from Basin Authority in Brantas Basin on google earth. The measurement and the slope will be estimated from google earth too. These following steps will be done:
a. After connecting every point, see and check if there is some missing points to be monitored referenced into the theory explained in literature review;
b. By referencing the data from the water quality part, check if there is any error data such as illogical value that opposites the theory. This indicates that problem occurs in the system; whether there are some missing points to control the quality;
e. By referencing into the Netherlands system and research, adjusting if there is some equipment or tools or any solution that can be used in Indonesia to optimize the monitoring system in the future;
25
a. Projected of Surabaya Population in 2016; b. Calculate wastewater discharge;
c. Calculate Biochemical Oxygen Demand loads; II. Investigation the water quality, consists of:
a. Using the Storet Method to assess the status of the water quality in Surabaya River;
b. Classifying the status of the water quality in Surabaya River for every each point where the sampling water is taken;
III. Assessment the monitoring system in Surabaya River, consists of:
a. Assessment of the location by using google maps to connect every points where the sampling water is taken including how many industries affect the quality of the water and how much wastewater will flows into Surabaya River. This will be correlated with the wastewater discharge analysis;
b. Assessment of the time frequencies by making a list of when the Basin Authority in Brantas River does monitoring in every location and checked by Indonesia National Standard;
4.2. Wastewater discharge
Analysis of the wastewater discharge is an assumption to approach the estimation of how much BOD load that comes from the domestic wastewater will flow into Surabaya River due to lack of the data. The approach of domestic wastewater and its BOD loads can be accumulated by estimating area in 500 meters zone along the river within the total population. The total population(s) itself are obtained through website General Directorate of Village Administration, Ministry of Home Affairs. In his research, Musmidyono (1994) stated that the biggest domestic wastewater influence the quality of the are is the wastewater comes from sanitation. Therefore, in this case, we assume and calculate the wastewater comes from the population with and without sanitation facilities.
To determine the assumption of the domestic wastewater discharge, first we collect the area that flows the wastewater towards the Surabaya River. According to the Ministry of Public Works of Irrigation of East Java Province (1995), there are 3 districts including Mojokerto, Gresik and Sidoarjo, and 1 city which is Surabaya are flowing the wastewater into Surabaya River. There are at least 37 villages within various population live there (Appendix 4). The villages can be found in figure 4.1 below. To determine the population, we obtained the data from General Directorate of Village Administration, Ministry of Home Affairs3. The data that we use are the data from 2016 as the latest
published data (Appendix 4).
3
Source reffered to <
Figure 4. 1 Villages Located 500 Meters near Surabaya River
(Source: Ministry of Public Works)
However, some missing data occur when we find the population through the Indonesia Central Bureau of Statistic. To support these missing data, we estimate the population by correlating the data that we found in 1994 with growth of population in East Java based on Central Bureau of Statistic.
Table 4. 1 Population growth in East Java, Indonesia
(Source: Indonesia Central Bureau of Statistic)4
To determine the estimation of the population, we use this following basic formula:
4
Source available at
Where: r = population growth rate Pt = population at years t Po = population at early years
T = time difference (years) between years 0 and years t
This figure below is the example of determining the estimation of the population in 2016 using data in 1994.
Figure 4. 2 Increasing of Population using growth rate formula
In this case, as it mentioned on previous paragraph above, we assume that the population that flows the domestic wastewater towads the Surabaya River is the population lives in zone 500 meters from the Surabaya River. This assumption is based on previous research (Musmodiyono, 1994) in his master thesis that stated the population that lives in at least 500 meters from the river will flow the domestic wastewater into the nearest river in a particular way. We use the data in 1994 to assume the percentage of the population who lives in zone 500 meters from the Surabaya River. The data can be found in Appendix 4.
According to World Health Organzation (WHO), it is stated that the average fresh water needed per person equals 60 litre per person per day. As it mentioned in chapter 2 (equation 2.2), we assume that the people will waste 80% of freshwater needed. Therefore:
The amount of wastewater = 80% x 60 l/person/day = 48 l/person/day
2009 2010 2011 2012 2013 2014 2015 2016
0.0076 0.0076 0.0067 0.0067 0.0067 0.0067 0.0067 0.0067
3641 3669 3694 3718 3743 3768 3794 3819
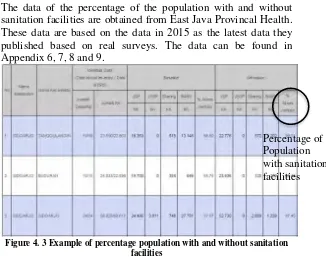
The data of the percentage of the population with and without sanitation facilities are obtained from East Java Provincal Health. These data are based on the data in 2015 as the latest data they published based on real surveys. The data can be found in Appendix 6, 7, 8 and 9.
Figure 4. 3 Example of percentage population with and without sanitation facilities
Equation 2.2 and 2.3 as it mentioned on chapter 2 sub– chapter 2.4 is used to determine the domestic wastewater discharge and the potential pollution load. In this case, BOD load is chosen to be estimated. Therefore, we use BOD = 40 gr/person/day. The equivalent ratio depends on the area that affects the river. As it stated on previous paragraph above that Surabaya River is affected by 3 districts and 1 city, therefore for the district use equivalent ratio = 0.8125 and for the city we use equivalent ratio = 1. Alpha is based on the range where the population live. Because we assume that the population that will flow the domestic wastewater is 500 meters near the Surabaya River, therefore we use alpha = 0.85.
BOD concentration can be calculated by using this formula: BOD concentration = 𝐵𝑂𝐷 𝐿𝑜𝑎𝑑
𝑄𝑤𝑎𝑠𝑡𝑒
Example of the calculation:
Area 1 = Mlirip River into Marmoyo River District /Area= Mojoketro District
Sub District = Jetis Village = Canggu village
Total Population in 2016 = 11575
Assumed that percentage population in zone 500 meters from the river is as the same as in 1994
Data in 1994:
Population = 3889, Population in zone 500 meters = 1948 Percentage (%) = (1948
3889) x 100 = 49.96%
Therefore, in 2016 total populations in zone 500 meters are 49.96% x 11575 = 5783
Based on Indonesia Health Department, population without sanitation facilities in Jetis Sub-District is 23.86% of total population.
Total population without sanitation = 23.86% x 5783 = 1380 Total population with sanitation = 5783 – 1380 = 4403
Amount of wastewater = 48 l/person/day = 0.048 m3/person/day
For population without sanitation facilities: Qwaste1 = 0.048 x 1380 = 66.23 m3/day
BOD = 40 gr/person/day
For sub-disrict, we use equivalent ratio = 0.8125 ∝ = 0.85
BOD Loads1 = 1380 x 40 x 0.8125 x 0.85
For population with sanitation facilities: Qwaste2 = 0.048 x 4403 = 211.35 m3/day
BOD = 40 gr/person/day
For sub-disrict, we use equivalent ratio = 0.8125 ∝ = 0.85 analysis can be found in Appendix 4. To sum up:
Total estimation domestic wastewater discharge = 15207.20 m3/day
Total estimation BOD loads from domestic wastewater = 7749.34 kg/day
Estimation average BOD concentration from domestic wastewater = 482.97 mg/L
Figure 4. 4 Scheme of domestic wastewater along Surabaya River
(Source: Google Earth)
Furthermore, appendix 4 also shown that when the water flows toward the downstream of the Surabaya River itself, the value of BOD concentration is inconstantly increasing. While the water has a character to purify itself, the BOD concentration should have decreased in a certain time. This indicates the closer the river into the downstream, the more industries and villages contaminate the water.
4.3. Investigation of the Quality of the Water in Surabaya River
The data for the inverstigation of quality of the water are obtained from Brantas Authority in Basin River (Balai Besar reach at least the second class in order to achieve the standard.
oxygen, biochemical oxygen demand (BOD), chemical oxygen demand (COD), phosphate, nitrate, and nitrite. 13 points of location to both take the sample of water to be assessed in laboratories and on-site analysis using the needed equipments are used by BBWS in order to monitor the quality in certain time. The locations of the monitoring are shown in table below.
Table 4. 2 Monitoring locations
(
Source: BBWS Surabaya)These sub-chapters below will show every graph for each parameter that has been conducted in monitoring locations.
4.3.1. Physical Parameter Result
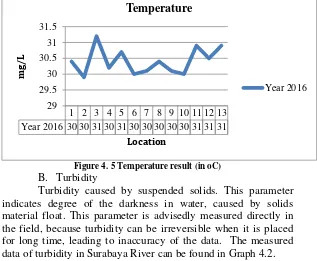
A. Temperature
Figure 4. 5 Temperature result (in oC)
B. Turbidity
Turbidity caused by suspended solids. This parameter indicates degree of the darkness in water, caused by solids material float. This parameter is advisedly measured directly in the field, because turbidity can be irreversible when it is placed for long time, leading to inaccuracy of the data. The measured data of turbidity in Surabaya River can be found in Graph 4.2.
It can be perceived that the turbidity results are fluctuating. In general, the average result is 48.37 NTU5 in which
means that it does not reached the water quality standard which as it categorized the second class. The higher level of turbidity occurs at point 3 (Perning Bridge) and point 5 (Bambe Bridge).
Figure 4. 6 Turbidity level
C. Total Suspended Solids
As it stated on chapter 2, total suspended solids is one of the factor affecting the quality of the water. At this parameter, the analysis conducted in the laboratory. The result of this parameter result will be found in Graph 4.3 below.
In general, the average result of total suspended solids in Surabaya River is 48.34 mg/L6. It means the average result still
reaches the water quality standard as the second class. However, at the first interval, the graph shows the huge result that means the suspended solids occur badly in January-March period. It may be caused by the rainy season, because rain will cause higher suspended solids as result of sediment and mud are suspended in the water.
D. Total Dissolved Solid (TDS)
Total dissolved solid is a condition where solid substance dissolved in the water body. Graph 4.4 shows the result of total dissolved solid occurs in Surabaya River.
In general, the average result of total dissolved solid occurs in Surabaya River is 337.36 mg/L. It means that the average result still reaches the water quality standard as the second class. The higher result of total dissolved solids occurs at Perning Bridge, Mojokerto District and Bambe Bridge, Gresik District.
Figure 4. 8 Total Dissolved Solids
E. Conductivity
Conductivity indicates the capability of the water to conduct the electric current. This obtains to observe electrolyte levels dissolved in the water. Conductivity is represented by unit 𝜇S/cm. Conductivity is also influenced by the temperature. Every time the temperature gets higher, the conductivity will get higher two times. Graph 4.5 will show the result conductivity occured in Surabaya River.
Generally, the average result of conductivity occurs in Surabaya River is 693.54 𝜇S/cm7. It means that in general
Surabaya River still reached the water quality standard that stated on chapter 2 as the second class. However, the graph shows the higher result at Perning Bridge and Bambe Bridge on January-March period (first interval). These points have to be considered in order to improve the quality.
Figure 4. 9 Conductivity Result
4.3.2. Chemical Parameter Result
In a monitoring system, chemical parameters can be known after laboratory analysis. These graphs below will show the result of each parameter.
A. PH
As it mentioned on chapter 2, pH indicates the quality of the water. PH is a numeric scale used to specity the acidity or basicity of an aqueous solution. Normal water has pH ranges from 6.5 to 7.5; if the value less than this range then the characteristic of water is acidic and if the value is higher than the range, the characteristic of water is alkaline. Graph 4.6 shows the pH level occurs in Surabaya River.
Figure 4. 10 PH result
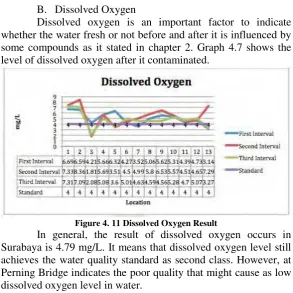
B. Dissolved Oxygen
Dissolved oxygen is an important factor to indicate whether the water fresh or not before and after it is influenced by some compounds as it stated in chapter 2. Graph 4.7 shows the level of dissolved oxygen after it contaminated.
Figure 4. 11 Dissolved Oxygen Result
In general, the result of dissolved oxygen occurs in Surabaya is 4.79 mg/L. It means that dissolved oxygen level still achieves the water quality standard as second class. However, at Perning Bridge indicates the poor quality that might cause as low dissolved oxygen level in water.
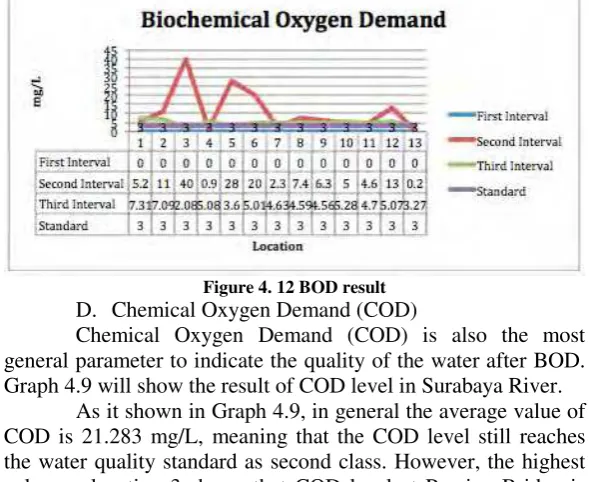
C. Biochemical Oxygen Demand (BOD)
As it stated in chapter 2, BOD is the most general parameter to indicate the quality of the water. Graph 4.8 will shows the result of BOD occurs in Surabaya River.
Figure 4. 12 BOD result
D. Chemical Oxygen Demand (COD)
Chemical Oxygen Demand (COD) is also the most general parameter to indicate the quality of the water after BOD. Graph 4.9 will show the result of COD level in Surabaya River.
Figure 4. 13 COD Result
E. Ammonia
Ammonia is a non-colored particle with strong smell and easily dissolved in water. Ammonia indicates bacterial decay of organic. Graph 4.10 will show the ammonia level in Surabaya River.
In general, the average level of ammonia in Surabaya River is 1.675 mg/L, which means that average level does not achieve the water quality standard as second class. As it is shown on the Graph, point 3 (Perning Bridge) and point 5 (Bambe Bridge) have really huge levels of ammonia.
F. Nitrate
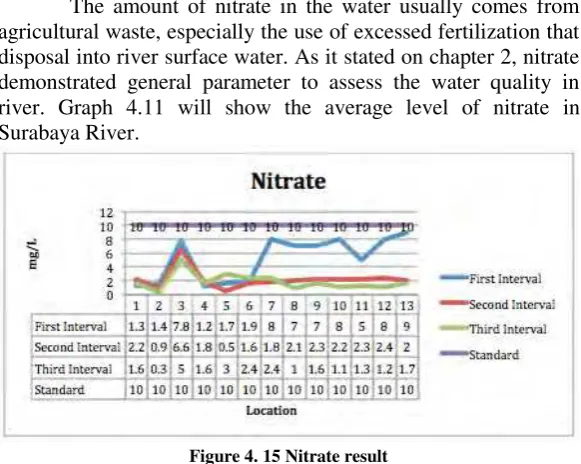
The amount of nitrate in the water usually comes from agricultural waste, especially the use of excessed fertilization that disposal into river surface water. As it stated on chapter 2, nitrate demonstrated general parameter to assess the water quality in river. Graph 4.11 will show the average level of nitrate in Surabaya River.
Figure 4. 15 Nitrate result
In general, the average level of nitrate in Surabaya River has a value of 3.09 mg/L, means that the average level still achieves the water quality standard as second class. However, point 3, 7, 10, 12, and 13 show a huge value of Nitrate and can be concluded that Perning Bridge, Joyoboyo Bridge, Tambangan Bridge, Yos Sudarso Bridge, and Petekan Bridge have a high level of Nitrate in the surface water.
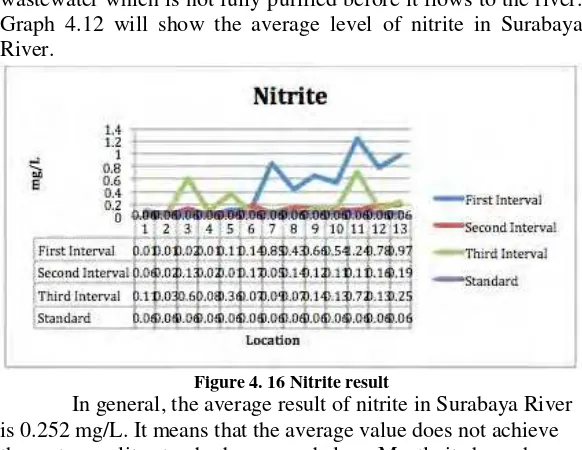
G. Nitrite
wastewater which is not fully purified before it flows to the river. Graph 4.12 will show the average level of nitrite in Surabaya River.
Figure 4. 16 Nitrite result
In general, the average result of nitrite in Surabaya River is 0.252 mg/L. It means that the average value does not achieve the water quality standard as second class. Mostly it shows huge value of nitrite, meaning that Surabaya River is heavily
contaminated. Location 3, 5, 7, 9, and 11 show a huge result of nitrate, meaning that Perning Bridge, Bambe Bridge, Joyoboyo Bridge, Nginden Intan Bridge, and Bungkuk Bridge have a really huge amount of nitrite in the surface water.
H. Phosphate
Figure 4. 17 Phosphate Result
In general, the average result of phosphate level in Surabaya River is 3.391 mg/L. It means that the average result does not reach the water quality standard as second class. Point 3 shows that Perning Bridge has a really huge amount of phosphate in the surface water.
To sum up, table 4.3 below reflects overall results of Surabaya River water quality. From 12 parameters above, 6 parameters achieve the standard meanwhile the others not. This indicates that the water is still contaminated both from the industrial and the domestic wastewater. All the data for water quality result can be found on Appendix.
Table 4. 3 Water quality result
Table 4. 4 The state of the quality of the water in Surabaya River
It can be seen that the highest score occurs at Bambe Bridge (Mojokerto District) followed by Perning Bridge (Gresik District).
where the status of Perning Bridge in Mojokerto District is heavily contaminated. This data can also be used to approach whether the new location is needed or not. This will be discussed on sub-chapter 4.4.1. Table 4.5 shows the industries excessing maximum BOD loads capacity as it is already stipulated by the government. All the data can be found on Appendix.
Table 4. 5 Industries dispose excessed wastewater
(
Source: PROPER by Ministry of Environment)Surabaya River, impact on huge deviation between Perning Bridge, Legundi Bridge, and Bambe Bridge.
Figure 4. 18 Exact location of Bambe Bridge and Perning Bridge
4.4. Assessment of the monitoring system in Surabaya
River
The data for assessment of the monitoring system is obtained from Basin Authority in Brantas River (BBWS) as the sub-directorate of Water Resources and Water Stewardship, Ministry of Public Works. BBWS is responsible for tracking Brantas River, including the Surabaya River. The exact location of existing points of water quality monitoring can be seen in Appendix.
4.4.1. Evaluation of the existing points
Figure 4. 19 Location of monitoring point in Surabaya River
Each segment can be found in Appendix. The length of each segment can be measured as it shown on table 4.6.
Table 4. 6 Monitoring Segment
Although there is no standard and principle on how to establish the precious location to determine the most efficient point to have a monitoring, some approaches will therefore be used in order to optimize the location.
also shown the industries excessing the allowable industries wastewater as it stipulated by the Governemnt. Therefore, in this part, evaluation of the existing locations are done in order to check whether or not the locations can cover and control the wastewater flows.
This approaching has resulting some villages with BOD loads among the small rivers, flowing towards Surabaya River, without any point to monitor water quality (e.g. Ngabar Village, Jetis Village, and Canggu Village, etc). On the other side, there are some industries that might not fully monitored yet by these locations (e.g. PT Keramik Diamond Industri, PT Charoen Pokphand Indonesia, etc). Table 4.7 shows all the villages and industries that have not fully monitored yet.
Table 4. 7 Villages and industries with no monitoring
4.4.2. Evalation by government’s law and Indonesia National Standard
Table 4. 8 Time and Location of Water Quality Monitoring in Brantas River
According to Indonesia National Standard on Sampling Procedures for Monitoring Water Quality in River Drainage Area (Chapter 6), determination for monitoring frequencies has to be taken into account due to various situation of water quality that changes inconstantly. For a needed preliminary study, the requirement frequencies can be divided into 4 ways:
a. Every weeks in a year
b. Every day in a row in one week; repeated once on every 13 weeks in a year
c. 4 hours a day in every week; repeated once on every 13 weeks in a year
d. Every hours in a day, repeated once on every 13 weeks in a year
If the preliminary study has not conducted yet, therefore as a general standard requirement, a river should be monitored every 2 weeks.
It can be inferred that unequal distribution of time of monitoring frequencies as it shown in Table 4.8 still does not reach the expected standard, either for the preliminary study standard requirement or the standard requirement. This data cannot fully show the general quality condition in both of Brantas River and Surabaya River.
Table 4. 9 Equipment and analysis method for each parameter
4.5. Discussion and Result
From sub-chapter 4.4 above, the main problems in Surabaya River monitoring are about the location and the time-frequency.
As mentioned in the previous chapter (Chapter 1: Introduction), the author has made some interview with Mrs. Dian A. Prayitno S.T, M.T., as the Head of Division of Water Quality in BBWS in order to strongly support the reasons why the location and time-frequency have been being the main problems these past years. To sum up, below are some explanations of main problems with the monitoring system:
b. Since 2013, the monitoring process cannot be conducted frequently due to old ages of machines. The ideal condition for monitoring the quality of the water is every day, or every hour. More intense the monitoring, more pollutant can be controlled.
c. Lack of funding from the government makes the Basin Authority in Brantas more difficult to update the equipment and tools to monitor the water quality although it follows the Indonesia Standard Method, causing a bit of inaccuracy of the data. The evidences provided in Appendix shows that at some parameters, some data are arguably at the state of an unfeasible value. For example, on January it is shown that the value of BOD is 0, which is impossible. Zero BOD means that no aquatic life will live in the water. Therefore, the feasibility of the tools and equipment should be checked and a solution is needed to optimize the monitoring system.
d. Limitation of the human sources gives an obstacle on execution. Basin Authority in Brantas has 36 points to monitor the quality of Brantas River (including 13 points In Surabaya River). As it is shown in sub-chapter 4.4.1 Table 4.4.1.1, some of the points has a really long distance between each other, which means that it needs a lot of human resources and a long time period of execution of the water quality monitoring. Limitation of the human resources can cause human error and can lead to incomplete monitor to all locations, which can also be supported by the data error in Appendix.
stagnate makes even the quality of Surabaya River decreased.
From the statements above, it can be concluded that point (a) is most likely the main reason why some villages and industries have not been monitored yet as it stated in sub-chapter 4.1. Point (b), (c), (d) are most likely the main reasons why time-frequency is very limited and the reason why there are some missing-data during the monitoring period as it shown in Appendix 3. Despite of industrial and domestic wastetwater, point (e) also the reason why the quality of the water in Surabaya River more even poor during the time.
4.6. Solution to optimize the monitoring system
4.6.1. Adding more location to monitor the quality water
Adding more location to monitor the water quality in Surabaya River can be implemented to optimize the monitoring system. This recommendation based on some approaches that have been undergone in chapter IV (data and analysis). There are two potential locations included and one of them is considered to be a critical point. These can be added as new locations in order to control the water quality more intensively in the future. These location will be explained below:
A. Critical location
Sidomulyo Village, and Tempel Village, and some industries. Point 1 and 2 can be seen on figure below. Hence, point 2 can be the start point (before the waterwater flows) and point 3 as the finish point (after the wastewater flows and contaminates) to control the water quality.
Figure 4. 20 New potential locations: point 1 and point 2
(Yellow line is Marmoyo River and Lamong River)
B. Potential location
Point 3 is considered to be a potential location. Point 1 is located in the middle of Segment II, where the length of its segment is 15 kilometers and three river flows meet. In other words, this point can also be a new location because it covers few villages that have not been monitored yet, including Bendung Village, Mojolebak Village, Kupang Village, Ngabar Village, Jetis Village, and Canggu Village as it is mentioned on previous sub-chapter (Table 4.6). Point 3 can be seen on figure below.
Figure 4. 21 New potential location: Point 3