Summary Growth and nutrition of hydroponically cultivated birch seedlings (Betula pendula Roth.) were investigated at various magnesium (Mg) availabilities. Suboptimum Mg con-ditions were created by adding Mg once per hour in exponen-tially increasing amounts at one of four relative addition rates (RMg): 0.05, 0.10, 0.15 or 0.20 day−1. Seedlings given free access to Mg were used as controls. After an acclimation period, the relative growth rate of the seedlings attained the same value as the corresponding relative rate of Mg addition. In all suboptimum Mg treatments, deficiency symptoms in the form of chloroses and necroses developed in the older leaves, both during and after the phase of growth acclimation. The severity of these symptoms was correlated with the availability of Mg. The relative growth rate of seedlings was linearly correlated with plant Mg status. The root fraction of the total biomass decreased from 22% in control plants to 8% in plants receiving the lowest rate of Mg addition. A shift in Mg avail-ability from free access to RMg = 0.05 day−1 decreased the photosynthetically active leaf area per plant weight, despite a concomitant increase in the leaf weight ratio (leaf dry weight/plant dry weight) from 0.61 to 0.75. The loss in assimi-lating leaf area was mainly a consequence of enhanced leaf mortality and formation of necroses, and to a minor extent attributable to increased carbon costs for leaf area production. A decrease in starch concentration was observed in leaves showing Mg-deficiency symptoms, whereas the starch concen-tration in healthy leaves was unaffected by Mg availability. It was concluded that shortage of carbohydrates constituted the major growth constraint, particularly for roots, under Mg-lim-iting conditions.
Keywords: Betula pendula, dry matter distribution, leaf area ratio, leaf weight ratio, net assimilation rate, nonstructural carbohydrates, nutrient uptake rate.
Introduction
Nutrient uptake and growth are time-dependent processes and the amount of nutrients taken up per unit of time is therefore strongly coupled to both the size and growth rate of the plant. Consequently, the quantitative nutrient requirement during the course of an experiment increases more or less rapidly with
time. According to Ingestad (1982), full control over nutrient uptake, plant nutrient status and growth can only be achieved if the supply of nutrients is treated dynamically, i.e., by fre-quent nutrient additions (daily or hourly) in amounts adjusted both to plant size and the desired growth rate.
The relative addition rate of nutrients has been used as a treatment variable when studying the influence of plant nutri-ent status on physiological processes. Nitrogen fixation in gray alder (Ingestad 1980), nitrogen nutrition in ectomychorrizal Scots pine seedlings (Ingestad et al. 1986), carbohydrate dy-namics in birch (McDonald et al. 1986), aluminum toxicity in forest trees (Göransson and Eldhuset 1987, 1995), leaf chem-istry and insect susceptibility in Salix (Waring et al. 1985, Larsson et al. 1986), and leaf expansion (Taylor et al. 1993) are examples of areas investigated under steady-state nutrition. One of the most striking observations made with this technique is the disappearance of deficiency symptoms after growth acclimation to suboptimal supply rates of nitrogen (Ingestad and Lund 1979) and phosphorus (Ericsson and Ingestad 1988). Improved light conditions are generally associated with an increase in the shoot/root ratio (Björkman 1981, Corré 1983), but no significant effect of photon flux density on dry matter partitioning was observed in experiments with small birch plants where steady-state nutrition was maintained (Ingestad and McDonald 1989). Similarly, elevated atmospheric CO2 concentration, which is often associated with a shift in the carbon allocation pattern toward roots (Mousseau and Enoch 1989), caused no change in the shoot/root ratio of birch seed-lings when the nutrient status of the test plants was carefully controlled (Pettersson and McDonald 1992, Pettersson et al. 1993). Plant nutrient status, and its stability during the period of investigation, thus has a strong impact on the results ob-tained and their interpretation.
The relationship between mineral nutrient status and growth of birch seedlings has been extensively studied under condi-tions where the relative addition rate of nutrients has consti-tuted the treatment variable. Nitrogen (Ingestad 1979), phosphorus (Ericsson and Ingestad 1988), potassium (Ericsson and Kähr 1993), iron (Göransson 1993) and manganese (Göransson 1994) are the elements studied so far. The present investigation is a continuation of these nutritional studies and the element in focus this time was magnesium (Mg). Our
Growth and nutrition of birch seedlings at varied relative addition
rates of magnesium
TOM ERICSSON and MONIKA KÄHR
Department of Ecology and Environmental Research, Swedish University of Agricultural Sciences, P.O. Box 7072, S-750 07 Uppsala, Sweden
Received November 25, 1993
choice of element was based on recent interest in Mg defi-ciency as one of the factors causing forest dieback in areas of central Europe and North America (Hüttl 1988, Schulze et al. 1988, Roberts et al. 1989). We hypothesized that disturbed forest growth is associated with decreased carbohydrate avail-ability in the tissues. Because Mg is essential for the activation of many enzymes, including those required for CO2 fixation (Marschner 1986), we were particularly interested in the influ-ence of plant Mg status on the carbohydrate concentration of tissues and on dry matter partitioning among root, stem and leaves.
Material and methods
Growth conditions
The experiments were carried out in growth chambers with a continuous photon flux density of 260 µmol m−2 s−1 (400 to 700 nm, Osram HQI R 250W/D). Both the air and root tem-peratures were 20 ± 0.5 °C and the vapor pressure deficit in the air, VPD, was approximately 0.6 MPa.
Seedling culture
Birch seedlings (Betula pendula Roth.) were used as test ma-terial. Seeds were germinated on wet filter paper in petri dishes under low light intensity, 50 µmol m−2 s−1, for about 10 days. Seedlings at the same developmental stage were then planted in growth units where the roots were continuously sprayed with a circulating culture solution with a volume of 5 dm3. A detailed description of the growth unit has been presented elsewhere (Ingestad and Lund 1986). The culture solution contained all essential mineral elements in the proportions given by Ingestad and Lund (1986) (N = 100, K = 65, P = 13, Ca = 7, Mg = 8.5, S = 9, Fe = 0.7, Mn = 0.4, B = 0.2, Zn = 0.06, Cu = 0.03, Cl = 0.03, Mo = 0.007, Na = 0.003). Non-growth-limiting conditions were created by keeping the conductivity of the culture solution between 250 and 350 µS cm−1, which is equivalent to a nitrogen concentration of 3--4 mM. The pH of the culture solution was maintained at 4.8--5.2. A computer was used to control the hourly conductivity and pH titrations. After pregrowth for 14 days under the culture conditions de-scribed, 60 uniform seedlings with a fresh weight (FW) of 40--50 mg per plant, were selected in groups of four for use in each of the different treatments.
Treatments
Four relative addition rates of magnesium (RMg = 0.05, 0.10, 0.15 and 0.20 day−1) were used to induce a range of subop-timum plant Mg concentrations. These treatments corre-sponded to an approximate Mg restriction of 80 to 10%, respectively, of the potential Mg requirement under the chosen climatic conditions. The concentration of Mg in the seedlings at the start of each treatment, 0.51 mg gFW−1, was used to calculate the hourly Mg additions:
Mgt=Mgs(eRMg/24−1)(eRMgt/24),
where Mgs is the initial amount of magnesium in the seedlings, and Mgt is the amount of magnesium added, together with other essential nutrient elements, that is sufficient for one hour of uptake at any time t hours from the beginning of the experi-ment at the desired RMg (Ingestad and Lund 1986). Conditions that were not growth limiting with respect to availability of other essential mineral elements were ensured by keeping the conductivity of the culture solution above 70 µS cm−1. This was achieved by automatic conductivity titrations with a Mg-free stock solution. The pH of the culture solution during the experiments varied between 4.2 and 5.2.
A fifth treatment provided non-growth-limiting Mg condi-tions. All essential elements were supplied in the proportions found optimal for birch (Ingestad and Lund 1986) and in free access (FA). The magnesium concentration was kept in the range of 0.1 to 0.2 mM by maintaining the conductivity of the culture solution between 100 and 200 µS cm−1. The pH of the solution varied between 4.2 and 5.2. All experiments were run twice.
Harvesting
After an initial acclimation period of varying length, depend-ing on the extent of Mg limitation, all plant groups in the 0.05, 0.10 and 0.15 day−1 treatments were reweighed, whereas plants in the more short-term experiments, 0.20 day−1 and FA, were left undisturbed. Groups of seedlings were then harvested on four occasions during the exponential period of growth, which lasted from 24 (FA) to 69 days (RMg = 0.05 day−1). Fresh and dry weights (48 h at 70 °C) of roots, stems and leaves as well as leaf area (LI 3310, Li-Cor Inc., Lincoln, NE) were determined. The leaves were divided into three categories: 1 = healthy, 2 = necroses covering less than 75%, and 3 = necroses covering more than 75% of the leaf surface.
Analyses
Samples for macronutrient analyses were prepared by diges-tion in a soludiges-tion of 10 ml concentrated HNO3 and 1 ml HClO4. One ml of 2 M HNO3 was added to the digest and the solution was diluted with water to 35 ml. Nitrogen was analyzed with an elemental analyzer (Elemental Analyzer NA 1500, Rodano, Italy). The macronutrients P, K, Ca, Mg and S were analyzed by inductively coupled plasma spectrometry (Jobin Yvon JY-70, Longjumeau, France).
Nonstructural carbohydrates were analyzed by the method described by Steen and Larsson (1986) based on a two-step extraction procedure. Glucose, fructose, sucrose, fructan and soluble starch were determined in the first extract and residual starch in the second extract.
Calculations
Growth was determined as relative growth rate, RG (day−1), based on weights, W, on the four harvest dates, t, by fitting an exponential curve:
where W0 is the weight of the seedlings at the beginning of the treatments (RMg = 0.20 day−1 and FA) or after the acclimation period (RMg = 0.05, 0.10, 0.15 day−1).
The net uptake rate of nutrients per root growth rate, dn/dWr (mmol g−1 root growth), was calculated from:
dn dWr=
n W
W Wr=
C W 103 MWr ,
where n is the nutrient amount in the plant, C its tissue concen-tration, M the molecular weight, and W and Wr the dry weights of the seedling and root system, respectively (cf. Ingestad and Ågren 1988).
The net assimilation rate, NAR (kg plant dry weight (DW) m−2 day−1), was calculated from:
NAR = RG LAR ,
where the leaf area ratio, LAR (m2 kgDW−1 plant), is the product of specific leaf area, SLA (m2 kg
DW−1 leaf), and leaf weight ratio, LWR (leafDW plantDW−1):
LAR = SLA × LWR.
Statistical analyses
Statistical analyses were carried out by one-way ANOVA (Statgraphics Inc., Rockville, Maryland, USA). The pair-wise comparisons were made by the Least Significant Difference method. The confidence level was 0.05.
Results
Plant appearance
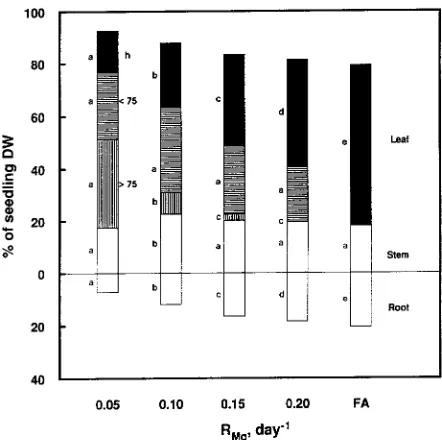
Deficiency symptoms, in the form of chloroses and necroses, developed in the older leaves at growth-limiting supply rates of Mg, both during and after the phase of growth acclimation. The severity of these symptoms was correlated with the extent of Mg limitation (Figure 1). Pronounced increases in leaf mortality rate and leaf fraction showing necroses on more than 75% of the leaf surface were obtained when RMg was reduced from free access to 0.05 day−1 (Figure 1). This change occurred at the expense of healthy leaves, the proportion of which decreased from 100 to 20%. At the lowest rate of Mg addition, only the uppermost three to four leaves remained undamaged, although they exhibited slight interveinal chlorosis. The leaf fraction showing damage to less than 75% of the leaf surface constituted roughly 30% of the leaf biomass within the whole range of suboptimum Mg availabilities studied. Both the size of newly formed leaves and internode lengths were reduced at RMg = 0.15 day−1 and lower. The branching pattern of the root system was more or less unaffected by the supply rate of Mg. The overall vigor of the roots, including characteristics such as length and diameter, was reduced by a growth-limiting avail-ability of Mg.
Plant growth
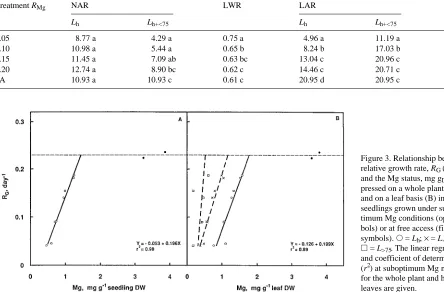
The RG of the seedlings was similar to that of the treatment variable, RMg, after an acclimation period of 14--29 days, depending on the extent of Mg limitation (Figure 2). The regression coefficients, r2, for the curve fitting of RMg with RG were generally > 0.99. An RG of 0.23 day−1 was reached under nonlimiting Mg conditions. The calculated net assimilation rate, NAR, based on the area of leaves showing necroses on less than 75% of their surface, decreased from 10.9 to 4.3 × 10⁻³ kg m−2 day−1 when the Mg supply was restricted from free access to 0.05 day−1 (Table 1). The decline in NAR was less pronounced, 10.9 to 8.8 × 10⁻³ kg m−2 day−1, when only the area of healthy leaves was considered to be photosyntheti-cally active.
Dry matter partitioning
The proportional allocation of dry matter to roots decreased in response to growth-limiting availability of Mg (Figure 1). Roots made up about 8% of the standing biomass at RMg = 0.05 day−1 compared with 22% at free access. Concomitantly, the fraction of leaves of the total biomass increased from 61 to 75% on a dry weight basis with increased Mg limitation (Figure 1, Table 1). The leaf area per plant dry weight, LAR, however, decreased from 21.0 to 11.2 m2 kg−1 (healthy + leaves damaged on less than 75% of the leaf surface) or from 21.0 to 5.0 m2 kg−1 (healthy leaves) when Mg availability was reduced from free access to 0.05 day−1 (Table 1). Leaf area production
per unit of carbon used for leaf growth, SLA (m2 kg−1 leaf), was not affected by the supply rate of Mg (Table 1).
Plant nutrient status
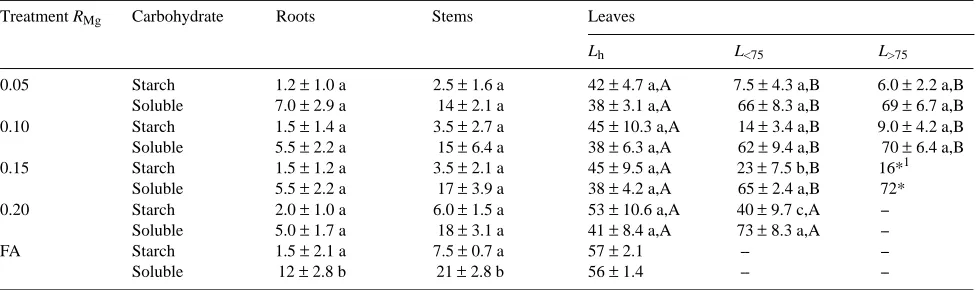
Seedling RG was positively and linearly correlated with Mg concentration of both the whole plant and the leaves (Figures 3a and 3b). The lowest tissue Mg concentration on a whole-plant basis that supported maximum growth rate (the intersec-tion between the lines in Figure 3a) was 1.4 mg gDW−1. The corresponding value for undamaged leaves was 1.8 mg gDW−1 (Figure 3b). About three times more Mg than required for structural growth was taken up under nonlimiting Mg condi-tions (Figure 3a). At growth-limiting supply rates of Mg, a strong gradient in foliar Mg concentration developed within the shoot. The youngest leaves, without Mg-deficiency symp-toms or with only weak sympsymp-toms, contained two to three times more Mg within the range of suboptimum Mg availabili-ties studied than the older damaged leaves toward the base of the shoot (Table 2). Visible deficiency symptoms in the form of necroses were generally associated with foliar Mg concen-trations below 1 mg gDW−1 at RMg = 0.20 day−1 and below 0.5 mg gDW−1 at RMg = 0.05 day−1 (Table 2). The difference in Mg concentration between leaves with damage on more than 75% of the surface and leaves with damage on less than 75% of the surface was less pronounced.
Figure 2. Influence of the relative Mg addition rate, RMg (day−1), on the relative growth rate, RG (day−1), of birch seedlings grown in culture solution. The linear regression and coefficient of determina-tion, r2, are given. Filled symbols denote RG obtained under non-limiting Mg-conditions; these data points are not included in the linear regression.
Table 1. Mean values of net assimilation rate, NAR (kg m−2 day−1× 10⁻³), leaf weight ratio, LWR (kg kg−1), leaf area ratio, LAR (m2 kg−1), and specific leaf area, SLA (m2 kg−1), of birch seedlings grown at various relative addition rates of Mg, RMg (day−1), and at free access, FA. The projected leaf area of healthy leaves only, Lh, was used to calculate NAR, LAR and SLA. The parameters NAR and LAR were also calculated on the basis of the leaf area of healthy leaves + leaves with necroses covering less than 75% of the leaf surface, Lh+<75. Means followed by the same letter within each column are not significantly different (LSD, 0.05 level, n = 5).
Treatment RMg NAR LWR LAR SLA
Lh Lh+<75 Lh Lh+<75
0.05 8.77 a 4.29 a 0.75 a 4.96 a 11.19 a 31.01 a
0.10 10.98 a 5.44 a 0.65 b 8.24 b 17.03 b 33.31 a
0.15 11.45 a 7.09 ab 0.63 bc 13.04 c 20.96 c 37.07 a
0.20 12.74 a 8.90 bc 0.62 c 14.46 c 20.71 c 35.55 a
FA 10.93 a 10.93 c 0.61 c 20.95 d 20.95 c 34.08 a
Figure 3. Relationship between the relative growth rate, RG (day−1), and the Mg status, mg gDW−1, ex-pressed on a whole plant basis (A) and on a leaf basis (B) in birch seedlings grown under subop-timum Mg conditions (open sym-bols) or at free access (filled symbols). s = Lh; × = L<75; and h = L>75. The linear regression
The concentrations of leaf N, P, K, Ca and S were not markedly affected by Mg availability (Table 2), although the Ca concentration in stems and roots increased significantly in parallel with reduced Mg availability.
Root growth and nutrient uptake
The amount of Mg taken up per gram root growth, dMg/dWr, decreased from 0.7 to 0.3 mmol when the availability of Mg was reduced from free access to RMg = 0.05 day−1 (Table 3), whereas three times more root biomass, 167 g, was produced per gram of Mg taken up at the lowest rate of Mg supply compared with nonlimiting Mg conditions. The uptake of other macronutrients per gram of new root growth, particularly of Ca, showed the opposite trend and increased two to four times under the most restricted Mg supply compared with nonlimiting nutrient conditions (Table 3).
Plant carbohydrate status
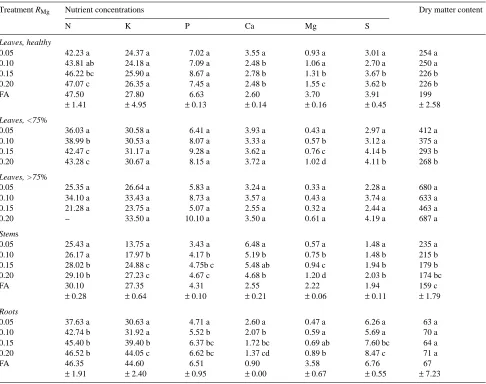
Magnesium limitation had no significant effect on starch con-centrations in healthy leaves (Table 4); however, there was a significant decrease in starch concentration in all leaves show-ing Mg-deficiency symptoms. Leaves with damage to more than 75% of the leaf surface contained 6--16 mg starch gDW−1 leaf, whereas undamaged leaves contained 42--57 mg starch gDW−1 leaf (Table 4). The decrease in starch concentration in response to reduced Mg availability was more evident when expressed as a mean of all leaves: 14 ± 0.1 mg gDW−1 at RMg = 0.05 day−1 compared with 57 ± 2.1 mg gDW−1 at FA. The concentration of soluble carbohydrates (glucose, fructose, su-crose and fructan), particularly in healthy leaves, showed a trend similar to that for starch, and decreased from 56 mg gDW−1 at FA to 38 mg gDW−1 at RMg = 0.05 day−1 (Table 4). The availability of Mg in the culture solution had little effect on the concentrations of soluble carbohydrates in leaves with damage to < 75% or > 75% of the leaf surface (Table 4). Stems and Table 2. Macronutrient concentrations, mg gDW−1, and dry matter content, mg g−1, in leaves (healthy, necroses on less than 75% of the leaf surface, and necroses on more than 75% of the leaf surface), stem and roots of birch seedlings supplied with Mg at different relative rates, RMg (day−1), or at free access, FA. The other essential mineral elements were supplied in nonlimiting amounts. Means followed by the same letter within each column and organ are not significantly different (LSD, 0.05 level, n = 5 except in treatment FA where n = 2, ± = SD).
Treatment RMg Nutrient concentrations Dry matter content
N K P Ca Mg S
Leaves, healthy
0.05 42.23 a 24.37 a 7.02 a 3.55 a 0.93 a 3.01 a 254 a
0.10 43.81 ab 24.18 a 7.09 a 2.48 b 1.06 a 2.70 a 250 a
0.15 46.22 bc 25.90 a 8.67 a 2.78 b 1.31 b 3.67 b 226 b
0.20 47.07 c 26.35 a 7.45 a 2.48 b 1.55 c 3.62 b 226 b
FA 47.50 27.80 6.63 2.60 3.70 3.91 199
± 1.41 ± 4.95 ± 0.13 ± 0.14 ± 0.16 ± 0.45 ± 2.58
Leaves, <75%
0.05 36.03 a 30.58 a 6.41 a 3.93 a 0.43 a 2.97 a 412 a
0.10 38.99 b 30.53 a 8.07 a 3.33 a 0.57 b 3.12 a 375 a
0.15 42.47 c 31.17 a 9.28 a 3.62 a 0.76 c 4.14 b 293 b
0.20 43.28 c 30.67 a 8.15 a 3.72 a 1.02 d 4.11 b 268 b
Leaves, >75%
0.05 25.35 a 26.64 a 5.83 a 3.24 a 0.33 a 2.28 a 680 a
0.10 34.10 a 33.43 a 8.73 a 3.57 a 0.43 a 3.74 a 633 a
0.15 21.28 a 23.75 a 5.07 a 2.55 a 0.32 a 2.44 a 463 a
0.20 -- 33.50 a 10.10 a 3.50 a 0.61 a 4.19 a 687 a
Stems
0.05 25.43 a 13.75 a 3.43 a 6.48 a 0.57 a 1.48 a 235 a
0.10 26.17 a 17.97 b 4.17 b 5.19 b 0.75 b 1.48 b 215 b
0.15 28.02 b 24.88 c 4.75b c 5.48 ab 0.94 c 1.94 b 179 b
0.20 29.10 b 27.23 c 4.67 c 4.68 b 1.20 d 2.03 b 174 bc
FA 30.10 27.35 4.31 2.55 2.22 1.94 159 c
± 0.28 ± 0.64 ± 0.10 ± 0.21 ± 0.06 ± 0.11 ± 1.79
Roots
0.05 37.63 a 30.63 a 4.71 a 2.60 a 0.47 a 6.26 a 63 a
0.10 42.74 b 31.92 a 5.52 b 2.07 b 0.59 a 5.69 a 70 a
0.15 45.40 b 39.40 b 6.37 bc 1.72 bc 0.69 ab 7.60 bc 64 a
0.20 46.52 b 44.05 c 6.62 bc 1.37 cd 0.89 b 8.47 c 71 a
FA 46.35 44.60 6.51 0.90 3.58 6.76 67
roots generally contained less than 8 and 21 mg gDW−1 of starch and soluble carbohydrates, respectively, over the range of Mg availabilities studied (Table 4).
Discussion
Chlorosis, and particularly necroses, developed in the older leaves of the Mg-limited birch seedlings as a consequence of internal Mg cycling. These symptoms appeared once the leaf Mg concentration had decreased to about half the value of healthy leaves. This threshold value was higher under mild Mg restriction, ≈ 1 mg gDW−1 leaf, than under strongly growth-lim-iting Mg conditions, ≈ 0.5 mg gDW−1 at RMg = 0.05 day−1 (Table 2). The difference in threshold values may be associated with differences in the pool size of metabolically active and inactive Mg. However, the difficulties associated with con-ducting an objective leaf sampling among the chosen leaf categories offer a more likely explanation for the observed discrepancy. The small difference in leaf Mg concentration between the two categories of damaged leaves suggests that most of the Mg available for resorption had already been withdrawn before the deficiency symptoms became apparent. Efficient retranslocation of limiting elements from old to young foliage ensures the maintenance of physiological proc-esses. About 80% of leaf biomass showed deficiency
symp-toms under severe Mg limitation (RMg = 0.05 day−1), whereas 30% of the leaf biomass showed deficiency symptoms when the growth rate of the seedlings was only slightly suppressed by Mg supply (RMg = 0.20 day−1) (Figure 1).
Luxury consumption of N was evident under Mg-limiting growth conditions (Table 2). This phenomenon has also been observed when Fe (Göransson 1993), Mn (Göransson 1994) or Zn (Göransson, personal communication) constituted the growth-limiting element. Nitrogen taken up in excess of growth requirements is generally stored in the leaves in the form of amino acids (Näsholm and McDonald 1990, Näsholm 1991) and acts as a sink for carbohydrates. Because the con-version of N to amino acids generally takes place in the roots in trees, luxury uptake of N under growth-limiting Mg condi-tions may contribute to further decreases in the amounts of carbohydrates available for root growth. We observed an an-tagonistic effect of Mg on Ca uptake. About three times more Ca was found in stems and roots at the lowest rate of Mg supply than at FA (Table 2). Conversely, the presence of a high Ca concentration in the root medium is likely to exacerbate the effects of Mg deficiency.
In contrast to previous reports for trees (e.g., Matzner et al. 1986) and herbaceous plants (e.g., Bottrill et al. 1970, Fischer and Bussler 1988), starch did not accumulate in leaves at suboptimum Mg tissue concentrations (Table 4). There was a Table 3. Net uptake rates of macronutrients, dn/dWr (mmol g−1 root growth ± SD), in birch seedlings at different relative supply rates of Mg, RMg (day−1), and at free access (FA); n = 2.
Treatment RMg Net uptake rates
N K P Ca Mg S
0.05 34.1 ± 1.85 10.2 ± 0.34 2.8 ± 0.31 1.5 ± 0.20 0.3 ± 0.04 1.3 ± 0.26 0.10 22.1 ± 0.67 5.7 ± 0.15 1.8 ± 0.10 0.7 ± 0.13 0.2 ± 0.01 0.8 ± 0.13 0.15 17.9 ± 2.83 4.6 ± 0.45 1.5 ± 0.55 0.5 ± 0.17 0.2 ± 0.03 0.8 ± 0.17 0.20 16.4 ± 0.55 4.2 ± 0.17 1.2 ± 0.06 0.4 ± 0.004 0.3 ± 0.002 0.7 ± 0.002 FA 15.7 ± 0.69 3.8 ± 0.17 1.0 ± 0.06 0.3 ± 0.02 0.7 ± 0.05 0.6 ± 0.03
Table 4. Concentrations (mg gDW−1± SD) of starch and soluble carbohydrates (fructose, glucose, sucrose and fructan) in roots, stems and leaves (healthy = Lh, necroses on less than 75% of the surface area = L<75, necroses on more than 75% of the surface area = L>75), of birch seedlings supplied with Mg at different relative rates, RMg (day−1), and at free access, FA. Means followed by the same letter within each column (lower case) and between leaf categories within treatments (upper case) are not significantly different (LSD, 0.05 level, n = 6 except in treatments RMg = 0.10 day−1 for L>75, RMg = 0.15 day−1 for L>75, and FA where n = 3, 1 and 2, respectively).
Treatment RMg Carbohydrate Roots Stems Leaves
Lh L<75 L>75
0.05 Starch 1.2 ± 1.0 a 2.5 ± 1.6 a 42 ± 4.7 a,A 7.5 ± 4.3 a,B 6.0 ± 2.2 a,B Soluble 7.0 ± 2.9 a 14 ± 2.1 a 38 ± 3.1 a,A 66 ± 8.3 a,B 69 ± 6.7 a,B 0.10 Starch 1.5 ± 1.4 a 3.5 ± 2.7 a 45 ± 10.3 a,A 14 ± 3.4 a,B 9.0 ± 4.2 a,B Soluble 5.5 ± 2.2 a 15 ± 6.4 a 38 ± 6.3 a,A 62 ± 9.4 a,B 70 ± 6.4 a,B 0.15 Starch 1.5 ± 1.2 a 3.5 ± 2.1 a 45 ± 9.5 a,A 23 ± 7.5 b,B 16*1 Soluble 5.5 ± 2.2 a 17 ± 3.9 a 38 ± 4.2 a,A 65 ± 2.4 a,B 72* 0.20 Starch 2.0 ± 1.0 a 6.0 ± 1.5 a 53 ± 10.6 a,A 40 ± 9.7 c,A -- Soluble 5.0 ± 1.7 a 18 ± 3.1 a 41 ± 8.4 a,A 73 ± 8.3 a,A -- FA Starch 1.5 ± 2.1 a 7.5 ± 0.7 a 57 ± 2.1 -- -- Soluble 12 ± 2.8 b 21 ± 2.8 b 56 ± 1.4 -- --
significant decrease in starch concentration in all leaves show-ing Mg-deficiency symptoms that was independent of the extent of Mg restriction. We also observed a small decrease in the starch concentration of healthy leaves when Mg availabil-ity was reduced from free access to RMg = 0.05 day−1. We conclude that the main constraint associated with a shortage of Mg is a reduction in net carbon gain rather than impaired assimilate transport in the phloem as suggested by Fink (1989), because, although not observed in our study, a shortage of Mg has a strong and negative impact on the rate of carbon fixation (Beyschlag et al. 1987, Zimmermann et al. 1988). A possible explanation of our results might be that the carbohydrate analyses were carried out during the phase of steady-state nutrition when both the growth rate and the tissue content of Mg had acclimated to the Mg supply. In most studies, Mg deficiency was induced by omitting Mg from the growth sub-strate and, as a result, the internal Mg concentration was continuously decreasing, i.e., the plants never reached the phase of steady-state growth.
The importance of the assimilate available for root growth has already been pointed out by Pearsall (1923) and White (1937). The balance between carbohydrates and nitrogen in tissues plays a key role in determining the magnitude of above-and belowground growth according to Brouwer (1962). When there is a decrease in carbohydrate supply, the shoot retains a larger fraction of assimilates than the root, thus increasing the shoot/root ratio; the opposite occurs when mineral nutrients or water supplies are decreased (cf. Thornley 1972, Dewar 1993). Thus, Mg deficiency, which negatively affects carbon fixation, has a negative impact on root growth. Under severe Mg limi-tation, the root made up only about 8% of the total biomass (DW), whereas almost three times as much biomass was allo-cated to the root under non-growth-limiting Mg conditions (Figure 1). Similar growth behavior in response to Mg shortage is generally (e.g., Shear 1980, Marschner 1986, Matzner et al. 1986), but not always (e.g., Will 1961), observed.
If the allocation of biomass to roots is decreased in response to a mineral shortage, the soil volume exploited by the plant will also decrease. In turn, this will decrease the uptake of the limiting element still further. This negative feedback could lead to plant decline, unless the uptake per unit root growth, dn/dWr, required to reach a new steady state decreases to a larger extent than the flux of the limiting element. This condi-tion is obtained if the limiting element exerts its growth regu-latory role over a large concentration range in the tissue. We found that the uptake of Mg per gram of root growth necessary to achieve a new equilibrium between uptake and growth was slightly higher after a fourfold reduction in Mg availability (Table 5). It has previously been shown that for K (Ericsson and Kähr 1993), Fe (Göransson 1993) and Mn (Göransson 1994), dn/dWr decreases to a lesser extent than the flux of these elements (Table 5). For N (Ingestad 1979) and P (Ericsson and Ingestad 1988), dn/dWr decreases almost seven to nine times, respectively, in response to a fourfold reduction in their avail-abilities. Although, in the present study the uptake of Mg per gram of root growth did not match the decrease in Mg flux given to the plants, steady-state conditions of Mg uptake and
growth were established even in treatments where Mg was severely limiting, probably because the spray technique brings nutrients in direct contact with actively nutrient-absorbing root surfaces. In a solid substrate, however, the size of the root system in relation to shoot and root growth plays a dominant role in nutrient acquisition (Clarkson 1985).
Shortage of Mg was expected to bring about a decrease in the net assimilation rate, NAR, of the same magnitude as reported for K (Ericsson and Kähr 1993), because both ele-ments are essential for carbon fixation. However, we observed only a small decrease in NAR in response to reduced Mg availability (Table 1). In this respect, Mg shows similarities with N and P (McDonald et al. 1991), although N and P more directly interfere with the activity of the sinks (the meristems) than of the source (carbon fixation). If the functional compo-nent of RG, NAR, is only slightly affected by a reduced nutrient flux then the structural development of the plant must also change (cf. Beadle 1985). This was the case under growth-lim-iting supply rates of Mg, but in contrast to N and P, more of the assimilates available for growth were utilized in the shoot than in the root (Figure 1). An increased allocation of biomass to leaves generally implies an increase in the total leaf area per plant weight, LAR, as has been shown for K under similar cultural conditions (Ericsson and Kähr 1993). For Mg, how-ever, the functioning leaf area was considerably decreased as a result of the formation of necroses and reduced leaf longevity (Table 1). When N or P limits growth, LAR is decreased mainly because of root growth and increased costs for leaf production (McDonald et al. 1991). We conclude that Mg exerts its over-all growth regulatory role in birch seedlings in a similar way to N and P, namely by affecting photosyntheti-cally active leaf area. The uppermost and healthy leaves re-mained in a productive stage, regardless of the extent of Mg restriction. The major difference between treatment extremes was the proportion of leaves in the healthy category.
We assume that the establishment and maintenance of my-corrhizae are endangered when root growth is suppressed as a result of decreased export of assimilates from the shoot (Meyer et al. 1988), because the fungal component in this symbiosis is totally dependent on host-derived carbon. Decreased fungal
Table 5. Net uptake rates of N, K, P, Mg, Fe and Mn per unit root growth, dn/dWr (mmol gDW−1), in hydroponically grown birch seed-lings during the phase of steady-state nutrition and the relative de-crease in net uptake rates in response to a fourfold dede-crease in the availability of these mineral elements (RA = relative addition rate, day−1). Data for N from Ingestad (1979), K from Ericsson and Kähr (1993), P from Ericsson and Ingestad (1988), Mg from this study, Fe from Göransson (1993a), and Mn from Göransson (1994). Mean values are based on two to eight observations.
growth will, in turn, negatively affect the uptake of nutrients still further. Our data suggest why Mg shortage under field conditions is a greater threat to the health and productivity of plants than a shortage of elements such as N and P.
Acknowledgments
We thank Annette Hovberg and Anette Carlsson for growing the test plants, and the Analytical Laboratory of the Department of Ecology and Environmental Research for the mineral analyses. We are also grateful to Anita Flower-Ellis who helped us with carbohydrate deter-minations. Anders Göransson, Roger Pettersson, Lars Rytter and Fre-drik Wikström offered valuable suggestions on the manuscript. The investigation was financially supported by grants from the National Council for Forestry and Agricultural Research in Sweden.
References
Beadle, C.L. 1985. Plant growth analysis. In Techniques and Biopro-ductivity and Photosynthesis. Eds. J. Coombs, D.O. Hall, S.P. Long and J.M.O. Scurlock. Pergamon, Oxford, pp 21--25.
Beyschlag, W., M. Wedler, O.L. Lange and U. Heber. 1987. Einfluß einer Magnesiumdüngung auf Photosynthese und Transpiration von Fichten an einem Magnesium-Mangelstandort im Fichtelge-birge. Allg. Forstztg. 43:738--741.
Björkman, O. 1981. Responses to different quantum flux densities. In Encyclopedia of Plant Physiology. New Series, Vol 12A. Eds. O.L. Lange, P.S. Nobel, C.B. Osmond and H. Ziegler. Springer Verlag, Berlin, pp 57--107.
Bottrill, D.E., J.V. Possingham and P.E. Kriedmann. 1970. The effect of nutrient deficiencies on photosynthesis and respiration in spin-ach. Plant Soil 32:424--438.
Brouwer, R. 1962. Nutritive influences on the distribution of dry matter in the plant. Neth. J. Agric. Sci. 10:399--408.
Clarkson, D.T. 1985. Factors affecting mineral nutrient acquisition by plants. Annu. Rev. Plant Physiol. 36:7--115.
Corré, W.J. 1983. Growth and morphogenesis of sun and shade plants. I. The influence of light intensity. Acta Bot. Neerl. 32:49--62. Dewar, R.C. 1993. A root--shoot partitioning model based on
carbon--nitrogen--water interactions and Münch phloem flow. Funct. Ecol. 7:356--368.
Ericsson, T. and T. Ingestad. 1988. Nutrition and growth of birch seedlings at varied relative phosphorus addition rates. Physiol. Plant. 72:227--235.
Ericsson, T. and M. Kähr. 1993. Growth and nutrition of birch seed-lings in relation to potassium supply rate. Trees 7:78--85. Fink, S. 1989. Pathological anatomy of conifer needles subjected to
gaseous air pollutants or mineral deficiencies. Aquilo Ser. Bot. 27:1--6.
Fischer, E.S. and W. Bussler. 1988. Effects of magnesium deficiency on carbohydrates in Phaseolus vulgaris. Z. Pflanzenernähr. Bodenk. 151:295--298.
Göransson, A. 1993. Growth and nutrition of small Betula pendula plants at different relative addition rates of iron. Trees 8:31--38. Göransson, A. 1994. Growth and nutrition of small Betula pendula
plants at different relative addition rates of manganese. Tree Physiol. 14:375--388.
Göransson, A. and T. Eldhuset. 1987. Effects of aluminum on growth and nutrient uptake of Betula pendula seedlings. Physiol. Plant. 69:193--199.
Göransson, A. and T. Eldhuset. 1991. Effects of aluminum on growth and nutrient uptake of small Picea abies and Pinus sylvestris plants. Trees 5:136--142.
Göransson, A. and T. Eldhuset. 1995. Effects of aluminum on calcium, magnesium and nitrogen nutrition in small Betula pendula plants growing at high and low nutrient supply rates. WASP. In press. Hüttle, R.F. 1988. ‘‘New type’’ forest declines and
restabilization/revi-talization strategies: a programmatic focus. WASP. 41:95--111. Ingestad, T. 1979. Nitrogen stress in birch seedlings. II. N, K, P, Ca,
and Mg nutrition. Physiol. Plant. 45:149--157.
Ingestad, T. 1980. Growth, nutrition and nitrogen fixation in gray alder at varied rates of nitrogen addition. Physiol. Plant. 50:353--364. Ingestad, T. 1982. Relative addition rate and external concentration:
driving variables used in plant nutrition research. Plant Cell Envi-ron. 5:443--453.
Ingestad, T. and G. Ågren. 1988. Nutrient uptake and allocation at steady-state nutrition. Physiol. Plant. 72:450--459.
Ingestad, T. and A.-B. Lund. 1979. Nitrogen stress in birch seedlings. I. Growth technique and growth. Physiol. Plant. 45:137--148. Ingestad, T. and A.-B. Lund. 1986. Theory and techniques for steady
state mineral nutrition and growth of plants. Scand. J. For. Res. 1:439--453.
Ingestad, T. and A.J.S. McDonald. 1989. Interaction between nitrogen and photon flux density in birch seedlings at steady-state nutrition. Physiol. Plant. 77:1--11.
Ingestad, T., A.S. Arveby and M. Kähr. 1986. The influence of ectomy-corrhiza on nitrogen nutrition and growth of Pinus sylvestris seed-lings. Physiol. Plant. 68:575--582.
Larsson, S., A. Wirén, L. Lundgren and T. Ericsson. 1986. Effects of light and nutrient stress on leaf phenolic chemistry in Salix
dasy-clados and susceptibility to Galerucella lineola (Coleoptera).
Oikos 47:205--210.
Marschner, H. 1986. Mineral nutrition of higher plants. Academic Press, London, pp 235--243.
Matzner, E., D. Murach and H. Fortmann. 1986. Soil acidity and its relationship to root growth in declining forest stands in Germany. WASP. 31:273--282.
McDonald, A.J.S., A. Ericsson and T. Lohammar. 1986. Dependence of starch storage on nutrient availability and photon flux density in small birch (Betula pendula Roth.). Plant Cell Environ. 9:433--438. McDonald, A.J.S., T. Ericsson and T. Ingestad. 1991. Growth and nutrition of tree seedlings. In Physiology of Trees. Ed. A.S. Raghavendra. John Wiley and Sons Inc., New York, pp 199--220. Meyer, J., B.U. Schneider, K. Werk, R. Oren and E.-D. Schulze. 1988.
Performance of two Picea abies (L.) Karst. stands at different stages of decline. V. Root tip and ectomycorrhiza development and their relations to above ground and soil nutrients. Oecologia 77:7--13.
Mousseau, M. and H.Z. Enoch. 1989. Carbon dioxide enrichment reduces shoot growth in sweet chestnut seedlings (Castanea sativa Mill.). Plant Cell Environ. 12:927--934.
Näsholm, T. 1991. Aspects of nitrogen metabolism in Scots pine, Norway spruce and birch as influenced by the availability of nitro-gen in the pedosphere and atmosphere. Ph.D. Diss. Swed. Univ. Agric. Sci., Dept. For. Genet. and Plant Physiol., Umeå, Sweden, 39 p.
Näsholm, T. and A.J.S. McDonald. 1990. Dependence of amino acid composition upon nitrogen availability in birch (Betula pendula). Physiol. Plant. 80:507--514.
Pearsall, W.H. 1923. Studies in growth. IV. Correlations in develop-ment. Ann. Bot. 37:261--275.
Pettersson, R., A.J.S. McDonald and I. Stadenberg. 1993. Response of small birch plants (Betula pendula Roth.) to elevated CO2 and nitrogen supply. Plant Cell Environ. 16:1115--1121.
Roberts, T.M., R.A. Skeffington and L.W. Blank. 1989. Causes of type 1 spruce decline in Europe. Forestry 62:179--221.
Schulze, E.-D., R. Oren and O.L. Lange. 1988. Nutrient relations of trees in healthy and declining Norway spruce stands. In Forest Decline and Air Pollution. Eds. E.D. Schulze, O.L. Lange and R. Oren. Ecological Studies 77, Springer-Verlag, pp 393--417. Shear, C.B. 1980. Interactions of nutrition and environment on mineral
composition of fruits. In Mineral Nutrition of Trees. Eds. D. Atkin-son, J.E. Jackson and R.O. Sharper. Butterworth Publishers, Lon-don, pp 41--50.
Steen, E. and K. Larsson. 1986. Carbohydrates in roots and rhizomes of perennial grasses. New Phytol. 104:339--346.
Taylor, G., A.J.S. McDonald, I. Stadenberg and P.H. Freer-Smith. 1993. Nitrate supply and the biophysics of leaf growth in Salix
viminalis. J. Exp. Bot. 44:155--164.
Thornley, J.H.M. 1972. A balanced quantitative model for root:shoot ratios in vegetative plants. Ann. Bot. 36:431--441.
Waring, R.H., A.J.S. McDonald, S. Larsson, T. Ericsson, A. Wirén, E. Arwidsson and T. Lohammar. 1985. Differences in chemical composition of plants grown at constant relative growth rates with stable mineral nutrition. Oecologia 66:57--160.
White, H.L. 1937. The interactions of factors in the growth of Lemna. XII. The interaction of nitrogen and light intensity in relation to root length. Ann. Bot.1:644--654.
Will, G.M. 1961. The mineral requirements of radiata pine seedlings. N.Z. J. Agric. Res. 4:309--327.