Summary We investigated effects of rehydration and time of sampling on solute accumulation in plants of two greenhouse-grown Populus deltoides Bartr. clones (Ohio Red and Platte) subjected to multiple cycles of water stress. Osmotic potential of leaves at full turgor was measured at predawn on well-wa-tered (control) and water-stressed (conditioned) plants that had been rewatered the previous afternoon. Water-soluble organic solutes (carbohydrates, phenolic glucosides and organic acids) were determined at both predawn and midday, before and after rewatering.
Conditioning resulted in solute accumulation; however, re-watering of conditioned plants decreased the predawn concen-tration of glucose by 19--35% and the total solute concenconcen-tration by 14--15%, relative to values before rewatering. There was a 52% increase in salicin concentration in response to rewatering in conditioned plants of the Platte clone. In conditioned plants of both clones, the concentration of glucose was generally lower at midday than at predawn (16--47%), whereas the concentration of sucrose was higher at midday than at predawn (46--133%). Time of sampling was an important factor in determining whether conditioning resulted in accumulation of glucose and fructose. Compared with control plants, there was a significant accumulation of glucose and fructose at predawn and either no accumulation or a significant reduction of these solutes at midday both before and after rewatering of condi-tioned plants. Sampling time also affected the amount of solute that accumulated in response to conditioning.
Keywords: eastern cottonwood, fructose, glucose, osmotic ad-justment.
Introduction
Osmotic adjustment is often measured as the difference in osmotic potential between well-watered and water-stressed plants at the same relative water content. For this reason, osmotic potential at full turgor is the most common value reported. To obtain full turgor, detached shoots, leaves or containerized plants are rewatered the night before sampling. Osmotic potential is then measured by the pressure--volume curve method (Cheung et al. 1975) or with a thermocouple
psychrometer (Jones and Rawson 1979, Gebre and Kuhns 1991). Although the effect of rehydration on pressure--volume relationships of tree species has been studied (e.g., Parker and Pallardy 1988, Evans et al. 1990, Kubiske and Abrams 1991), little is known about the effect of rehydration on solute accu-mulation. It is generally assumed that the solute content is unchanged by rehydration (Pallardy et al. 1991). However, based on the observation that sugar did not accumulate in nonrewatered wheat cultivars, whereas Munns and Weir (1981) and Johnson et al. (1984) reported sugar accumulation in rehydrated wheat cultivars, Morgan (1992) recently sug-gested that patterns of solute accumulation can be affected by rehydration.
Studies with sorghum (Sorghum bicolor L. Moench), chick-pea (Cicer arietinum L.) and wheat (Triticum aestivum L.) cultivars have indicated that osmotic adjustment can be used as a selection criterion in breeding for drought tolerance (Mor-gan et al. 1991, Mor(Mor-gan 1992, Basnayake et al. 1994). Because differences in osmotic potential, osmotic adjustment, and or-ganic solutes have also been reported for several poplar clones (Gebre et al. 1994, Tschaplinski and Tuskan 1994), it may be possible to use measurements of osmotic adjustment to iden-tify drought-tolerant clones and species of poplar. However, the value of osmotic adjustment as an indicator of drought tolerance may be limited if plants display differences in solute accumulation depending on whether they are sampled before or after rehydration (Morgan 1992).
Although diurnal variations in osmotic potentials and solute concentrations have been reported in cotton leaves (Ackerson 1981), osmotic potentials and solute concentrations are gener-ally measured at predawn or at midday (Morgan 1984). How-ever, most osmotic solutes that contribute to osmotic adjustment are photosynthetic products, thus, it is possible that sampling time will influence the type and concentration of solutes observed during recovery from water stress. For exam-ple, in sorghum, Jones and Rawson (1979) found net photosyn-thesis recovered fully 2--3 days after rewatering although osmotic potential of the stressed plants did not recover to control values even 6 days after rewatering. The objectives of this study were to compare organic solute accumulation in two poplar clones before and after rewatering of plants sampled at
Influence of rewatering and time of sampling on solute accumulation
of two
Populus deltoides clones
G. MICHAEL GEBRE,
1JAMES R. BRANDLE
2and MICHAEL R. KUHNS
31
Environmental Sciences Division, Oak Ridge National Laboratory, P.O. Box 2008, Oak Ridge, TN 37831--6422, USA
2
Department of Forestry, Fisheries and Wildlife, University of Nebraska, Lincoln, NE 68583--0814, USA
3 Department of Forest Resources, Utah State University, Logan, UT 84322--5215, USA
Received April 4, 1996
predawn and at midday, and to determine the effect of recovery from water stress on solute concentration.
Materials and methods
Plant material
Hardwood cuttings of eastern cottonwood (Populus deltoides Bartr.) clones Ohio Red and Platte were collected on March 23, 1993, and planted on April 5 in 15-liter containers as described by Gebre et al. (1994). All plants were fertilized with 200 ppm of a 20,10,20 (N,P,K) fertilizer solution twice a week until the experiment started on June 13, at which time 35 g of slow-re-lease fertilizer (14,14,14 N,P,K) was added to each container. Five plants per clone were assigned to each of two treatments: a well-watered (control) treatment and a water-stress treatment that involved repeated cycles of withholding water until two or more plants wilted and then watering the containers to satura-tion (condisatura-tioned). During the treatment period, plants were supplied with the 200 ppm soluble fertilizer once a week for well-watered plants and at the time of rewatering for the conditioned plants (after 5--8 days). Conditioned plants were not watered after July 13 (Platte, 5th dry--water cycle) and July 17 (Ohio Red, 6th dry--water cycle) until July 23 when all plants were rewatered to saturation at 1400 h. Because of clonal differences in wilting, plants were rewatered at different times and experienced different number of dry--wet cycles (5 or 6).
Organic solute analysis
On July 22, one day before sampling, leaf plastochron index (LPI) 9 was marked on all plants. On July 23, before plants were rewatered, a leaf with an LPI of 13 (with the petiole removed) was sampled from each plant at predawn for deter-mination of organic solute concentration and another leaf (LPI 11) was sampled at midday. One leaf (LPI 14) was col-lected from each plant on July 24 at predawn for determination of organic solute concentration and osmotic potential. On July 24, predawn leaf water potentials of the conditioned plants were greater than −0.05 MPa, indicating full recovery from the drought treatment. Leaves with LPI 12, 15, and 10 were collected at midday during the rehydration period (July 24--26, respectively) for organic solute analysis. By the end of the sampling period (July 26), LPI 10 had become LPI 11--12 as new leaves grew. To reduce the effect of leaf age, the difference in LPI between the oldest and youngest sampled leaves was limited to 5. As a result, when a leaf was either missing or damaged by wilting or insects, it was not replaced by lower (below LPI 15) or upper (above LPI 10) leaves. This resulted in only one plant being sampled from conditioned plants of Platte at midday on July 23. The number of plants sampled is indicated in the Figures and Tables.
All sampled leaves were immediately frozen in liquid nitro-gen and stored in a freezer before they were freeze-dried or used for osmotic potential determination. Organic solutes were analyzed as described by Gebre et al. (1994), except that the midvein was removed at the time of sampling. Briefly, water-soluble carbohydrates, phenolic glucosides, and organic acids
were extracted from 50 mg of dry ground leaf tissue in 2 ml of distilled deionized water by incubating the sample at 70 °C for 20 min (Tschaplinski and Blake 1989). The extraction was repeated twice and the extracts were combined, frozen, and lyophilized. Organic solutes were determined as trimethylsilyl derivatives and analyzed with a capillary chromatograph equipped with a flame ionization detector (Shimadzu Scien-tific Instruments Inc., Columbia, MD). Solute accumulation was calculated from the difference in solute concentrations between conditioned and control plants.
Samples for the determination of osmotic potential were obtained as described by Gebre and Kuhns (1991). Leaf discs (35 mm in diameter) were placed in a thermocouple cup and frozen in liquid nitrogen. Osmotic adjustment was calculated from the difference in osmotic potentials between conditioned and control plants.
Data analysis
Data were evaluated by two- and three-way analyses of vari-ance in accordvari-ance with a general linear model for a com-pletely randomized design using the SAS software package (SAS Institute, Inc., Cary, NC). Because of unequal replication (missing plants), the type III sums of squares option was used. The main factors were clone, water regime, sampling date (before and after rewatering), and sampling time (predawn and midday), with all factors fixed. However, analyses were lim-ited to water × date within a sampling time, water × time within a sampling date, and water × time × date within a clone for the days and times when there was a complete set of data on July 23 and 24. Data obtained during the recovery period (July 24--26) were analyzed using clone × water × date as main factors. The PDIFF option of least squares means was used to obtain t-tests for mean comparison. Significant differences were based on P ≤ 0.05.
Results
Effect of water stress and rehydration at predawn
The Ohio Red clone showed an osmotic adjustment of 0.36 MPa and the Platte clone exhibited an osmotic adjustment of 0.52 MPa, but the predawn leaf water potential of Ohio Red was lower than that of Platte (Table 1). The difference in the values of osmotic adjustment between clones was largely caused by the higher baseline osmotic potential in plants of the Platte clone relative to that of plants of the Ohio Red clone.
Effect of water stress and rehydration at midday
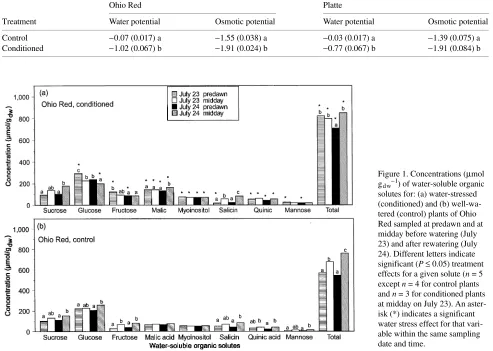
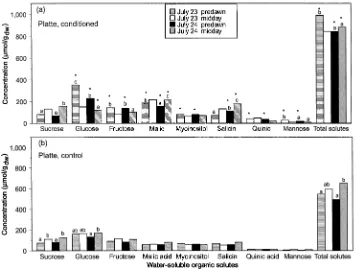
When samples were collected at midday on both July 23 and 24, conditioned plants of Ohio Red had more malic acid, myoinositol, and total solutes than control plants (cf. Figures 1a and 1b). Concentrations of salicin, malic acid, quinic acid, and total solutes were higher in conditioned plants than in control plants of Platte after rewatering (compare Figures 2a and 2b). The concentrations of malic acid and total solutes of both clones and the concentration of salicin in plants of the Platte clone remained higher in conditioned plants than in control plants throughout the recovery period (July 24--26) (Figures 3 and 4). During recovery from the drought cycles, sucrose concentrations of conditioned plants increased by 29%--44% compared to concentrations before rewatering (Fig-ures 3b and 4b). In conditioned plants, glucose concentrations were lower on July 24 than on July 23 (Ohio Red), and they were lower in conditioned plants than in control plants on July 24 (both clones) and July 25 (Platte), but recovered to control values by July 26 (Figures 3a and 4a). With the
excep-tion of glucose and total solutes, solute concentraexcep-tions of control plants did not change with sampling date.
In conditioned plants, the concentration of glucose was higher at predawn than at midday both before and one day after rewatering, whereas the concentrations of sucrose, malic acid, and salicin were higher at midday than at predawn after rewa-tering (Figures 1 and 2). In both clones, control plants exhib-ited higher solute concentrations at midday than at predawn on July 24. Total solute concentration was significantly higher at midday than at predawn for rewatered Ohio Red conditioned plants, but there was no difference in concentration when samples were collected before rewatering (Figure 1a).
Discussion
Despite the wilting of some leaves during the last cycle (10 days without water), plants of the Platte clone maintained higher predawn leaf water potentials than plants of the Ohio Red clone (Table 1). This difference may be explained, in part, by the morphological differences between clones. For exam-Table 1. Predawn leaf water potentials (MPa) (before rewatering, July 23) and osmotic potentials (MPa) (after rewatering, July 24) of two P. deltoides clones that were watered daily (control) and watered after water potentials of less than −0.7 MPa were reached (conditioned). Predawn leaf water potentials after rewatering were greater than −0.05 MPa and are not included in the table. Different letters within a column for a clone indicate significant treatment differences for a variable at P≤ 0.05. Standard errors of means are indicated in parenthesis (n = 4 except n = 3 for water potential).
Ohio Red Platte
Treatment Water potential Osmotic potential Water potential Osmotic potential
Control −0.07 (0.017) a −1.55 (0.038) a −0.03 (0.017) a −1.39 (0.075) a Conditioned −1.02 (0.067) b −1.91 (0.024) b −0.77 (0.067) b −1.91 (0.084) b
Figure 1. Concentrations (µmol gdw−1) of water-soluble organic
ple, there were significant clonal and treatment differences in the size of individual mature leaves, although neither total leaf area nor leaf area index was determined. Based on an average of five leaves (LPI 16) per clone and treatment, Ohio Red had large leaves ranging from 159 cm2 (conditioned) to 358 cm2 (control): the corresponding values for Platte were 96 to 177 cm2 (Gebre 1993). In an earlier study, we had also found that Platte plants had lower stomatal conductance than Ohio Red plants, which may partly explain the maintenance of high leaf water potentials (Gebre and Kuhns 1993).
In the predawn samples, solutes accounted for only about 50% of the osmotic adjustment. Furthermore, no significant differences in inorganic ions between control and conditioned plants of these two clones were observed in an earlier study (Gebre 1993). The contribution of primary amino acids is also reported to be low in several poplar clones (Tschaplinski and Tuskan 1994).
Rewatering conditioned plants reduced the concentrations of glucose, fructose (Ohio Red), and malic acid (Platte) in the predawn samples. Similarly, predawn samples from grasses exhibited declines in sucrose, glucose, and fructose concentra-tions one day after rewatering, although fructose recovered and exceeded control values two days after rewatering (Thomas 1991). The decrease in solute concentration in response to rewatering may have been caused by increased translocation as the plants recovered from water stress. Of the solutes that we measured in predawn samples, only salicin in plants of the Platte clone showed an increase in concentration after rewater-ing; however, it was lower in conditioned plants than in control plants of Ohio Red regardless of rewatering. Despite the de-crease in solute concentration in response to rewatering, con-ditioned plants had more organic solutes than control plants.
Within a sampling time, clonal differences in solute accumu-lation were not altered by rewatering. For example, at pre-dawn, Platte plants accumulated 193 µmol gdw−1 more total
solutes than Ohio Red before rewatering and 185 µmol gdw−1
after rewatering. When sampled at midday, Platte accumulated 128 µmol gdw−1 more total solutes than Ohio Red before
rewa-tering and 138 µmol gdw−1 after rewatering (Figures 1 and 2).
Unlike samples collected at predawn, midday samples did not exhibit significant reductions in solute concentration in response to rewatering, except for quinic acid in plants of the Platte clone. The concentrations of most solutes increased from predawn to midday; however, the increase was greater in control plants than in conditioned plants and, as a result, the degree of osmotic adjustment exhibited by the conditioned plants was less at midday than at predawn (osmotic potential was not measured at midday). For example, on July 24, there was a solute accumulation (difference between conditioned and control plants) of 164 µmol gdw−1 at predawn compared to
89 µmol gdw−1 at midday, despite an increase in total solutes of
141 µmol gdw−1 of total solutes at midday compared with
predawn in the conditioned Ohio Red plants. Similarly, Platte plants had 40 µmol gdw−1 more total solutes at midday than at
predawn in the conditioned plants but an accumulation of 227 µmol gdw−1 at midday compared to 349µmol gdw−1 at
predawn (Figure 2). Thus, plants that show small osmotic adjustments when sampled at predawn may not exhibit signifi-cant differences when sampled at midday. This effect may be more pronounced in a clone or species known to accumulate reducing sugars (e.g., fructose and glucose) for osmotic adjust-ment, because glucose and fructose were the solutes most affected by sampling time. We conclude that sampling time is
Figure 2. Concentrations (µmol gdw−1) of water-soluble
an important component to be considered when investigating the role of organic solutes in drought tolerance.
Because osmotic potential usually increases with recovery from water stress (Morgan 1984), we had hypothesized that there would be either a decrease or, if recovery was very slow, no change in solute concentration during the recovery period. Although solute concentrations measured at predawn did not change during the recovery period, this was not the case for the midday samples (Figures 3 and 4). When recovery from water stress was followed by rewatering plants one day before each midday sampling, sucrose and fructose concentrations contin-ued to increase and were higher than control values until the final day of sampling (July 26). Malic acid concentration also remained higher in conditioned plants than in control plants for most of the recovery period despite a sharp decline in plants of the Platte clone. This observation is similar to that of Ford and Wilson (1981) who reported continued higher sucrose and malic acid concentrations in conditioned spear grass than in well-watered plants ten days after rewatering. In contrast to the increase in sucrose and fructose concentrations, the
concentra-tion of glucose remained lower in condiconcentra-tioned plants than in control plants of clone Platte during recovery on July 25 and 26, although it was not significantly different for plants of the Ohio Red clone. Because higher photosynthetic rates during recovery of conditioned plants compared with well-watered plants have been reported for several species (Bennett and Sullivan 1981, Ceulemans et al. 1983, Gebre and Kuhns 1993), we speculate that the trend of increasing sucrose concentration during the recovery period may be related to stimulation of photosynthesis.
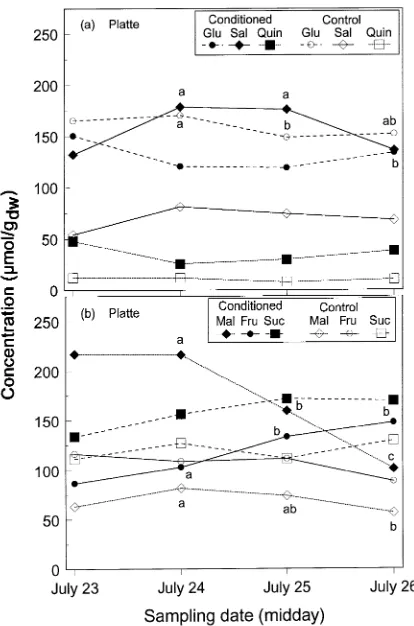
In summary, rewatering conditioned plants reduced the con-centrations of some major solutes. Within a sampling time, the difference in solute accumulation between clones remained the same irrespective of whether leaves were sampled before or within a day after rewatering. The contribution of specific solutes depended on time of sampling. Some solutes (e.g., glucose) increased at predawn but were unchanged or declined at midday. Similarly, although there were no significant differ-Figure 4. Concentrations (µmol gdw−1) of water-soluble organic
sol-utes: (a) glucose (Glu), salicin (Sal), and quinic acid (Quin) in water-stressed (conditioned) and well-watered (control) plants; (b) malic acid (Mal), fructose (Fru), and sucrose (Suc) of Platte sampled at midday before watering (July 23) and 24 h after each rewatering (July 24--26). Different letters on a given solute (line) indicate a significant (P≤ 0.05) sampling date effect during the recovery (n = 5 except n = 4 for conditioned plants on July 24 and control plants on July 23, and n = 1 for conditioned plants on July 23). Note that the data for condi-tioned plants on July 23 were included for comparison only and no statistical analysis was made.
Figure 3. Concentrations (µmol gdw−1) of water-soluble organic
ences in sucrose concentration between conditioned and con-trol plants at predawn both before and a day after rewatering, sucrose concentration was significantly higher in conditioned plants than in control plants during the extended recovery period. Total solute concentration of conditioned plants at midday remained higher than control values throughout the recovery period indicating that osmotic adjustment continued for several days after full recovery of the plants.
Acknowledgments
The authors acknowledge the comments and suggestions of Drs. Timothy Tschaplinski and Stan Wullschleger on the manuscript. This study was partly supported by funds from the McIntire-Stennis Coop-erative Research Program. Preparation of this manuscript was sup-ported in part by the Biofuels Feedstock Development Program, U.S. Department of Energy, under contract DE-AC05-960R22464 with Lockheed Martin Energy Research Corp. and by an appointment to the Oak Ridge National Laboratory Postdoctoral Research Associates Program administered jointly by the Oak Ridge National Laboratory and the Oak Ridge Institute for Science and Education.
References
Ackerson, R.C. 1981. Osmoregulation in cotton in response to water stress. II. Leaf carbohydrate status in relation to osmotic adjust-ment. Plant Physiol. 67:489--493.
Basnayake, J., M. Cooper, M.M. Ludlow and R.G. Henzell. 1994. Combining ability variation for osmotic adjustment among a se-lected range of grain sorghum (Sorghum bicolor L. Moench) lines. Field Crop Res. 38:147--155.
Bennett, J.M. and C.Y. Sullivan. 1981. Effect of water stress precon-ditioning on net photosynthetic rate of grain sorghum. Photosyn-thetica 15:330--337.
Ceulemans, R., I. Impens and A.P. Ng. 1983. Photosynthesis, stomatal conductance and leaf water potential during water stress situations in young rubber trees (Hevea brasiliensis) under tropical condi-tions. In Effects of Stress on Photosynthesis. Eds. R. Marcelle, H. Clijsters and M. van Poncke. Martinus Nijhoff/Dr. W. Junk Publishers, The Hague, pp 111--119.
Cheung, Y.N.S., M.T. Tyree and J. Danity. 1975. Water relations parameters on single leaves obtained in a pressure bomb and some ecological interpretations. Can. J. Bot. 53:1342--1346.
Evans, R.D., R.A. Black and S.O. Link. 1990. Rehydration-induced changes in pressure--volume relationships of Artemisia tridentata Nutt. spp. tridentata. Plant Cell Environ. 13:455--461.
Ford, C.W. and J.R. Wilson. 1981. Changes in leaves of solutes during osmotic adjustment to water stress in leaves of four tropical pasture species. Aust. J. Plant Physiol. 8:77--91.
Gebre, G.M. 1993. The role of organic solutes in dehydration toler-ance of several Populus deltoides clones. Ph.D. Diss., University of Nebraska, Lincoln, NE, 157 p.
Gebre, G.M. and M.R. Kuhns. 1991. Seasonal and clonal variations in drought tolerance of Populus deltoides. Can. J. For. Res. 21:910--916.
Gebre, G.M. and M.R. Kuhns. 1993. Effects of water stress precondi-tioning on gas exchange and water relations of Populus deltoides clones. Can. J. For. Res. 23:1291--1297.
Gebre, G.M., M.R. Kuhns and J.R. Brandle. 1994. Organic solute accumulation and dehydration tolerance in three water-stressed Populus deltoides clones. Tree Physiol. 14:575--587.
Johnson, R.C., H.T. Nguyen and L.I. Croy. 1984. Osmotic adjustment and solute accumulation in two wheat genotypes differing in drought resistance. Crop Sci. 24:957--962.
Jones, M.M. and H.M. Rawson. 1979. Influence of rate of develop-ment of leaf water deficits upon photosynthesis, leaf conductance, water use efficiency, and osmotic potential in sorghum. Physiol. Plant. 45:103--111.
Kubiske, M.E. and M.D. Abrams. 1991. Rehydration effects on pres-sure--volume relationships in four temperate woody species: vari-ability with site, time of season and drought conditions. Oecologia 85:537--542.
Morgan, J.M. 1984. Osmoregulation and water stress in higher plants. Annu. Rev. Plant Physiol. 35:299--319.
Morgan, J.M. 1992. Osmotic components and properties associated with genotypic differences in osmoregulation in wheat. Aust. J. Plant Physiol. 19:67--76.
Morgan, J.M., B. Rodriguez-Maribona and E.J. Knights. 1991. Adap-tation to water-deficit in chickpea breeding lines by osmoregula-tion: relationship to grain yields in the field. Field Crop Res. 27:61--70.
Munns, R. and R. Weir. 1981. Contribution of sugars to osmotic adjustment in elongating and expanded zones of wheat leaves dur-ing moderate water deficits at light levels. Aust. J. Plant Physiol. 8:93--105.
Pallardy, S.G., J.S. Pereira and W.C. Parker. 1991. Measuring the state of water in tree systems. In Techniques and Approaches in Forest Tree Ecophysiology. Eds. J.P. Lassoie and T.M. Hinckley. CRC Press, Inc., Boca Raton, FL, pp 27--76.
Parker, W.C. and S.G. Pallardy. 1988. Pressure--volume analysis of leaves of Robinia pseudoacacia L. with the sap expression and free transpiration methods. Can. J. For. Res. 18:1211--1213.
Thomas, H. 1991. Accumulation and consumption of solutes in swards of Lolium perenne during drought and after rewatering. New Phy-tol. 118:35--48.
Tschaplinski, T.J. and T.J. Blake. 1989. Water-stress tolerance and late-season organic solute accumulation in hybrid poplar. Can. J. Bot. 67:1681--1688.