Investigating technical and scale efficiencies of Australian
Universities through data envelopment analysis
Necmi K. Avkiran*
The University of Queensland, Department of Commerce, Ipswich Campus, QLD 4305, Australia
Received 1 March 1999; received in revised form 1 November 1999
Abstract
Performance indicators in the public sector have often been criticised for being inadequate and not conducive to analysing efficiency. The main objective of this study is to use data envelopment analysis (DEA) to examine the relative efficiency of Australian universities. Three performance models are developed, namely, overall performance, performance on delivery of educational services, and performance on fee-paying enrolments. The findings based on 1995 data show that the university sector was performing well on technical and scale efficiency but there was room for improving performance on fee-paying enrolments. There were also small slacks in input utilisation. More universities were operating at decreasing returns to scale, indicating a potential to downsize. DEA helps in identifying the reference sets for inefficient institutions and objectively determines productivity improvements. As such, it can be a valuable benchmarking tool for educational administrators and assist in more efficient allocation of scarce resources. In the absence of market mechanisms to price educational outputs, which renders traditional production or cost functions inappropriate, universities are particularly obliged to seek alternative efficiency analysis
methods such as DEA. # 2001 Elsevier Science Ltd. All rights reserved.
Keywords: DEA; University performance; Technical efficiency; Scale efficiency
1. Introduction
The purpose of this paper is to demonstrate the use of data envelopment analysis (DEA) in examining the relative efficiency of Australian universities for the main benefit of the practitioner. The current economic climate in the Australian public sector and the funding restructure of universities make this article timely and relevant to the needs of decision makers. Increasing accountability of universities to their providers and educational administrators’ desire to better
* Tel.: +61-7-338-11216; fax: +61-7-338-11227.
E-mail address:[email protected] (N.K. Avkiran).
utilise scarce resources indicate that efficiency analysis will become more common among universities. Conversely, failure to make efficiency analysis a standard practice would certainly lead to less than efficient allocation of educational resources.
Performance indicators in the public sector have often been criticised for being inadequate and not conducive to analysing efficiency [1,2]. Typical criticisms include focusing on inputs to the detriment of outputs, an ad hoc selection of indicators, and an inability to distinguish inefficiency from environmental factors. Similarly, stochastic frontier techniques are ill-adapted for studying multiple outputs that are jointly produced since the analyst is normally limited to focusing on one output at a time.
On the other hand, DEA is particularly appropriate where the researcher is interested in investigating the efficiency of converting multiple inputs into multiple outputs. For example, DEA can identify alternative configurations of inputs that can result in higher outputs without necessarily raising the overall use of resources. DEA is a linear programming technique that enables management to benchmark the best practice decision making unit (DMU), i.e. a university. Further, DEA provides estimates of potential improvements for inefficient DMUs. In not-for-profit organisations, where market prices or relative values of outputs are not readily available, DEA emerges as a particularly useful service management technique. Commercially available DEA software includes Frontier Analyst, Warwick DEA, OnFront, and IDEAS. There is also DEA software free for academic users, namely EMS and DEAP.
The mathematical formulations behind DEA are not discussed because others have already adequately covered this area [3–6]. A summary of DEA mathematics has been included in Appendix A. The current article demonstrates how DEA can be used to develop models of efficiency for universities. The minimum theory needed by the end-users of DEA (selection of analysis options and correct interpretation of DEA results) are addressed herein. The study also distinguishes between pure technical efficiency (PTE) and scale efficiency (SE) while determining the nature of returns to scale for each university. In further discussions, the words ‘‘efficiency’’, ‘‘productivity’’, and ‘‘performance’’ are used interchangeably.
Three models of university efficiency have been developed in this study, namely, overall performance, performance on delivery of educational services, and performance on fee-paying enrolments. The findings show that Australian universities are, in general, technical and scale efficient. Furthermore, the performance models adequately discriminate between efficient and inefficient universities. The largest potential improvements for Australian universities were in fee-paying enrolments. Small input slacks were found across the first two models. A majority of Australian universities have apparently been operating under a regime of decreasing returns to scale (DRS) while about one-third have been at a most productive scale size (MPSS)1, with a small number at increasing returns to scale (IRS).
Under the coverage of DEA for the end-user, this article’s contributions to the literature include: performance model design, decision processes involved in selection of DEA analysis options, correct interpretation of DEA results, and an application checklist (see Conclusion). While most applications of DEA report model design and interpretation of test results, there is usually little space allocated to the decision processes entailed in the selection of DEA analysis
1
options. Furthermore, DEA theory is usually covered as an exposition of DEA mathematics. We break from this mould by using non-mathematical language that can be appreciated by both practitioners and novice researchers in the field. Key jargon is introduced only on a need-to-know basis. Equally important, the style of the article implicitly assumes that the practitioner applying DEA will be using one of the available software packages and is unlikely to attempt writing a computer code or designing a complex spreadsheet.
The fundamentals of DEA theory, literature review and the process for selection of inputs and outputs are discussed in Section 2. Design of the three efficiency models and selection of analysis options are addressed in Section 3. Test results and interpretations are provided in Section 4, followed by a discussion of managerial implications and presentation of an application checklist in Section 5.
2. Conceptual framework
2.1. Efficiency and data envelopment analysis
Sherman [9, p. 3] defines efficiency as ‘‘the ability to produce the outputs or services with a minimum resource level required’’. Similarly, productivity is defined as the efficiency of production. Farrell [10], who is credited with pioneering the measurement of productive efficiency, recognised the importance of measuring the extent to which outputs can be increased through higher efficiency without using additional resources (inputs).
Efficient production is defined in terms of Pareto optimality. The conditions of Pareto optimality state that a DMU is not efficient if an output can be increased without raising any of the inputs and without decreasing any other output. Similarly, a DMU is not efficient if an input can be decreased without decreasing any of the outputs and without increasing any other input [11]. It should be noted that the Pareto optimality criterion used by DEA suffers from a potential conceptual weakness. That is, each input/output is considered of equal value to the decision-maker [12].
DEA was initially been used to investigate the relative efficiency of not-for-profit organisations, only to quickly spread to profit-making organisations. DEA has been successfully applied in such diverse settings as schools, hospitals, courts, the US Air Force, rate departments and banks [13–18]. Charnes et al. [19] have compiled an extensive discussion of efficiency models across a variety of industries.
DEA is a non-parametric linear programming technique that computes a comparative ratio of outputs to inputs for each unit, which is reported as the relative efficiency score. The efficiency score is usually expressed as either a number between 0–1 or 0–100%. A decision-making unit with a score less than 100% is deemed inefficient relative to other units. In this article, DEA is used to measure the technical efficiency (TE) of DMUs as opposed to allocative efficiency.
An advantage of DEA is that there is no preconceived functional form imposed on the data in determining the efficient units [4,8,20,21]. That is, DEA estimates the production function of efficient DMUs using piecewise linear programming on the sample data instead of making restrictive assumptions about the underlying production technology. The importance of this feature here is that a university’s efficiency can be assessed based on other observed performance. As an efficient frontier technique, DEA identifies the inefficiency in a particular DMU by comparing it to similar DMUs regarded as efficient, rather than trying to associate a DMU’s performance with statistical averages that may not be applicable to that DMU.
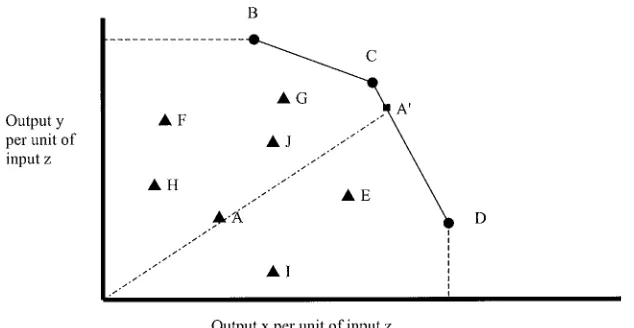
Fig. 1 shows a simple efficiency model to highlight this principle. The solid line going through efficient DMUs B–D depicts the efficient frontier that represents achieved efficiency. For example, DMU A is classified asinefficientin this sample of 10 units. It needs to travel to A0(i.e. composite DMU) on the frontier before it can also be deemed efficient. DMUs C and D on the efficient frontier (i.e. reference set or peer group of DMU A) are the units used for comparison in calculating the input/output configuration of its efficient composite DMU A0. The efficient frontier envelopes all other data points, thus giving rise to the name data envelopment analysis.
Usually, the number of physical units or transactions is used in DEA [3,22]. The principal disadvantage of DEA is that it assumes these and other data to be free of measurement error [21]. When the integrity of data has been violated, DEA results cannot be interpreted with confidence. While the need for reliable data is the same for all statistical analysis, DEA is particularly sensitive to unreliable data because the units deemed efficient determine the efficient frontier and, thus, the efficiency scores of those units under this frontier. For example, an unintended reclassification of the efficient units could lead to recalculation of efficiency scores of the inefficient units. This potential problem with DEA is addressed through stochastic DEA designed to account for random disturbances. Two recent examples in this area are Li [23] and Sengupta [24].
Another caveat of DEA is that those DMUs indicated as efficient are only efficient in relation to others in the sample. It may be possible for a unitoutside the sample to achieve a higher level of efficiency than the best practice DMUinthe sample. Another way of expressing this is to say that
an efficient unit does not necessarily produce the maximum output feasible for a given level of input [25].
How can the educational administrator use DEA? It has already been stated that DEA generates efficiency scores, thus helping to distinguish efficient from inefficient units. Nevertheless, a list of units sorted on efficiency scores cannot always be considered as truly rank ordered [9]. DEA identifies a unit as either efficient or inefficient compared to other units in its reference set, where the reference set is comprised of efficient units most similar to that unit in their configuration of inputs and outputs. Knowing which efficient universities are most comparable to the inefficient university thus enables the educational administrator to better understand the relevant inefficiencies and subsequently re-allocate scarce resources to improve productivity.
2.2. Performance measurement in higher education
An overview of difficulties with some of the performance indicators in higher education could be a primer to understanding the potential role of DEA in efficiency analysis. For example, Cave et al. [26] describe a performance indicator such as ‘‘degree results’’ as a quality-adjusted measure of output. This indicator is typical of the ambiguity found in education performance indicators in that high degree results may, for example, be due to high entry qualifications rather than effectiveness of teaching. Even the value added, productivity indicator, described as an input- and quality-adjusted output measure, relies on differences in qualifications that cannot be valued in monetary terms.
Typical performance indicators on the research side of the equation include number of publications, number of citations of publications, journal impact factors, and reputational ranking. Number of publications, often interpreted as a measure of research activity, suffers from the problem of different practices across disciplines. For example, publishing in medicine may consume more time and resources and lead to fewer publications than publishing in business. There is also the difficulty of ownership since a research project started in one university will often be carried to another university when the researcher relocates. The number of citations attracted by an article has its drawbacks as well; for example, articles in mathematics have a longer shelf life than those in pharmacy [27].
Impact factors are not particularly measurement problem free either. For instance, academics that devote most of their time to writing articles that are published in low impact journals will be disadvantaged in this count regardless of the contribution of research to the body of knowledge. On the other hand, reputational ranking is bound to have considerable subjectivity and reflect a historical performance [26]. Clearly, the main criticism of performance indicators is their inability to capture the interplay among the various inputs and outputs. This is where DEA offers a solution.
As has already been indicated, the current study develops performance models from the perspective of the educational administrator or manager. A book by Thomas [28] discusses three ways of conceptualising the production process (inputs and outputs) of an educational institution. These are the production functions of the psychologist, the economist, and the administrator.
subjective inputs/outputs, which are difficult to quantify. The economist’s perspective concerns itself with the additional earnings generated by expenditure on schooling. Put another way, education is regarded as contributing to the economy through individuals with competencies [29]. The administrator’s perspective focuses on the institutional manager’s attempts at allocating resources to provide services. The key outputs under this approach emanate from teaching and research activities, with research as the more difficult of the two to measure. The administrator would be primarily interested in controllable inputs. For example, in the case of staff inputs, it is appropriate to use salary as a proxy since it represents the monetary value of key inputs into the teaching and research processes [29]. Alternatively, a measurement can be taken with full-time equivalence (FTE).
In education, it is difficult to use market mechanisms such as profits to determine the performance of a DMU [30]. A key advantage of DEA is that educational administrators or their nominated researchers can choose inputs and outputs to represent a particular perspective or approach. For example, key business drivers critical to success of the organisation can be the outputs. Then, those variables that can be argued to manifest themselves as outputs become the inputs. A simple model of university efficiency might argue that when academic staff and buildings and grounds (inputs) are put together, they give rise to enrolments (output). Hence, a resource is classified as an input while anything that uses resources is classified as an output. DEA forces policy-makers to explicitly state the objectives of the organisation. Ultimately, these objectives become the outputs in efficiency modelling and the resources needed become the inputs. A survey of literature on applications of DEA in higher education follows.
2.2.1. DEA and university departments
The application of DEA to universities has generally focused on the efficiencies of university programs or departments. The seven key studies are by Bessent et al. [31], Tomkins and Green [32], Beasley [33], Johnes and Johnes [34], Stern et al. [35], Beasley [36] and Johnes and Johnes [6]. Bessent et al. [31] used DEA in measuring the relative efficiency of education programs in a community college. Educational programs (DMUs) were assessed on such outputs as revenue from state government, number of students completing a program, and employer satisfaction with training of students. These outputs represented significant planning objectives. Inputs included student contact hours, number of full-time equivalent instructors, square feet of facilities for each program, and direct instructional expenditures. The authors demonstrated how DEA can be used in improving programs, terminating programs, initiating new programs, or discontinuing inefficient programs.
Johnes and Johnes [6,34] explored various models in measuring the technical efficiency of economics departments in terms of research output. They discuss the potential problems in choosing inputs and outputs. The authors also provide a good guide to interpreting efficiency scores. It is interesting to note that both Beasley [33] and Johnes and Johnes [6] list research income as an input.
Stern et al. [35] examined the relative efficiency of 21 academic departments in Ben-Gurion University. Operating costs and salaries were entered as inputs, while grants, publications, graduate students, and contact hours comprised the outputs. Analysis suggested that the operating costs could be reduced in 10 departments. Furthermore, the authors tested for the sensitivity of efficiency scores to deleting or combining variables. Their findings indicated that efficient departments may be re-rated as inefficient as a result of changing the variable mix. Similarly, Nunamaker [12], who has investigated the effects of changing the variable mix on DEA scores, reported a general rise when new variables were added or existing variables disaggregated.
2.2.2. DEA and universities
There are six main studies that have used DEA to investigate the relative efficiency of universities (rather than departments) [37–42]. Ahn (in [37,38,40]) looked at the efficiency of US universities through DEA and compared findings to observations made using managerial accounting measures and econometric approaches. In comparing the efficiency of public universities in Texas, Ahn used faculty salaries, state research funds, administrative overheads, and total investment in physical plants as the inputs to the efficiency model. Outputs were number of undergraduate enrolments, number of graduate enrolments, total semester credit hours, and federal and private research funds. Ahn listed state research funds as an input because the state government allocated such funds to assist in securing grants from the Federal Government and from industry. He used research income from agencies such as the US National Science Foundation as outputs because it provided a way to quantify peer group evaluation. Inclusion of one source of research funds as an input and the other source as an output highlights the necessity to scrutinise the nature of a factor before classification. Indeed, the selection of factors is a critical input by the researcher when using DEA.
Ahn and Seiford [39] examined public and private doctoral-granting US institutions to test the sensitivity of findings in four DEA and four performance models. This was achieved by testing for statistically significant differences between mean model scores rather than focusing on individual institutions. On the inputs side, they listed faculty salaries, physical investment, and overheads as common variables across all models. On the other side, undergraduate and graduate FTEs, degrees and grants comprised the mix of outputs. They inferred that relative efficiency results were consistent across the DEA models. However, aggregation of outputs resulted in lower efficiency scores. Furthermore, public institutions emerged as more efficient than private ones where closely monitored and high-profile outputs such as enrolments were used.
efficiency models were non-staff expenses, other expenses, other administration expenses, and administration staff. All models were set up as 22 (outputsinputs). Conclusions of the study indicated that while UNE’s overall performance compared favourably to that of other universities, there was scope for improving the performance of the administrative sector. No significant relationship was found between efficiency and percent of external enrolments or proportion of part-time enrolments. Furthermore, UNE was operating at optimal scale. Part of this study is also reported in Coelli et al. [42].
The article by Breu and Raab [41] used commonly available performance indicators to measure the relative efficiency of the top 25 US universities (as ranked by US News and World Report). Outputs used were graduation rate and freshman retention rate as measures of student satisfaction. Inputs included SAT/ACT average or midpoint, percentage faculty with doctorates, faculty to student ratio, and educational and general expenditures per student. Their findings indicated that universities with high prestige and reputation did not necessarily produce higher student satisfaction. The authors concluded the study by proposing that universities spend less on enhancing perceived quality and spend more effort on raising efficiency.
It should be clear by now that there is no definitive study to guide the selection of inputs/ outputs in educational applications of DEA. While outputs can be generally categorised into teaching, research, and service, it is very difficult to find true measures for these dimensions [39, p. 197]. In short, it is possible for the analyst to select a parsimonious set of desired outputs, provided they can be reasoned to be manifestations of inputs. There is thus a pressing need for the choice of inputs and outputs to reflect the industry or the setting examined. Accepted theories in different fields can also be employed to help select the inputs and outputs. In this study, production theory provides the starting point for efficiency modelling.
Production theory is concerned with relationships among the inputs and outputs of organisations [44]. This approach requires the specification of inputs and outputs in quantitative terms. According to Lindsay [29] and Johnes [44], some of the generally agreed inputs of universities can be classified as human and physical capital, and outputs as arising from teaching and research activities. In selecting variables, controllable inputs and those outputs of particular interest to administrators are preferred. However, there is always the danger of excluding an important performance variable due to lack of suitable data or to limitations imposed by small sample sizes. Therefore, it is essential to develop a good understanding of the inputs and outputs before interpreting results of any efficiency model.
3. Research design
3.1. Definingperformance models
recognises the importance of this measure in Federal funding. In this instance, research output is represented by Research Quantum, which is the research component of Federal funds given to universities in recognition of their share of overall research activity. Part of Research Quantum is indexed to the number of publications, which carries a 12.5% weighting in the Composite Index used to calculate the Research Quantum. (Other components of the index are competitive research grants earned and higher degree research completions [45].)
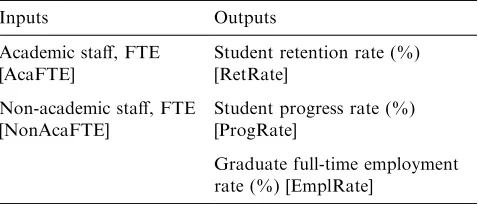
The second performance model focuses on delivery of educational services (see Table 2). The inputs are the same as in the first model. The purpose here is to compare how successful staff are in delivering the educational services that contribute to enrolling graduating students into other courses in the same university (retention rate); successful student subject load (student progress rate); and, proportion of graduates in full-time employment as a percentage of graduates available for full-time work (graduate full-time employment rate).
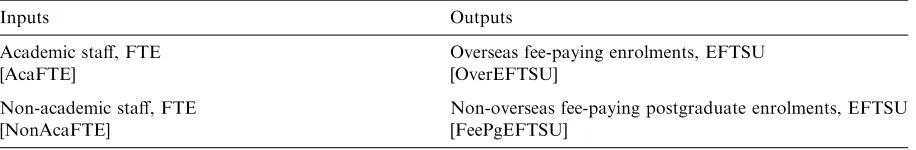
The third performance model is designed to explore the success of universities in attracting fee-paying students. In the context of the recent changes in Australia, where Federal budget contributions to universities are in decline, there is a growing pressure on universities to fill this financial gap by increasing the number of fee-paying enrolments. The model depicted in Table 3
Table 1
Overall performance (model 1)a
Inputs Outputs
Academic staff, FTE [AcaFTE]
Undergraduate enrolments, EFTSU
[UgEFTSU] Non-academic staff, FTE
[NonAcaFTE]
Postgraduate enrolments, EFTSU
[PgEFTSU] Research quantum [RQ]
aNote: FTE, time equivalence. EFTSU, equivalent full-time student unit, measures student load. Research quantum is expressed as share of Commonwealth Government grants (%).
Table 2
Performance on delivery of educational services (model 2)
Inputs Outputs
Academic staff, FTE Student retention rate (%)
[AcaFTE] [RetRate]
Non-academic staff, FTE Student progress rate (%) [NonAcaFTE] [ProgRate]
has the same inputs as in the previous two models but the outputs are replaced by overseas fee-paying enrolments and non-overseas fee-fee-paying postgraduate enrolments. Currently, there are no reliable figures available on non-overseas fee-paying undergraduate enrolments as it is on trial.
The choice of variables in the above performance models can be traced to literature in Section 2. For example, staff numbers appear as inputs in Tomkins and Green [32]. Similarly, student numbers appear as outputs in [32,33,37–40,42]. Ahn (in [37,38,40]) also uses research income from the Federal Government (i.e. Research Quantum) as an output. Breu and Raab [41] use student retention rate as an output. The remaining output variables in the performance models tested here represent dimensions that were deemed of particular importance. For example, use of graduate full-time employment rate and student progress rate add new dimensions to the study of efficiency in higher education.
3.2. Selectinganalysis options in DEA
Having identified the three performance models, the analysis options available in DEA are addressed next. Input minimisation (also known as input orientation or contraction) instructs DEA to reduce the inputs as much as possible without dropping the output levels. For instance, the analyst could opt for input minimisation in an exercise to save costs or downsize. Alternatively, when management’s focus is on raising productivity without increasing the resource base, output maximisation (also known as output orientation or expansion) could be specified. Under output maximisation, outputs are raised without increasing the inputs. It is worth noting that when none of the inputs is controllable by management (not the case in this study), one can only specify the output maximisation model. All performance models in this study are run under the analysis option of output maximisation where inputs are deemed controllable by management. It is also possible to find slacks in inputs or outputs. For example, under input minimisation, potential improvements indicated by DEA may suggest increasing one or more of the outputs while lowering the inputs. Such slacks depict outputs that are under-produced. Similarly, under output maximisation, the results may suggest raising outputs as well as reducing inputs (i.e. an input slack). In such a case, input reduction implies over-utilised inputs.
Another analysis option in DEA is a choice between constant returns to scale (CRS) and variable returns to scale (VRS). Constant returns to scale assumes that there is no significant relationship between the scale of operations and efficiency. That is, large universities are just as efficient as small ones in converting inputs to outputs. Under constant returns to scale, input minimisation and output maximisation produce the same relative efficiency scores, provided all
Table 3
Performance on fee-paying enrolments (model 3)
Inputs Outputs
Academic staff, FTE Overseas fee-paying enrolments, EFTSU
[AcaFTE] [OverEFTSU]
Non-academic staff, FTE Non-overseas fee-paying postgraduate enrolments, EFTSU
inputs are controllable. On the other hand, variable returns to scale means a rise in inputs is expected to result in a disproportionate rise in outputs [22]. VRS is preferred when a significant correlation between DMU size and efficiency can be demonstrated in a large sample. In such an exercise, academic staff numbers can represent the size of the university [6].
An alternative approach that removes much of the guesswork from choosing between CRS and VRS is to run the performance models under each assumption and compare the efficiency scores. If a majority of the DMUs emerge with different scores under the two assumptions, then it is safe to assume VRS. Put another way, if the majority of DMUs are assessed as having the same efficiency, one can employ CRS without being concerned that scale inefficiency might confound the measure of technical efficiency.
The CRS efficiency score represents technical efficiency, which measures inefficiencies due to input/output configuration and as well as size of operations. On the other hand, the VRS efficiency score represents pure technical efficiency, that is, a measure of efficiency without scale efficiency. It is thus possible to decompose TE into PTE and SE. Scale efficiency can be calcu-lated by dividing PTE into TE. The graphical derivation of this relationship can be found in Coelli et al. [42].
Once the VRS is established and SE scores computed, the analysis can be taken a step further. This involves determining whether a particular DMU is experiencing increasing or decreasing returns to scale. To make this assessment, DEA is repeated with non-increasing returns to scale (NIRS) and efficiency scores compared. It should be noted that, by definition, NIRS implies CRS or DRS. So, if the score for a particular DMU under VRSequalsthe NIRS score, then that DMU must be operating under DRS. On the other hand, if the score under VRS isnot equalto the NIRS score, then the DMU is operating under IRS [42]. The procedure just described is automated in the DEA software DEAP where the test output identifies the returns to scale of each DMU.
It is also possible to impose weight restrictions on inputs and outputs to reflect their perceived relative importances. For example, if university policy-makers regard postgraduate enrolments as more desirable than undergraduate enrolments, then appropriate constraints can be set up in the linear program. However, before imposing weight restrictions on the optimisation program, the analyst should look for evidence of a variable being either over- or under-represented in computation of efficiency scores. Furthermore, there is a caveat for using weight restrictions even in the presence of such evidence. That is, too many restricted variables will disrupt optimisation. In this study, no weight restrictions are imposed. Those interested in further discussion of weight restrictions are referred to Dyson et al. [46], Beasley [33], Boussofiane et al. [47], Allen et al. [48], and Thanassoulis and Allen [49].
3.3. Data and sample
Data for inputs and outputs identified in Tables 1–3 were extracted from publications by the Department of Employment, Education, Training and Youth Affairs (DEETYA) for 1995. Selected Higher Education Statistics series and the report by Andrews et al. [50] were the main sources of data. (The latter report can be downloaded from www.deetya.gov.au.)
inputs and outputs [46]. However, DEA can be used with small sample sizes [51] and many such examples can be found in the literature (e.g. [5,52–54]). Another rule of thumb for selecting an appropriate sample size is to ensure that it is at least 3 times larger than the sum of the number of inputs and outputs [35].
It is also worth remembering that DEA provides meaningful results when it is applied to homogeneous samples. For example, DEA would not be an appropriate technique to compare the relative efficiencies of universities and secondary schools because their inputs and outputs would be significantly different.
4. Results and analysis
4.1. Initial results
This section begins by addressing the question of constant versus variable returns to scale. Correlating FTE academic staff (proxy for institutional size) with efficiency scores gives a coefficient ofÿ0.60 in model 1,ÿ0.74 in model 2, andÿ0.13 in model 3. The coefficients indicate that assuming CRS may not be appropriate. This is further probed by re-running the models with variable returns to scale. Comparing the two runs reveals different efficiency scores, thus confirming the presence of variable returns to scale among Australian universities. Hence, all the models in this study were tested under VRS. However, the downside of choosing VRS is a loss of discriminating power as evidenced by a rise in the number of efficient units.
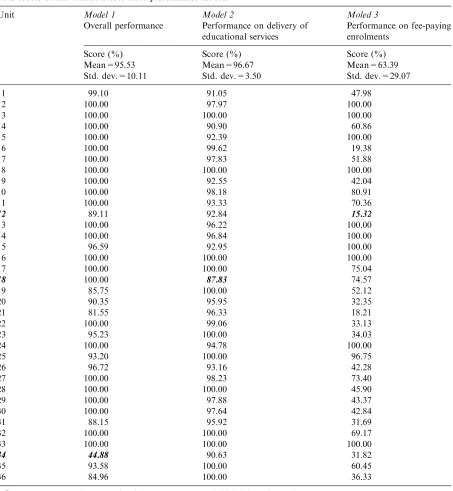
Results of our tests are summarised in Table 4. The mean score in models 1 and 2 are high. This can be interpreted as the higher education sector performing equally well when overall performance is compared with the efficiency of delivery of educational services. The high PTE also suggests a substantially scale-efficient sector. However, the lower mean and higher standard deviation of scores in model 3 confirm the poor performance of the sector on attracting fee-paying students. Thus, the greatest potential improvements lie in model 3. This is an expected finding given only the recent introduction of non-overseas fee-paying postgraduate enrolments.
Is there any evidence for the discriminatory power of the three performance models? Assuming models 2 and 3 are subsumed to model 1, we search for correspondence between efficient units. That is, a model that is efficient in model 2 or 3, is expected to be efficient in model 1 as well. Examination of Table 4 reveals that seven out of 12 efficient units in model 2 are also efficient in model 1. Similarly, nine out of 10 efficient units in model 3 are also efficient in model 1. These observations indicate a considerable level of discriminatory power. Tomkins and Green [32] also reported discriminating models in their study.
4.2. Potential improvements in efficiency
represents an over-utilised resource. The total potential improvements in the sample reported by the DEA software Frontier Analyst show input slacks of 1.34–5.26% (model 1), 19.73–36.51% (model 2) and negligible values for model 3. That is, overall slacks are small. As suggested by the
Table 4
VRS scores of universities across three performance modelsa
Unit Model 1 Model 2 Moled 3
Overall performance Performance on delivery of educational services
Performance on fee-paying enrolments
Score (%) Score (%) Score (%)
Mean=95.53 Mean=96.67 Mean=63.39
Std. dev.=10.11 Std. dev.=3.50 Std. dev.=29.07
1 99.10 91.05 47.98
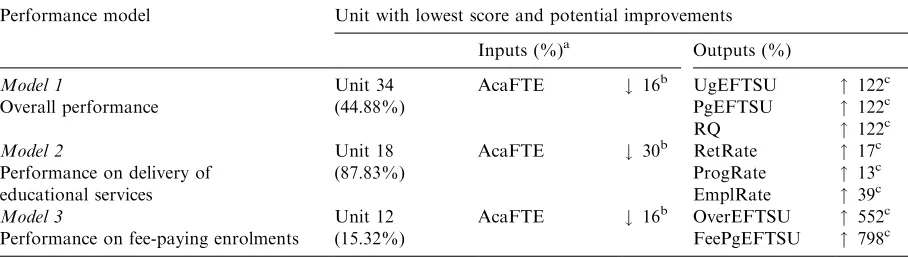
relatively low mean and high standard deviation of scores in model 3 (see Table 4), there is thus a potential to improve outputs by up to eight-fold in unit 12 (see Table 5).
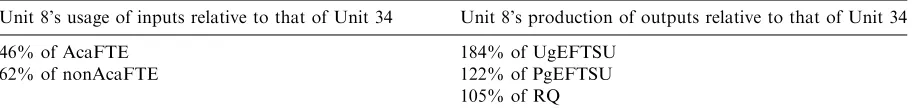
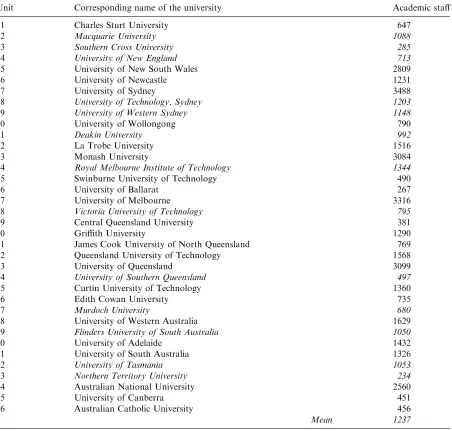
It is also possible to implement a more detailed reference comparison. This involves comparing an inefficient unit’s usage of inputs and production of outputs with those of one of the efficient units in its reference set (as part of benchmarking). When there is more than one efficient unit in the reference set, the unit that makes the largest contribution to computation of the inefficient unit’s score can be selected (i.e. unit with the largest peer weight or lambda). In the case of model 1, there are four peers in the reference set of the inefficient unit 34. These peers and their corresponding weights are 2(0.073), 5(0.308), 7(0.195) and 8(0.424). Expanding this example, inefficient unit 34 is compared to efficient unit 8. Test results reveal that efficient unit 8 uses less input to generate more output (see Table 6).
4.3. Decomposing technical efficiency
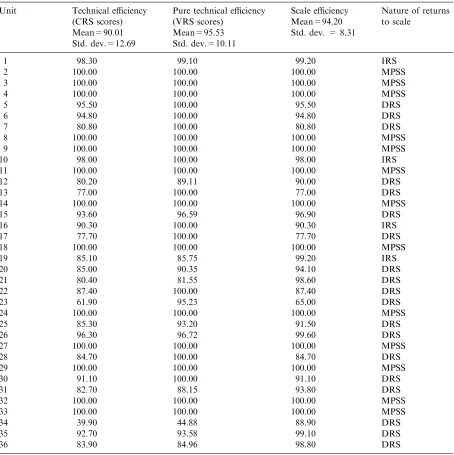
The technical efficiency scores for model 1 are decomposed into PTE and SE, and the nature of returns to scale reported by the software program DEAP are reproduced in Table 7. Thirteen universities were operating at MPSS, four at IRS, and the remaining 19 at DRS. With DRS, an increase in inputs leads to a less than proportionate increase in outputs [8]. This implies that, as per 1995 data, universities operating at DRS had grown larger than their most productive scale size and could consider downsizing, albeit by small amounts. In Table 8, it can be seen that 14 of the 19 DRS universities are above average in size, where the full-time equivalence academic staff is a proxy for measuring size. On the other hand, the average size of the MPSS universities is about 852 FTE academic staff, which is below the sector average. Amongst the 23 scale-inefficient universities, 13 were also inefficient on pure technical efficiency. It should be noted that, in general, it is easier to reduce technical inefficiency than it is to reduce scale inefficiency. Only when a DMU becomes technically efficient does it make sense to deal with scale inefficiency.
Table 5
Potential improvements for universities with the lowest VRS scores
Performance model Unit with lowest score and potential improvements Inputs (%)a Outputs (%)
These represent input slacks (overutilised inputs) since DEA tests are run under output maximisation. b#
Input can be lowered. c
5. Managerial implications
5.1. Key findings
The main objective of this study was to apply DEA in examining the relative efficiency of Australian universities. The findings indicate that Australian universities are already operating at respectable levels of technical and scale efficiency. The three performance models developed and tested on data available for 36 universities were able to discriminate between efficient and inefficient institutions. The greatest potential improvements were in raising outputs such as fee-paying postgraduate enrolments, reflecting the scope for further development in this relatively new revenue-raising activity. There were also small slacks in input utilisation, which can be addressed by university administrators without too much difficulty.
Based on performance model 1, a small number of universities were operating at IRS, about one-third at MPSS, and the remaining majority at DRS. Eleven of the 19 DRS universities were also found technically inefficient. This suggests that managers should focus first on removing the technical inefficiency of these universities before addressing ways to restructure the scale of operations. Nevertheless, the number of DRS universities in the sample and an average scale efficiency of 94.20% (model 1) suggest a small potential to downsize the sector.
Decomposing technical efficiency scores into pure technical efficiency and scale efficiency provides guidance on what can be achieved in the short- and long term. For example, if the majority of inefficiency is due to the small size of operations, that is, increasing returns to scale, then that DMU will need to plan for expansion. While this exercise can be accelerated through in-market mergers in the case of profit-making organisations, it is a more cumbersome process for universities, which normally have to proceed through a lengthy consultation process with the Federal and State governments. On the other hand, pure technical inefficiency can usually be addressed in the short term without changing the scale of operations. The observation that 19 Australian universities were operating at DRS in 1995 may be an indication of counter-productive university amalgamations implemented in the early 1990s. However, this contention remains untested until pre-amalgamation data are analysed.
Collection and classification of research related data merit special comment. While there may be some disagreement on the classification of research income as an input, it is theoretically appropriate since it represents a resource rather than a research outcome. Research outcome (output) can be in the form of a rating, or number of publications, or money indexed to number of
Table 6
Reference comparison of input usage and output production between unit 8 (efficient) and unit 34 (inefficient) in model 1
Unit 8’s usage of inputs relative to that of Unit 34 Unit 8’s production of outputs relative to that of Unit 34
46% of AcaFTE 184% of UgEFTSU
62% of nonAcaFTE 122% of PgEFTSU
publications that eventually finds its way back to the university. Of course, when the focus of efficiency analysis shifts from production of research to a purely financial outlook, then it is quite acceptable to list research income as an output.
Table 7
Decomposed technical efficiency scores and nature of returns to scale (model 1)a Unit Technical efficiency
Mean=90.01 Mean=95.53 Std. dev. = 8.31 Std. dev.=12.69 Std. dev.=10.11
There are also potential problems in collecting data on research income and research outcome. The long and variable lead times between receipt of research income and publications means one cannot easily put together corresponding data for a particular year. In Australia, an additional difficulty has been the unreliable nature of refereed publications reported by universities. Independent audits by the consulting firm KPMG over the last 2 years have revealed mistakes in classification and counting of publications, raising the question about whether research outcomes can be satisfactorily quantified.
In this article, Research Quantum was used as an output in recognition of its importance in university life. However, the reader is warned that DEA results are bound to be distorted in some unquantifiable way when the integrity of data has been partially violated. Nevertheless, such issues should not detract from the value of the current study. This is the case since its purpose has already been established as demonstrating the use of DEA when examining the relative efficiency of universities rather than seeking a rank ordering.
5.2. Potential use and limitations of DEA
The DEA process outlined in this study can help public policy-makers and university executives allocate scarce resources and provide direction for improvement of productivity. In an atmosphere of increasing public accountability, universities can no longer afford to overlook scientific techniques that can assist in analysis of efficiency and performance. In the absence of market mechanisms to price educational outputs, which renders traditional production or cost functions inappropriate, universities are particularly obliged to seek alternative efficiency analysis methods. DEA provides such a method.
DEA helps in identifying peer groups for inefficient DMUs and objectively determines the productivity improvements. As such, it can be a valuable benchmarking tool for management. A less tangible benefit of using DEA is that management must identify the key inputs/outputs of the organisation where they may not have pursued such a specific line of inquiry in the past. Organisations that are familiar with the balanced scorecard system of integrating financial measures with non-financial operational measures will find DEA a natural extension of such activities. Clearly, once the key inputs/outputs are identified, it is essential to ensure the integrity of data if DEA results are to be used with confidence.
As more consistent and reliable data become available, DEA can be used in longitudinal studies to observe which DMUs are efficient over time. Window analysis can be carried out to assess the stability of relative efficiency scores (see [16,37,55]). In such an exercise, large changes should be investigated with care. Another advantage of a longitudinal study is the ability to discover whether data contain a significant random component. This is important since one of the principal tenets of traditional DEA is that data are free of statistical noise. It would also be a worthwhile exercise to probe longitudinal data for evidence of changes to scale efficiency. The reliability of DEA could be enhanced by following standardised accounting and reporting practices, as well as regular audits [12].
outputs to be influenced by entry qualifications. Unfortunately, existing university admission systems are not uniform across different states of Australia, making it nearly impossible to gather consistent and reliable data on undergraduate entry qualifications.
Like most other techniques, DEA has its limitations. While DEA can be used to set targets for improvement of desired outputs, it does not instruct the user on how to reach those targets. DEA’s main application as a managerial decision-making tool should be one of testing established knowledge and initiating an investigation when a significant contradiction arises. For example, in Table 5, one of the potential improvements suggested for unit 12 (in model 3) was to raise the overseas fee-paying student enrolment by 552%. Before such an exercise can be undertaken, it would be essential to investigate what sort of organisational or environmental factors may be obstructing the manifestation of relevant inputs as outputs. In such a scenario, the management of unit 12 would need to closely examine the configuration of efficient units in its reference set.
5.3. Conclusion
While universities are, more than ever, being evaluated on quantifiable inputs and outputs, higher education still retains certain key characteristics that set it apart from other types of organisations. These key characteristics are ‘‘the lack of profit motive, goal diversity and uncertainty, diffuse decision making, and poorly understood production technology’’ [29, p. 176]. Lindsay’s 18-year-old comments maintain most of their currency today. It is this nature of higher education that continues to complicate selecting inputs/outputs and undertaking inter-institutional comparisons that satisfy all parties.
Nevertheless, application of DEA provides an avenue to explore the efficiency of converting multiple inputs into multiple outputs in higher education. We conclude this article by presenting an application checklist for the benefit of those who are keen to implement data envelopment analysis:
1. Define the decision-making unit to be studied e.g. university, department, program, etc. How many of these units are there?
2. Identify the drivers (outputs) critical to the success of the decision-making unit.
3. Identify the key resources (inputs) that support the key drivers. Here, a process analysis can provide direction.
4. Are data on the key outputs/inputs collected in a regular and consistent manner?
5. Is there a particular aspect that you would like to analyse in terms of the unit’s efficiency? For example, overall efficiency, service volume, service quality, and so on.
6. Are you interested in output maximisationor input minimisationas the main objective? 7. Run the DEA calculations and determine the units reported as inefficient.
8. Are the units reported as inefficient consistently so over time? Here, window analysis is recommended.
9. Are inefficient units measured as efficient when analysed under different methods? If so, determine why. For example, see whether environmental factors have been adequately considered.
11. Identify potential improvements for the inefficient units as well as their corresponding reference sets.
12. Are there constraints to implementation of the potential improvements? To answer this, re-visit the outputs and inputs studied.
Appendix A
A.1. A quick introduction to the mathematics of DEA
Productivity is defined as the ratio of the weighted sum of outputs to the weighted sum of inputs. Mathematically, the relative efficiency of a DMU can be written as follows:
h0¼
Ps
r¼1uryr0
Pm i¼1vixi0
, ðA:1Þ
wheresis the numbre of outputs;ur the weight of outputr; yr0the amount of output rproduced
by the DMU;mthe number of inputs;vi the weight of inputi; andxi0the amount of inputiused
by the DMU.
Eq. (A.1) assumes constant returns to scale and controllable inputs. While outputs and inputs can be measured and entered in this equation without standardisation, determining a common set of weights can be difficult. DMUs might value outputs and inputs quite differently. The CCR model addresses this concern.
A.2. CCR model
Charnes et al. [56] addressed the above problem by permitting a DMU to adopt a set of weights that will maximise its productivity ratio without this ratio exceeding 1.0 for other DMUs. Introducing this constraint converts the productivity ratio into a measure of relative efficiency. Thus, Eq. (A.1) is re-written in the form of a fractional programming problem.
maxh0¼
Ps r¼1uryr0
Pm i¼1vixi0
ðA:2Þ
subject to
Ps r¼1uryrj Pm
i¼1vixij
1 for each DMU in the sample; wherej¼1;. . .; nðnumber of DMUsÞ:
Eq. (A.2) is the ratio form of DEA. However, it has an infinite number of solutions. To avoid this problem, Eq. (A.2) is converted into the more familiar components of a linear programming problem. In Eq. (A.3) (the multiplier form), the denominator is set to a constant and the numerator is maximised.
maxh0¼
Xs
r¼1
subject to
To prevent the mathematical omission of an output or an input in the iterative calculation of efficiency, weightsuand vare not allowed to fall below non-zero small positive numbers (e). Eq. (A.3) uses controllable inputs and constant returns to scale. It is a primal linear programming problem that models input minimisation.
A.3. BCC model
Banker et al. [57] addressed variable returns to scale. They introduced a new variable in the CCR model that separates scale efficiency from technical efficiency. The BCC primal linear programming problem that measures pure technical efficiency is depicted in Eq. (A.4).
maxh0¼
A.4. BCC model with uncontrollable inputs
The variable returns to scale model that incorporates the effect of non-discretionary inputs can be read in Banker and Morey [58]. It is probably the most useful model for evaluating the relative efficiency of organisational units in the business world. It acknowledges that DMUs may not be operating at MPSS and that some of the inputs (or outputs) may well be outside the control of the manager. Under such circumstances, it does not make sense to talk about reducing all the inputs. Potential improvements should be calculated only for the controllable or discretionary inputs. Eq. (A.5) shows a general model that assumes input contraction.
maxh0¼
wheresis the number of outputs;ur the weight of outputr; yr0the amount of output rproduced
by the DMU under evaluation;mthe number of controllable inputs;vi the weight of controllable
inputs;wj the weight of uncontrollable inputj; andzj0the amount of uncontrollable inputj used
by the DMU.
A graphical demonstration of DEA mathematics can be followed in Norman and Stoker [59].
Appendix B
Table 8
Legend for units in the study sample and FTE academic staff as an indication of unit sizea
Unit Corresponding name of the university Academic staff
1 Charles Sturt University 647
2 Macquarie University 1088
3 Southern Cross University 285
4 University of New England 713
5 University of New South Wales 2809
6 University of Newcastle 1231
7 University of Sydney 3488
8 University of Technology, Sydney 1203
9 University of Western Sydney 1148
10 University of Wollongong 790
11 Deakin University 992
12 La Trobe University 1516
13 Monash University 3084
14 Royal Melbourne Institute of Technology 1344
15 Swinburne University of Technology 490
16 University of Ballarat 267
17 University of Melbourne 3316
18 Victoria University of Technology 795
19 Central Queensland University 381
20 Griffith University 1290
21 James Cook University of North Queensland 769
22 Queensland University of Technology 1568
23 University of Queensland 3099
24 University of Southern Queensland 497
25 Curtin University of Technology 1360
26 Edith Cowan University 735
27 Murdoch University 680
28 University of Western Australia 1629
29 Flinders University of South Australia 1050
30 University of Adelaide 1432
31 University of South Australia 1326
32 University of Tasmania 1053
33 Northern Territory University 234
34 Australian National University 2560
35 University of Canberra 451
36 Australian Catholic University 456
Mean 1237
References
[1] Birch S, Maynard A. Performance indicators and performance assessment in the UK national health service: implications for management and planning. International Journal of Health Management 1986;1:143–56. [2] Barrow M, Wagstaff A. Efficiency measurement in the public sector: an appraisal. Fiscal Studies 1989;10(1):72–97. [3] Oral M, Kettani O, Yolalan R. An empirical study on analysing the productivity of bank branches. IIE
Transactions 1992;24(5):166–76.
[4] Al-Faraj TN, Alidi AS, Bu-Bhsait KA. Evaluation of bank branches by means of data envelopment analysis. International Journal of Operations and Production Management 1993;13(9):45–52.
[5] Haag SE, Jaska PV. Interpreting inefficiency ratings: an application of bank branch operating efficiencies. Managerial Decision Economics 1995;16(1):7–14.
[6] Johnes J, Johnes G. Research funding and performance in U.K. university departments of economics: a frontier analysis. European Economics Review 1995;14(3):301–14.
[7] Banker RD, Thrall RM. Estimation of returns to scale using data envelopment analysis. European Journal of Operations Research 1992;62:74–84.
[8] Banker RD. Estimating most productive scale size using data envelopment analysis. European Journal of Operations Research 1984;17:35–44.
[9] Sherman HD. Service organization productivity management. The Society of Management Accountants of Canada, Hamilton, Ontario, 1988.
[10] Farrell MJ. The measurement of royal statistical society. Journal of the Royal Statistical Society Part 3 1957;120:253–90.
[11] Charnes A, Cooper WW, Rhodes E. Evaluating program and managerial efficiency: an application of data envelopment analysis to program follow through. Management Science 1981;27(6):668–97.
[12] Nunamaker TR. Using data envelopment analysis to measure the efficiency of non-profit organizations: a critical evaluation. Managerial Decision Economics 1985;6(1):50–8.
[13] Bessent A, Bessent W. Determining the comparative efficiency of schools through data envelopment analysis. Educational and administrative Quarterly 1980;16(2):57–75.
[14] Sherman HD. measurement of hospital efficiency using data envelopment analysis. Doctoral dissertation, Harvard University, Dissertation Abstracts International 42(8), 3731A, University Microfilms No. 8202819, 1981. [15] Lewin AY, Morey RC, Cook TJ. Evaluating the administrative efficiency of courts. Omega-International Journal
1982;10:401–11.
[16] Charnes A, Clark CT, Cooper WW, Golany B. A developmental study of data envelopment analysis in measuring the efficiency of maintenance units in the US air forces. Annals of Operations Research 1985;2:95–112.
[17] Thanassoulis E, Dyson RG, Foster MJ. Relative efficiency assessment using data envelopment analysis: an application to data on rates departments. Journal of the Operations Research Society. 1987;38(5):397–411. [18] Sherman HD, Ladino G. Managing bank productivity using data envelopment analysis (DEA). Interfaces
1995;25(2):60–73.
[19] Charnes A, Cooper WW, Lewin AY, Seiford LM. Data envelopment analysis: theory, methodology and application. Boston: Kluwer Academic Publishers, 1994.
[20] Burley HT. Data envelopment analysis in ranking educational processes. In: McNaught C, Beattle K, editors. Research into higher education: dilemmas, directions and diversions. Victoria: Herdsa, 1995. p. 19–27.
[21] Mester LJ. A study of bank efficiency taking into account risk-preferences. Journal of Banking Finance 1996;20(6):1025–45.
[22] Drake L, Howcroft B. Relative efficiency in the branch network of a UK bank: an empirical study. Omega-International Journal 1994;22(1):83–90.
[23] Li SX. Stochastic models and variable returns to scales in data envelopment analysis. European Journal of Operations Research. 1998;104(3):532–48.
[24] Sengupta JK. New efficiency theory: extensions and new applications of data envelopment analysis. International Journal of Systems 1998;29(3):255–65.
[26] Cave M, Hanney S, Kogan M. The use of performance indicators in higher education: a critical analysis of developing practice. London: Jessica Kingsley Publishers, 1991.
[27] Johnes G. Research performance indications in the university sector. Higher Education Quarterly 1988;42(1): 54–71.
[28] Thomas JA. The productive school: a system analysis approach to educational administration. New York: Wiley, 1974.
[29] Lindsay AW. Institutional performance in higher education: the efficiency dimension. Review of Educational Research 1982;52(2):175–99.
[30] Anderson L, Walberg HJ. Data envelopment analysis. In: Keeves JP, editor. Educational research, methodo-logy, and measurement: an international handbook. Adelaide: Flinders University of South Australia, 1997. p. 498–503.
[31] Bessent AM, Bessent EW, Charnes A, Cooper WW, Thorogood NC. Evaluation of educational program proposals by means of DEA. Educational and Administrative Quarterly 1983;19(2):82–107.
[32] Tomkins C, Green R. An experiment in the use of data envelopment analysis for evaluating the efficiency of UK university departments of accounting. Financial Accountability and Management. 1988;4(2):147–64.
[33] Beasley JE. Comparing university departments. Omega-International Journal 1990;18(2):171–83.
[34] Johnes G, Johnes J. Measuring the research performance of UK economics departments: an application of data envelopment analysis. Oxford Economic Papers 1993;45:332–47.
[35] Stern ZS, Mehrez A, Barboy A. Academic departments efficiency via DEA. Computers and Operations Research 1994;21(5):543–56.
[36] Beasley JE. Determining teaching and research efficiencies. Journal of the Operations Research Society 1995;46(4):441–52.
[37] Ahn T, Arnold V, Charnes A, Cooper WW. DEA and ratio efficiency analyses for public institutions of higher learning in Texas. Research in Governmental and Nonprofit Accounting 1989;5:165–85.
[38] Ahn T, Charnes A, Cooper WW. Some statistical and DEA evaluations of relative efficiencies of public and private institutions of higher learning. Socio-Economic Planning Sciences 1988;22(6):259–69.
[39] Ahn T, Seiford LM. Sensitivity of DEA models and variable sets in a hypothesis test setting: the efficiency of university operations. In: Ijiri Y, editor. Creative and innovative approaches to the science of management. Wesport CT: Quorum Books, 1993. p. 191–208.
[40] Ahn T. Efficiency and related issues in higher education: a data envelopment analysis approach. Doctoral dissertation, The University of Texas at Austin, 1987.
[41] Breu TM, Raab RL. Efficiency and perceived quality of the nation’s top 25 national universities and national liberal arts colleges: an application of data envelopment analysis to higher education. Socio-Economic Planning Sciences 1994;28(1):33–45.
[42] Coelli T, Rao DSP, Battese GE. An introduction to efficiency and productivity analysis. Boston: Kluwer Academic Publishers, 1998.
[43] Coelli T. Assessing the performance of australian universities using data envelopment analysis. Centre for efficiency and productivity analysis, University of New England, NSW, 1996.
[44] Johnes J. Performance assessment in higher education in Britain. European Journal of Operations Research 1996;89:18–33.
[45] DEETYA. The composite index: allocation of the research quantum to Australian universities. Research Branch, Higher Education Division, Canberra, 1997.
[46] Dyson RG, Thanassoulis E, Boussofiane A. Data envelopment analysis. Warwick Business School, http:// www.csv.warwick.ac.uk/bsrlu/dea/deat/deat1.htm, 1998.
[47] Boussofiane A, Dyson RG, Thanassoulis E. Applied data envelopment analysis. European Journal of Operations Research. 1991;52:1–15.
[48] Allen R, Athanassopoulos A, Dyson RG, Thanassoulis E. Weights restrictions and value judgements in data envelopment analysis: evolution, development and future directions. Annals of Operations Research 1997;73: 13–34.
[50] Andrews L, Aungles P, Baker S, Sarris A. Characteristics and performance of higher education institutions (A preliminary investigation). Department of Employment, Education, Training and Youth Affairs, Canberra, 1998. [51] Evanoff DD, Israilevich PR. Productive efficiency in banking. Economic Perspectives 1991;15(4):11–32.
[52] Sherman HD, Gold F. Bank branch operating efficiency: evaluation with data envelopment analysis. Journal of Banking and Finance 1985;9:297–315.
[53] Parkan C. Measuring the efficiency of service operations: an application to bank branches. Engineering Costs and Production Economics 1987;12:237–42.
[54] Oral M, Yolalan R. An empirical study on measuring operating efficiency and profitability of bank branches. European Journal of Operations Research 1990;46(3):282–94.
[55] Yue P. Data envelopment analysis and commercial bank performance: a primer with applications to Missouri banks. Federal Reserve Bank of St. Louis Review 1992;74:31–45.
[56] Charnes A, Cooper WW, Rhodes E. Measuring the efficiency of decision making units. European Journal of Operations Research 1978;2:429–44.
[57] Banker RD, Charnes A, Cooper WW. Some models for estimating technical and scale inefficiencies in data envelopment analysis. Management Science 1984;30(9):1078–92.
[58] Banker RD, Morey RC. Efficiency analysis for exogenously fixed inputs and outputs. Operational Research 1986;34(4):513–21.