www.elsevier.com / locate / livprodsci
Test day models and genetic parameters in Latxa and
Manchega dairy ewes
a ,
*
b a c b´
´
M. Serrano
, E. Ugarte , J.J. Jurado , M.D. Perez-Guzman , A. Legarra
a˜
´ ´
Departamento de Mejora Genetica y Biotecnologıa, INIA,Carretera de La Coruna Km. 7, 28040 Madrid, Spain b
NEIKER A.B., Granja Modelo de Arkaute, Apdo. 46, 01080 Vitoria-Gasteiz, Spain c
˜
CERSYRA, Avda. del Vino 2, 13300 Valdepenas, Ciudad Real, Spain
Received 22 November 1999; received in revised form 30 March 2000; accepted 27 April 2000
Abstract
Test day (TD) milk yield and protein percentage models and genetic parameters estimation has been studied in Latxa and Manchega milk ewes. Genetic parameters for test day data were estimated under a multivariate animal model which considered production in successive test days in first lactation as different traits and under a univariate animal model considering milk and protein percentage test day as repeated measures of the same trait. Two contemporary groups (CG) were fitted, the classical herd-year-season of lambing (HYS) utilized with standardized lactation records and the herd-test day (HTD). In the multivariate approach, small differences in the variance component and genetic parameter estimates were obtained by fitting the HTD rather than the HYS effect. TD milk yield heritability estimates ranged from 0.20 to 0.33 and from 0.17 to 0.26 in Latxa and Manchega breeds, respectively. Residual variances and heritability estimates were also very similar for both models for protein percentage TD records (heritability ranged from 0.21 to 0.28). Genetic correlations were higher between adjacent TD records (from 0.87 to 0.97 for TD milk yields and from 0.61 to 0.99 for protein percentage TD records) than for records two or three TD apart (from 0.46 to 0.85 for TD milk yield and from 0.50 to 0.72 for protein percentage TD records), indicating that TDs could be affected by different genetic bases. In the univariate approach, the HTD model showed a lower residual variance and higher heritability estimates (0.20 and 0.21) than the HYS model (0.16 and 0.19) in both breeds and traits. TD heritability estimates under the univariate approach were lower than those of the multivariate approach for both CG and breeds. Permanent environmental variance was also affected by the CG included in the model. Higher repeatabilities were found in both breeds with the HTD model (0.35, 0.47 and 0.52) than with the HYS model (0.21, 0.37 and 0.40). How to consider TD measures within and among successive lactations and how to combine TD genetic values into a single animal breeding value are questions which need further investigation. 2001 Elsevier Science B.V. All rights reserved.
Keywords: Test day models; Genetic parameters; Dairy sheep
*Corresponding author. Tel.:134-191-347-6741; fax:134-191-357-2293.
E-mail address: [email protected] (M. Serrano).
1. Introduction systematic, environmental and genetic effects direct-ly, where they are expressed, on the day of record-In Latxa and Manchega Spanish dairy sheep, test ing.
day record (TD) collecting is carried out under the Effects that influence TD production are not International Rules for Milk Sheep Recording different from those that affect complete lactation (ICAR). Most records in both breeds are collected yield in general (Danell, 1990). Nevertheless, for TD monthly under an alternate morning / evening system measures there are differences from lactation records following ICAR rules. To standardize records to 120 and, therefore, different approaches have been used days, at least four TD per ewe are required, other- to consider environmental effects. Modeling the herd wise, in Manchega ewes, lactation is projected to 120 effect as herd-test day (HTD) instead of herd-year-days by extension factors developed previously season of parturition (HYS) leads to reduced residual (Serrano et al., 1996a). In Manchega, 16% of the variances (Ptak and Schaeffer, 1992, 1993). Includ-available lactation records lack the third and / or four ing new environmental effects, such as the stage of TD and need to be projected. When the first and / or lactation measured in number of days in milk, allows second TD records are missing, lactations are not a better estimation of environmental variability. projected and the records are discarded (3%). However, modeling TD records causes some
The goodness of the standardization (and projec- problems with respect to the contemporary group tion) procedure(s) depend(s) on the quality of milk (CG) definition, the treatment of within and among recording with regard to temporal aspects. TD re- parity information and the increase of computational cords are frequently collected at highly variable time demands due to the larger number of records to be periods due to animal management. This implies that managed.
estimation of standardized yields depends not only Various authors (Meyer et al., 1989; Ptak and on TD yield but also on the lactation stage of the Schaeffer, 1992, 1993; Stanton et al., 1992; Strabel animal from which test samples were collected. This and Szwaczkowski, 1995; Swalve, 1995; Rekaya, traditional approach of using lactation records has 1997) have suggested that models with HTD classes been criticized as inconsistent, since the aggregation are superior to HYS based on residual variances. of records taken at defined locations and time is However, the HTD model is rather problematic
rather trivial. regarding the size of the CG. In several studies
covar-iances among repeated records has been proposed yield and protein percentage TD records. Given the (Kirpatrick et al., 1994; Meyer and Hill, 1997) to large size of the data set available (94,191 lactation reduce the number of parameters to fit when there records and 70,207 pedigree records), several edits are many measures for each individual taken over were performed so that the data set was more time which are considered as different traits. manageable and a better correspondence between test In this study, a genetic evaluation model is defined day number and date of test was achieved. First TD and genetic parameters are obtained for TD milk between days 30 and 72 from parturition and time yield and protein percentage records in two different interval between successive tests of more than 25 Spanish dairy sheep breeds. Some considerations are days and less than 35 days were forced. In addition, made to develop the models. Firstly, since in dairy a minimum milk yield in each test of 200 ml and no ewes there are generally four TD records in a missing values for any TD were required. Identifica-lactation in contrast to the 10 in dairy cattle, compu- tion of dam and number of lambs born plus existence tational demands are much smaller and allow a of both milk and protein percentage records were multivariate approach within lactation. Secondly, also required. Finally, data were sampled by HYS dairy sheep herds have a larger average size than CG, discarding CG with less than six observations. dairy cattle herds, which partially avoids problems After these edits, 22,804 milk yield and protein
with HTD CG size. percentage TD records from 5701 first lactation ewes
of 32 herds were kept and used to estimate genetic parameters. The pedigree file consisted of 10,883
2. Material and methods animals.
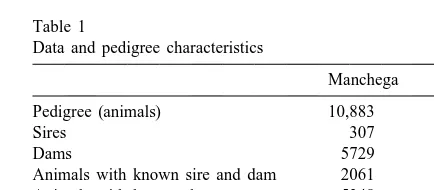
Table 1 shows data and pedigree characteristics
2.1. Data for both breeds. In the Manchega breed, there were
no missing values for any TD. However, in the Latxa Data for two Spanish dairy sheep breeds, Latxa records, missing values for the 3rd and 4th TDs were and Manchega, were available. These breeds are accepted. In the Latxa case, the sires included in the representative of two different regions of Spain. The pedigree file are artificial insemination (AI) and Latxa breed is located in the Basque Country, a wet natural mating males. In the Manchega breed, only region in the north of Spain. Manchega animals are AI males were included in the pedigree file. In the raised in a semiarid region of central Spain, the pedigrees, 23% of Latxa and 19% of Manchega Autonomous Community of Castilla-La Mancha. animals have a known sire and dam. The percentage TD records from one variety of Latxa dairy sheep of base animals was 31 and 32% for Latxa and (Blond-Faced) were collected between 1993 and Manchega breeds, respectively.
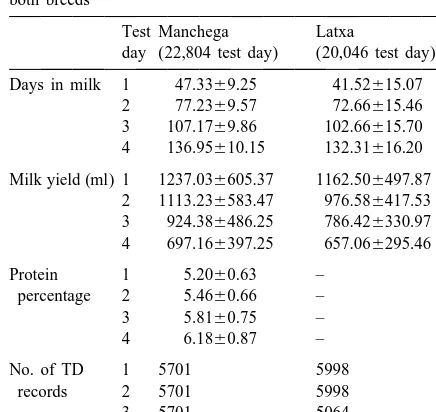
1998. Data consisted of 28,950 first lactation milk Means and standard deviations for TD milk yield yield records. Some restrictions were applied to and protein percentage records, days in milk and achieve the final data set. A minimum milk yield in number of TD considered are presented in Table 2 the 1st and 2nd TDs of 200 ml and in the 3rd and 4th for each breed.
TDs of 100 ml plus identification of number of lambs born were required. First TD between days 10
Table 1 and 72 from parturition and time interval between
Data and pedigree characteristics successive TD of more than 20 and less than 40 days
Manchega Latxa were forced. Missing values for the 2nd, 3rd and 4th
TD were accepted. After these edits, 20,046 milk Pedigree (animals) 10,883 10,192
yield TD records from 5998 first lactation ewes of 40 Sires 307 212
Dams 5729 4766
herds were available and used for variance
com-Animals with known sire and dam 2061 2373 ponent estimation. The pedigree file consisted of
Animals with known dam 5348 4595
10,192 animals. Animals with unknown sire and dam 3474 3224
Data for the Manchega breed were collected
Data (TD records) 22,804 20,046
Table 2 equations of the animal models applied in each case Raw means and standard deviations of test day milk yields (ml), were the following.
protein percentage, days in milk and number of TD considered for
Multivariate
4 136.95610.15 132.31616.20 1b(dim )ln 1gmn1´ijklmn
Milk yield (ml) 1 1237.036605.37 1162.506497.87
Protein 1 5.2060.63 – l m m ijklmn
percentage 2 5.4660.66 –
records 2 5701 5998 where y is the nth test day milk yield or protein ijklmn
3 5701 5064
percentage record within lactation for the ith CG
4 5701 2986
(HYS or HTD) of the mth ewe of age k at lambing (age) with jth number of lambs born (nlb) and in the
lth lactation stage measured in days in milk (dim) on
2.2. Statistical analysis the nth TD; m is the population mean; HYSin is the fixed effect herd-year-season of parturition on the Variance components estimation was carried out nth TD (213 levels in Latxa and 193 levels in
by DFREML using VCE 4.2.5 software (Groeneveld Manchega); HTDin is the fixed effect
herd-year-´ ´
and Garcıa Cortes, 1998). Alternative animal models month of TD on the nth TD (659, 667, 538 and 370 were used to compare different CG definition and levels for the 1st, 2nd, 3rd and 4th Latxa TD, trait treatment. The analysis was developed for two respectively, and 239 levels for all TDs in Manchega traits: TD milk yield in both breeds and protein under the multivariate model, and 974 levels in percentage only in Manchega breed. Latxa and 692 levels in Manchega in the univariate Models were based on several studies in which TD approach); nlb is the fixed effect number of lambsj traits in dairy sheep were involved (Baro et al., 1994; born (two levels in both breeds); age is the fixedk El-Saied et al., 1998; Serrano et al., 1998). Age at effect age at lambing (four levels in both breeds); parturition, number of lambs born, days in milk and b(dim ) is the days in milk on the nth TD as aln several CG combinations were the fixed effects more covariate, b is the linear regression coefficient of y commonly used in these works. All these effects on dim; gmn is the additive genetic effect for the mth were highly significant and were therefore included animal on the nth TD; pm is the permanent en-in the evaluation models. vironmental effect for the mth animal (5998 levels in First analyses, considering TD as different traits, Latxa and 5701 levels in Manchega); and ´ijklmn is were carried out under multivariate animal models the residual.
two or more lambs born for both breeds. Age at Latxa and smaller (|100 ml) for the 1st and 4th TD. lambing was defined as a four class fixed effect. In TD protein percentage showed an opposite trend to Latxa ewes, classes were defined in years (1, 2, 3 that observed for TD milk yield. There was an and 4 or more years). In the Manchega breed, these increase of protein percentage from the 1st to the 4th four classes were considered in months (#15, 16– test day records (approximately 1%). Similar trends 17, 18–20 and $20 months). of milk yield and protein percentage along lactation have been found in Churra ewes (Fuertes et al., 1998).
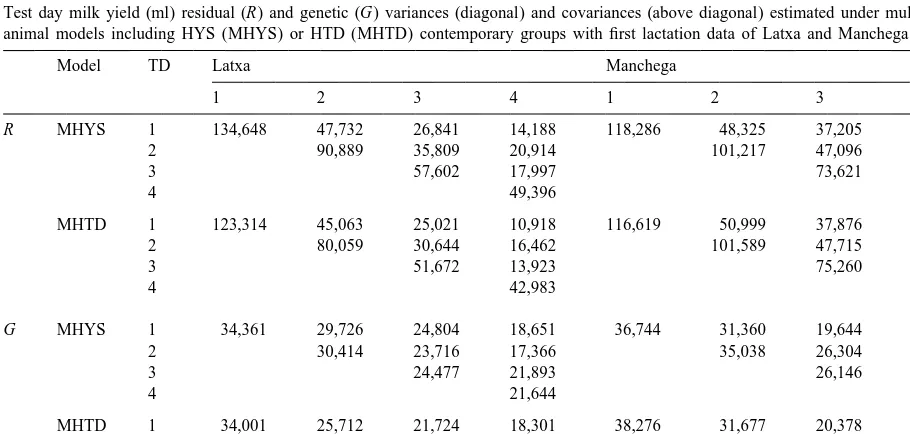
3. Results and discussion Variance component estimates (residual R and
additive genetic G) associated with the first lactation Average days in milk (DIM), milk yield and TD milk yields under multivariate animal models are protein percentage (only in Manchega breed) for shown in Table 3. In both data sets and breeds a each TD and breed in the first lactation data set are decrease of residual variance from the 1st to the 4th presented in Table 2. The average DIM at each TD TD was observed. This pattern is similar to that was larger in the Manchega breed. The standard found in cattle by Swalve (1995). The first TD had deviation of DIM was high in all TD for Latxa ewes, the highest residual variance estimate in both breeds due to the less strict criteria used to define the and models. Differences were more evident in Latxa intervals between TD. Average TD milk yields in the data. Uncontrolled environmental factors seem more Manchega breed were always higher than in the likely to occur at the onset of lactation and might be Latxa breed, due to differences in lactation stage at a possible explanation for this observed trend. the time of collection. These differences were higher In the Latxa breed, residual variances estimated for the 2nd and 3rd TD (140 ml) than for the 1st and under the MHTD model were smaller than those 4th TD (75 and 40 ml, respectively). Standard estimated with the MHYS model. This indicates, as deviations for the 2nd and 3rd TD milk yields in the expected, that more environmental variation is re-Manchega breed were 160 ml larger than those for moved by considering comparisons of animals within
Table 3
Test day milk yield (ml) residual (R) and genetic (G) variances (diagonal) and covariances (above diagonal) estimated under multivariate animal models including HYS (MHYS) or HTD (MHTD) contemporary groups with first lactation data of Latxa and Manchega ewes
Model TD Latxa Manchega
1 2 3 4 1 2 3 4
R MHYS 1 134,648 47,732 26,841 14,188 118,286 48,325 37,205 28,219
2 90,889 35,809 20,914 101,217 47,096 36,299
3 57,602 17,997 73,621 38,828
4 49,396 60,737
MHTD 1 123,314 45,063 25,021 10,918 116,619 50,999 37,876 27,258
2 80,059 30,644 16,462 101,589 47,715 35,200
3 51,672 13,923 75,260 37,998
4 42,983 59,700
G MHYS 1 34,361 29,726 24,804 18,651 36,744 31,360 19,644 9884
2 30,414 23,716 17,366 35,038 26,304 15,472
3 24,477 21,893 26,146 16,338
4 21,644 12,470
MHTD 1 34,001 25,712 21,724 18,301 38,276 31,677 20,378 12,149
2 24,066 19,836 17,347 33,056 26,451 17,452
3 20,263 20,360 24,563 17,424
the day on which the record is made than by In the Latxa breed, the TD milk yield genetic comparing animals at the same period of parturition variance estimates were higher under the MHYS (Rekaya et al., 1999). However, in the Manchega model than under the MHTD model, these differ-breed, the differences in residual variances between ences being more evident for the second and third alternative models were not so clear. The first and TDs. Only the fourth TD showed a smaller genetic fourth TDs showed smaller residual variances under variance. In the Manchega breed, the 2nd and 3rd the HTD model, however these were higher for the TD records showed greater genetic variance esti-second and third TDs. In the Latxa breed, HYS CG mates with the HYS model. On the other hand, was widely spread over 5 months of the lambing higher genetic variance estimates were found for the period (two lambing periods in the year: September– 1st and 4th TD records under the HTD model. In December and January–June). However, in Man- general, higher genetic variance estimates were chega ewes, parturition season was defined in obtained in the Manchega than in the Latxa breed. months over the year. In the first case, the MHTD Genetic covariance estimates, as for the residual model captured environmental variation that was not ones, were higher between adjacent TD records. In accounted for by the MHYS model. In Manchega, the Latxa breed, these values were higher for the the MHTD model did not show the same advantage, MHYS model than for the MHTD model. In the because of the greater similarity between the CG, Manchega breed, the opposite trend was observed. HYS and HTD definitions. Thus HTD models seem Higher genetic covariances were estimated under the to decrease residual variances in relation to HYS MHTD model than under the MHYS model. models, depending on the definition of HYS CG. Although at the level of variance component
Table 4 estimates was observed. Residual variances increased Residual and genetic variances (diagonal) and covariances (above along lactation, except for the 2nd TD, which diagonal) test day protein percentage, estimated under multivariate
showed the lowest residual variance for both models. animal models including HYS (MHYS) and HTD (MHTD)
Additive genetic variance presented the same pattern, contemporary groups with first lactation data of Manchega ewes
increasing from the 1st to the 4th TD. Model TD Manchega
In this case, as expected, MHYS residual vari-1 2 3 4 ances were slightly higher than those of MHTD for
Residual MHYS 1 0.212 0.064 0.039 0.025 all TD records. Genetic variances showed an oppo-2 0.180 0.054 0.041 site trend. Slightly higher values were obtained for
3 0.266 0.114
the MHTD model than for the MHYS model. Using
4 0.356
the HTD effect seems to enhance the detection of MHTD 1 0.205 0.058 0.036 0.026 differences among animals at the environmental
2 0.175 0.054 0.043
level, but not at the genetic level for this trait.
3 0.256 0.113
Residual covariances had similar trends as those
4 0.350
observed for TD milk yield records. Higher values Genetic MHYS 1 0.058 0.040 0.044 0.041 were found for adjacent TD records. However, 2 0.072 0.080 0.067 genetic covariance estimates showed different
be-3 0.089 0.075
havior. Genetic covariances among the 1st and other
4 0.118
TDs tended to be smaller than those estimated MHTD 1 0.058 0.045 0.047 0.043
between the 2nd and 3rd, 2nd and 4th and 3rd and
2 0.074 0.081 0.065
4th TDs.
3 0.092 0.076
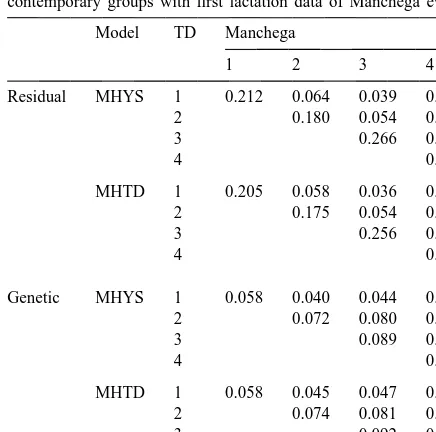
Heritabilities and genetic correlations among TD
4 0.113
milk yield and TD protein percentage (only in Manchega breed) records for both breeds using estimation seems to be affected when a HYS or a alternative MHYS and MHTD models are shown in HTD CG is fitted. Models with HTD CG showed Table 5. Standard deviations ranged from 0.01 to smaller residual variances in most cases. 0.09.
Table 4 shows TD protein percentage variance In the Latxa breed, no substantial differences in component estimates in the Manchega breed under genetic parameter estimates were observed between the two models considered, MHYS and MHTD. An alternative models. Similar heritability and genetic opposite trend to that of TD milk yield variance correlations were found with the MHYS and MHTD
Table 5
2
Test day milk yield (ml) and protein percentage genetic parameters: heritability (h ) at diagonal and genetic correlations above diagonal (r )g estimated under multivariate animal models including HYS (MHYS) and HTD (MHTD) contemporary groups with first lactation data of
a Latxa and Manchega ewes
Model TD Latxa Manchega
Milk yield (ml) Milk yield (ml) Protein percentage
1 2 3 4 1 2 3 4 1 2 3 4
models. The first TD milk yield record showed the decreasing to 0.66 when records were three TD lowest heritability value in both cases, due to the apart. In Manchega, genetic correlations between higher residual variance, which agrees with several adjacent TD took values of 0.87, decreasing to 0.46 results in cattle (Meyer et al., 1989; Wiggans and when records were three TD apart. Higher genetic Goddard, 1997; Vargas et al., 1998; Rekaya et al., correlations in Latxa could be due to the less strict 1999). These results confirm that there is more criteria used to consider TD intervals in this breed. variation not accounted for by the models in the In this case, the period between consecutive TD initial stage of lactation. As reported in cattle studies, records are more spread over time (20 to 40 days heritabilities were generally lower in early lactation required between successive TD) than those of (Danell, 1982; Wilmink, 1987). Heritability values Manchega records (25 to 35 days). Therefore, in the increased along lactation, the last (4th) TD being the Latxa breed, TD traits were mixed because the time one with the highest value (0.30 and 0.33 in MHYS interval for a TD trait was very long and thus genetic and MHTD models, respectively). The first and correlations were higher. Higher genetic correlations second TD records showed heritability values near among TD records were obtained by Barrillet and that estimated for standardized 120 day milk yield, Boichard (1994) with a sire model, concluding that 0.23 (Ugarte et al., 1996). However, the 3rd and 4th considering TD data as repeated measures of the TD heritability values were clearly higher than those same trait seems to be a reasonable hypothesis. In estimated for the 120 day milk yield. the present case, the results did not lead to the same Heritability values in the Manchega breed pre- conclusion. Also, our estimates were lower than sented some differences to those found in Latxa. In those obtained by Georgoudis et al. (1997) in a study this breed, heritability of the 1st, 2nd and 3rd TD with a single herd of Chios and Kymi sheep breeds, records showed similar values within and across which found genetic correlation values among TD models. In this case, the 4th TD presented the milk yield records ranging from 0.73 to 0.99. smallest heritability values, 0.17 and 0.18 in MHYS Heritability for protein percentage TD records in and HTD models, respectively, due the smaller the Manchega breed showed slightly higher values residual and genetic variances. Also, insubstantial with the MHTD model. For this trait, the first TD differences were observed among genetic parameter record presented the smallest heritability value in estimates under alternative models. These heritability both alternative models. All heritability values were estimates were smaller than those of the standardized clearly lower than estimated in this breed for the 120 day milk yield, 0.33 with REML (Serrano et al., standardized 120 day protein percentage, 0.35 with 1996b) and 0.28 with a Bayesian approach (Jurado et REML (Serrano et al., 1996b), and similar to the
al., 1997). estimate with a Bayesian approach, 0.29 (Jurado et
These results are in accordance with those ob- al., 1997). Also, Barrillet and Boichard (1994) found tained by Barrillet and Boichard (1994). These higher heritability for complete lactation (0.45) than authors found lower heritability estimates for TD for TD traits (0.35). Genetic correlations showed the milk yield (average 0.25) than for complete lactation same trend as for milk yield. Higher genetic correla-(0.30). Our TD heritability estimates were similar to tions were obtained between adjacent TDs than for those obtained by Georgoudis et al. (1997), which two or three TDs apart.
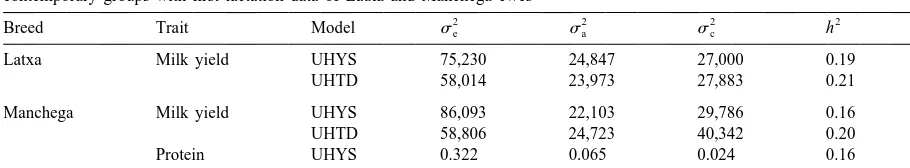
ranged from 0.19 to 0.26. However, these authors Table 6 shows variance components and genetic found lower heritability for commercial milk yield parameters (heritability and repeatability) estimated (0.16) than for TD traits. These estimates had large under alternative UHYS and UHTD univariate ani-standard errors, which ranged from 0.12 to 0.15. mal models considering TD milk yield and protein In both breeds and with the two models, genetic percentage (only in Manchega breed) records as correlations were always large between adjacent TD repeated measures of the same trait within first for milk yield. Generally, genetic correlations were lactation. Standard deviations of genetic parameters higher in the Latxa than in the Manchega breed ranged from 0.005 to 0.02.
Table 6
2 2 2
Test day milk yield (ml) and protein percentage residual (se), genetic (sa) and permanent environmental (sc) variances and genetic 2
parameters, heritability (h ) and repeatability (R) estimated under univariate animal models including HYS (UHYS) and HTD (UHTD) a
contemporary groups with first lactation data of Latxa and Manchega ewes
2 2 2 2
Breed Trait Model se sa sc h R
Latxa Milk yield UHYS 75,230 24,847 27,000 0.19 0.40
UHTD 58,014 23,973 27,883 0.21 0.47
Manchega Milk yield UHYS 86,093 22,103 29,786 0.16 0.37
UHTD 58,806 24,723 40,342 0.20 0.52
Protein UHYS 0.322 0.065 0.024 0.16 0.21
percentage UHTD 0.226 0.071 0.050 0.20 0.35
a
Standard deviations for heritability and C squared ranged from 0.005 to 0.02.
UHTD models were observed in the Latxa breed. In the case of protein percentage, TD records However, the estimated residual variance with the residual variances were lower in the UHTD model. UHTD model was smaller, as reported by Meyer et However, additive genetic and permanent environ-al. (1989). Heritability values were similar to those mental variances are greater in the UHTD model of the 1st TD in the multivariate analysis, 0.19 and than in the UHYS model. Heritability estimates were 0.21 for UHYS and UHTD, respectively. The re- similar to those obtained for TD milk yields, 0.16 peatability value was higher in the UHTD model and 0.20 for UHYS and UHTD respectively, and (0.47) than in the UHYS model (0.40), and superior smaller than values obtained in the multivariate to the estimate from a repeatability animal model approach.
along lactation (0.42) (Ugarte et al., 1996). In Churra ewes with a similar repeatability animal In Manchega data, changes in variance component model, Baro et al. (1994) found a heritability value estimates with UHYS and UHTD models were of 0.35 for test day milk yield. The inclusion of observed. Also in this case, the residual variance for natural mating and AI sires in the pedigree file the UHTD model was the lowest. However, perma- contributes to a better heritability estimation due to nent environmental variance showed a substantial more relationships being considered. However, increase from the UHYS to the UHTD model. In this heritability of protein percentage (0.13) was smaller case, there were large differences between different than values found in Manchega ewes. In Chios sheep models in heritability estimates. The UHTD model (Georgoudis et al., 1997), the heritability estimate showed a higher value of this parameter (0.20) than for the first four TD records in a repeatability animal that observed with the UHYS model (0.16). Both model was 0.28 and for the seventh TD record 0.17. heritability estimates were clearly smaller than those Repeatability estimates were 0.39 and 0.40 in each of the multivariate approach. Repeatability estimates case.
presented more differences across models than in the Under the univariate model, the CG size reduction case of Latxa. Repeatability was much higher in the had less impact. When a univariate approach is UHTD model than in the UHYS model in the considered by taking TD records as repeated mea-Manchega breed, 0.52 and 0.37, respectively. sures of the same trait within lactation, HTD CG Variance estimates were higher than those found includes all animals recorded on the same day by El-Saied et al. (1998) under a univariate TD independent of TD number. Thus HTD classes have model with HTD CG. Heritability and repeatability a larger size than in the multivariate approach. In values for TD milk yield were 0.14 and 0.44, Latxa, in the univariate TD approach, there were 8 respectively. In this case, HTD CG was not nested to and 33% of CG with less than six records when HYS TD number and multiple lactations were considered and HTD effects were fitted respectively. In Man-in the analysis. A sMan-ingle permanent environmental chega, 2% of CG groups had less than six records effect was fitted to account for TD repeated measures under the UHTD model.
found under the multivariate than under the uni- using a multiple trait approach and a method to variate approach, in both breeds, traits and models, combine all information in a single animal breeding could be due to a better adjustment of environmental value may be a reason to use a repeatability model effects in the first case. CG and regression coefficient instead. However, the pattern in genetic correlations in DIM were different effects for each TD in among different TD traits suggests that a multiple multivariate models, however in the univariate ap- trait approach is more accurate than the repeatability proach, these are the same effects for all TD records. model. The use of random regression models (RRM) Therefore, multivariate models might fit the data or covariance functions (CF) would also allow better and subsequently higher heritability values are acknowledgement of changes in the trajectory of
obtained. random effects (genetic and / or environmental) and
their associated (co)variances with time. However, the advantage of RRM or CF over the multi-trait
4. Conclusions approach in terms of goodness of fit and computing
demands might be questionable depending on the In this study it was observed that variance com- equation and number of parameters required by the ponent estimates were scarcely affected by the CG regression sub-model. Results from the multi-trait (HYS or HTD) used in the TD model under a analysis in this study might be used to fit reduced multivariate approach. At some stages, a decrease in order polynomials to obtain CF following the pro-residual variance from the MHYS to the MHTD cedure of Kirpatrick et al. (1994).
model was found. However, heritability estimates Another approach is to use heteroskedastic uni-were only slightly different across models. Under the variate models to account for variance differences univariate TD model approach, more advantages of among TD, which might fit the data better. This fitting HTD rather than HYS effects were observed. approach requires analysis of homoskesdascity to test In this case, residual variances and heritability if observed differences among TD variances are estimates were also affected. More studies on group- statistically significant.
ing HTD effects are necessary to account for the How to consider TD measures not only within, but small number of observations per group. Some also among, lactations is a question to be addressed authors (Van Bebber et al., 1997; Strabel and Szwac- in future studies. Studies with other lactations must zkowski, 1998) have reported clustering procedures be realized in order to decide how to consider TDs in to construct CG with an appropriate number of multiple lactations. If future results with multivariate
observations. models show differences among TDs within and
In general, higher heritability values were found among different lactations, we will be able to under the multivariate approach than under the evaluate more than 12 traits. In this case, the RRM univariate approach. In TD milk yield of Latxa and and CF approaches could be tested to reduce the TD protein percentage of Manchega, the 1st TD number of parameters to be estimated.
record showed smaller heritability estimates, indicat-ing that, in this period, some environmental variation
was not captured by the models. Genetic correlations Acknowledgements
were higher between adjacent TD milk yield and
protein percentage measures, but took lower values CERSYRA (Regional Centre of Selection and ˜
when records were two or three TD apart. Therefore, Artificial Insemination) of Valdepenas supplied the it does not seem reasonable to consider TD records data for the Manchega sheep breed and CONFELAC as the same trait along lactation but to treat them as the data for the Latxa sheep breed. This study was correlated traits. There is still a question to be supported by INIA (SC 96-060-C2) and CICYT answered about the adequacy of a multiple trait (AGF96-1408-C03-C2) projects. The authors also
a
] ´ ˜
Pander, N.L., Hill, W.G., Thompson, R., 1992. Genetic parameters
References
of test day records of British Holstein–Friesian heifers. Anim. Prod. 55, 11–21.
Baro, J.A., Carriedo, J.A., San Primitivo, F., 1994. Genetic
Ptak, E., Schaeffer, L.R., 1992. Use of test day yields for genetic parameters of test day measures for somatic cell count, milk
evaluation of dairy sires and cows. Livest. Prod. Sci. 34, yield and protein percentage of milking ewes. J. Dairy Sci. 77,
23–34. 2658–2662.
Ptak, E., Schaeffer, L.R., 1993. Use of test day yields as an Barrillet, F., Boichard, D., 1994. Use of first lactation test day data
alternative to 305 days yields. J. Dairy Sci. 75 (Suppl. 1), 251, for genetic evaluation of the Lacaune dairy sheep. In:
Proceed-abstract. ings of the 5th WCGALP, Guelph, pp. 111–114.
Reents, R., Dekkers, J.M.C., Schaeffer, L.R., 1995. Genetic Danell, B., 1982. Studies on lactation yield and individual test day
evaluation with a multiple lactation test day model for SCS and yields of Swedish dairy cows. Acta Agric. Scand. 32, 83–91.
production traits. In: Interbull Open Meeting, Praga, Bulletin Danell, B., 1990. Genetic aspects of different parts of lactation. In:
11. Proceedings of the 4th World Congress of General Applied
´ ´
Rekaya, R., 1997. Analisis Bayesiano de datos de produccion en Livestock Production, Edinburg, UK.
´ ´
los dıas del control para la seleccion de caracteres lecheros. El-Saied, U.M., Carriedo, J.A., De la Fuente, L.F., San Primitivo,
´
Tesis Doctoral, E.T.S.I.A., Univ. Politecnica de Madrid. F., 1998. Genetic and environmental estimation for test day and
˜
standardized milk yield of dairy sheep. Small Rumin. Res. 27, Rekaya, R., Carabano, M.J., Toro, M.A., 1999. Use of test day 209–215. yields for the genetic evaluation of production traits in Hols-Fuertes, J.A., Gonzalo, C., Carriedo, J.A., San Primitivo, F., 1998. tein–Friesian cattle. Livest. Prod. Sci. 57, 203–217.
Parameters of test day milk yield and milk components for Schaeffer, L.R., Dekkers, J.C.M., 1994. Random regression in dairy ewes. J. Dairy Sci. 81, 1300–1307. animal models for test day production in dairy cattle. In: Georgoudis, A.G., Gabriilidis, G.H., Papadopoulos, Th., 1997. Proceedings of the 5th World Congress on Genetics in Applied Prediction of the lactation yield in dairy sheep using a test-day Livestock Production, Guelph, Ontario, Canada, pp. 443–446. animal model, electronic identification of animals and auto- Schaeffer, L.R., Sullivan, B.P., 1994. Genetic evaluation of dairy
´ ´
mated data collection. Options Mediterraneennes, FAO- goats using test day yields. In: Proceedings of the 5th World CIHEAM-INRA Ser. A 33, 97–103. Congress on Genetics in Applied Livestock Production,
´ ´
Groeneveld, E., Garcıa Cortes, A., 1998. VCE 4.0 A (co)variance Guelph, Ontario, Canada, pp. 182–185.
´ ´
component package for frequentists and Bayesians. In: 6th Serrano, M., Jurado, J.J., Perez-Guzmam, M.D., Montoro, V.,
´ ´ ´
World Congress on Genetics Applied to Livestock Production, 1996a. Calculo de los factores de extension de la lactacion a
´ ´
Armidale, Australia. 120 dıas en ganado ovino manchego. Investigacion Agraria. ´
Jamrozik, J., Schaeffer, L.R., 1997. Estimates of genetic parame- Produccion y Sanidad Animales. INIA Publicaciones M.A.P.A. ters for a test day model with random regressions for yield 11(1), 69–83.
´ ´
traits of first lactation Holsteins. J. Dairy Sci. 80, 762–770. Serrano, M., Perez-Guzman, M.D., Montoro, V., Jurado, J.J.,
´ ´
Jurado, J.J., Serrano, M., Perez-Guzman, M.D., Montoro, V., 1995. 1996b. Genetic parameters estimation and selection progress Improvements in the Manchega genetic breeding programme. for milk yield in Manchega sheep. Small Rumin. Res. 23, In: Strategies for Sheep and Goat Breeding. Cahiers Options 51–57.
´ ´ ´ ´
Mediterraneennes, Vol. 11, pp. 133–142. Serrano, M., Jurado, J.J., Perez-Guzman, M.D., Montoro, V., 1998.
´ ´ ´ ´ ´
Jurado, J.J., Serrano, M., Perez-Guzman, M.D., Montoro, V., 1997. Modelizacion y estima de parametros geneticos para la
produc-´ ´ ´ ´
Estimas de componentes de varianza y respuesta a la seleccion cion de leche y proteına en el dıa de control en la raza ovina en la raza ovina Manchega mediante Muestreo de Gibbs. manchega. ITEA 94 (3), 325–333.
´ ´
Investigacion Agraria, Produccion y Sanidad Animales 12 Stanton, T.L., Jones, L.R., Everett, R.W., Kachman, S.D., 1992. (1–3), 27–40. Estimating milk, fat and protein lactation curves with a test day
¨ ´
Kettunen, A., Mantysaari, E.A., Stranden, I., 1997. Analysis of model. J. Dairy Sci. 75, 1691–1700.
first lactation test day milk yields by random regression model. Strabel, T., Szwaczkowski, T., 1995. The modelling of some non In: Proceedings Interbull Meeting, Vienna, pp. 39–41, Bulletin genetic effects on test day milk yields in dairy cattle. In: 46th
16. Annual Meeting of EAAP, Praga.
Kirpatrick, M., Hill, W.G., Thompson, R., 1994. Estimating the Strabel, T., Szwaczkowski, T., 1998. Influence of herd-test-day covariance structure of traits during growth and ageing, illus- grouping on the accuracy of breeding evaluation in dairy cattle. trated with lactations in dairy cattle. Genet. Res. 64, 57–69. In: Proceedings of the 6th World Congress on Genetics in Meyer, K., Hill, W.G., 1997. Estimation of genetic and phenotypic Applied Livestock Production, Armidale, Australia, pp. 629–
covariance functions for longitudinal or ‘repeated’ records by 632.
restricted maximum likelihood. Livest. Prod. Sci. 47, 185–200. Swalve, H.H., 1995. The effect of test day models on the Meyer, K., Graser, H.-U., Hammond, K., 1989. Estimates of estimation of genetic parameters and breeding values for dairy
genetic parameters for first lactation test day production of yield traits. J. Dairy Sci. 78, 929–938.
Blond-Faced Latxa sheep using Bayesian analysis. J. Dairy Sci. yield, survival, workability and type traits for Australian dairy 79 (12), 2268–2277. cattle. J. Dairy Sci. 78, 205–220.
Van Bebber, J., Reinsch, N., Junge, W., Kalm, E., 1997. Account- Wiggans, G.R., Goddard, M.E., 1997. A computationally feasible ing for herd, year and season effects in genetic evaluations of test day model for genetic evaluation of yield traits in the dairy cattle: a review. Livest. Prod. Sci. 51, 191–203. United States. J. Dairy Sci. 80, 1795–1800.
´
Vargas, B., Perez, E., Van Arendonk, J.A.M., 1998. Analysis of Wilmink, J.B., 1987. Efficiency of selection for different cumula-test day yield data of Costa Rica dairy cattle. J. Dairy Sci. 81, tive milk, fat and protein yields in first lactation. Livest. Prod.
225–263. Sci. 17, 211–224.