www.elsevier.com / locate / livprodsci
Optimum family size in progeny testing and the theory of
games
*
´
´
¨
L.A. Garcıa-Cortes , G. Yague, C. Moreno
´Unidad de Genetica Cuantitativa y Mejora Animal, Facultad de Veterinaria, Universidad de Zaragoza, c /Miguel Servet, 177, Zaragoza, E-50013, Spain
Received 14 December 1998; received in revised form 26 May 1999; accepted 27 August 1999
Abstract
In this paper, the optimum family size in a progeny test with limited testing facilities was determined for a scheme where several commercial companies were competing. Companies which determined family size in order to maximize the expected proportion of sires that will be selected from its stock were considered as competitive. On the other hand, companies that determined family size in order to maximize the expected genetic progress were considered as altruist. Using the theory of games, it was shown that competitive companies obtain better commercial results than altruist companies. When competing against competitive companies, altruist companies obtained worse commercial results than they expected. When all companies were competitive, the commercial results equalled those when all were altruist, but the total genetic progress decreased. A numerical procedure is described to calculate the family size to optimize the commercial results. The result of this algorithm showed that this commercial equilibrium depends only on the heritability and the ratio between the total testing facilities of the population and the number of sires required for the market. This commercial equilibrium did not depend on the number of companies or the size of each company. 2000 Elsevier Science B.V. All rights reserved.
Keywords: Animal breeding; Progeny test; Family size; Theory of games; Nash equilibrium
1. Introduction values as criteria. These plans require the additive genetic values to be predicted as accurately as Animal breeding plans are usually based on possible, but usually there is a conflict between the selecting by truncation the animals to be used as number of parents that can be tested and the accura-sires and dams in the next generation. Parents are cy of their genetic evaluations (Robertson, 1957; selected by using their predicted additive genetic James, 1979; Fernando and Gianola, 1990; Bourdon, 1997). In this context, designing a progeny test to evaluate new sires with a fixed amount of testing facilities will require the breeder to determine how many sires will be evaluated and thus how many
*Corresponding author. Tel.:134-76-761-000, ext. 4207; fax:
progeny will be used to test each of them. Although
134-76-761-612.
´ ´
E-mail address: [email protected] (L.A. Garcıa-Cortes) the accuracy of the evaluations can be used as a
criterion to optimize the programs (Foulley et al., 2. Methods
1983), the optimum number of progeny per sire is
usually analyzed in terms of the expected genetic In this section we propose a game where a given response. number of companies (the players) design simul-When several commercial companies design their taneously progeny tests for new artificial insemina-progeny tests, they will have to increase the genetic tion (AI) sires. Although Ashtiani and James (1993) merit of their breeding stocks in order to be competi- have shown that considering different strains can tive. Nevertheless, the objective of commercial com- modify the optimum number of progeny per sire, we panies is to increase the proportion of the market that will assume that animals coming from different they can have in terms of selected AI sires or company stocks are sampled from the same popula-selected animals. Usually, the relationship between tion.
the genetic merit of the breeding stock and the
proportion of the market is difficult to analyze (Hill, 2.1. The rules and the notation 1971). Although the companies will try to increase
the genetic merit of their stocks to be competitive, Each company has a fixed amount of testing they will design their breeding plans in order to facilities, that is, a fixed number of progeny that can increase their benefits and not to increase the genetic be measured. Hence, the number of sires that each progress explicitly. company can test depends on the number of progeny The genetic progress is expected to be optimum used to test each sire, and we will call the number of when companies try to optimize it explicitly. Never- progeny per sire family size. All companies know
2
theless, when companies are competitive the genetic the heritability (h ), the number of tested AI sires progress will be an indirect effect of the competition. demanded for the market and the amount of testing The intuition that guided our search is that the facilities of the opponents. The game will be played genetic progress obtained as an indirect result of the for only one generation.
competition will be smaller than the optimum. The Companies can use their own family size and theory of games (von Neumann and Morgenstern, afterwards the market will choose the sires with the 1944) provides a formal approach to the analysis of best selection index within the whole set of tested the optimal decision of the companies, or players, in sires. The objective of each company is to maximize cases where their interests are interdependent. the number of selected sires coming from its stock. The objective of this paper is to investigate, using We will use the following notation: T will be the the theory of games, the impact of this competitive total amount of testing facilities, N will be the behavior. We will compare the genetic progress number of tested sires which the market will require obtained in a scheme whose companies try to after the testing period and n will be the family size increase their proportion of the market with another used for testing the sires. Corresponding to this scheme whose companies try to increase the genetic notation, T will be the amount of testing facilities ofi merit of their stocks. We will also analyze how to the ith company, n will be the family size that thei calculate the optimal decision of each company in ith company uses for testing its sires, S 5T /n will
i i i
order to maximize the number of parents selected be the number of sires tested for the ith company and from its stock. p 5N /S is the proportion of sires selected from
i i i
In this paper, we propose a simple game that will those tested.
The game proposed here is a n-person zero-sum the determination of the expected number of selected game, that is, if a company increases its proportion sires coming from each company stock, N 5p S . i i i of the market, the proportion taken by other com- Order statistics for the whole set of normal dis-panies will decrease by the same amount. In games tributions are not available, but given the distribution of this kind, there is no reason for coalition, and the of the selection indexes, the truncation point that only criterion for the ith company to optimize its satisfies N2op S 50 can be obtained by using the
i i
strategy n is to maximize N or p 5N /S . bisection algorithm (Burden and Faires, 1985). This
i i i i i
Depending on the family size used by each algorithm evaluates the candidate points and, by company, the expected number of sires selected from successive bracketing, approaches the truncation
(k ) (k ) each company stock can be predicted. point k which satisfies N2op S 50. p is the
i i i
proportion of sires selected from the ith company and the candidate truncation point k. After the 2.2. Game payoffs
common truncation point was calculated, to obtain the expected number of sires selected from each Each possible set of strategies n for all the playersi
company stock and the payoffs for each company is corresponds to a set of payoffs. A payoff is a number
straightforward from N 5p S .
that determines the winner of the game. i i i
Note that each company can calculate its payoff When playing this game, the companies will try to
only if it knows the strategies of the opponent maximize the expected number of sires selected from
companies, but the other players will hide their their stocks. So, in this case, a company will
strategies like in a gambling card game. To optimize consider itself as the winner of the game when the
its own strategy, each company should guess which proportion of selected sires which come from its
would be the strategies of the opponents. Further, to stock is bigger than the proportion its testing
play rationally the game, each company will assume facilities are of the total. For that reason, we define
that the other companies will also choose their the payoffs as a set of numbers derived from N :i
strategies rationally.
NTi ]
P 5N 2
i i T
3. Results: the analysis of the game
The payoffs can be determined after each com-pany has decided the strategyn . When the payoff ofi
3.1. Result of the game involving two companies: a company is zero, its expected proportion of the
the duopoly
selected animals is equal to its proportion of the testing facilities, N /N5T /T. A positive payoff for
i i
To illustrate the procedure that a company should the ith company means that the proportion of
select-follow to decide its strategy, we present in this ed sires coming from its stock is bigger than its
section the result of the game in a case with two proportion of the testing facilities. We show in this
companies. As an example, suppose that the testing section how to calculate the whole set of payoffs
facilities of the company 1 are 1000 spaces, the from the whole set of strategies.
testing facilities of company 2 are 500 spaces and the Setting the additive genetic variance equal to 1,
heritability is 0.25. They compete in a market that the stock of the ith company corresponds to S siresi
will select 10 sires on the basis of the predicted
ˆ
whose predicted additive values (a ) are realized
breeding value. Company 1 expects two thirds samplings from a normal distribution with null
(1000 / 1500) of the selected sires to come from its expectation and variance equal to
stock, and company 2 expects one third (500 / 1500). 2
In this game, both companies will calculate all 0.25n hi
2 ]]]]]
s 5
ˆ
a 2 possible pairs of strategies in order to decide its 110.25 ns 21 hd
i
Table 1
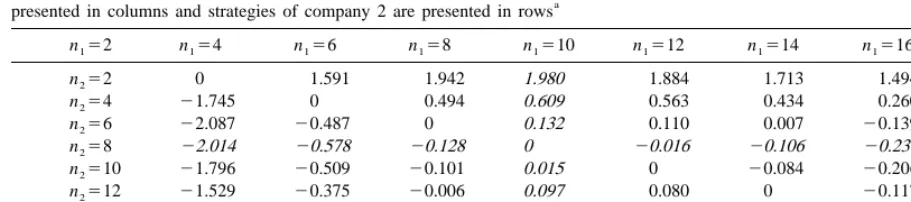
Payoff matrix for company 1 in the duopoly game; payoffs for company 2 are equivalent but opposite in sign. Strategies of company 1 are a
presented in columns and strategies of company 2 are presented in rows
n 52 n54 n 56 n 58 n510 n 512 n 514 n516
The column and row presented in italic font correspond to the best payoffs for company 1 and company 2, respectively.
each company. This table is usually called the table eight progeny per sire and it contains the best of payoffs and it can be calculated for each player payoffs for company 2.
before the game. Only the payoffs for company 1 are Both companies can use the approximation of presented because company 2 has the same payoffs Robertson (1957) or numerical procedures to calcu-but opposite in sign. Thus, the objective of company late that 14 progeny per sire maximizes the genetic
2 2 is to maximize its payoff or to minimize the payoff progress with T51500, N510 and h 50.25
of company 1. T 0.5
]]
n50.56 513.7
Fig. 1 shows the surface of the values presented in
S D
2Nh
Table 1, with the strategies ranging 2 to 20. It can be
shown that the opposing interests of the two com- So, both companies should decide to test their panies have an equilibrium point that corresponds to sires using 8 daughters per sire (the commercial the row and column presented in bold in Table 1. In equilibrium) or 14 daughters per sire (the genetic this table, the fourth column corresponds to eight optimum). Table 2 presents the relevant information progeny per sire and it contains the best payoffs for that both companies will have available to decide company 1, and the fourth row corresponds also to just between these two strategies. From Table 2, if company 1 guesses that company 2 will choose 8, its payoff is better if it choose 8 (0 over20.237). In the
same way, if it guesses that company 2 will choose 14, its payoff is still better (0.209 over 0) by choosing 8. Hence, company 1 will choose to test each sire with eight progeny, whatever the strategy of company 2. The same argument holds for com-pany 2 to choose 8 progeny per sire. Hence, the equilibrium point is unique and stable. Both com-panies have the same payoffs at (8,8) as at (14,14),
Table 2
Simultaneous strategies in the game involving two companies, their payoffs and the total genetic progress of the population
n1 n2 N1 N2 P1 P2 E(DG)
8 14 6.876 3.124 0.209 20.209 1.215
14 8 6.430 3.570 20.237 0.237 1.229
8 8 6.667 3.333 0 0 1.201
14 14 6.667 3.333 0 0 1.242
but they will choose 8 to prevent the competitive algorithm reaches the equilibrium and the set of behavior of the opponent giving it an advantage. strategies is a Nash equilibrium. Although not pre-In the theory of games framework, this kind of sented in this paper, we corroborated the uniqueness stable optimum is called the Nash equilibrium (Nash, of the Nash equilibrium by setting different sets of 1951). A set of pure strategies is a Nash equilibrium starting strategies. Each company considers fixed the if no player can increase its payoff by a unilateral strategies of the opponents as fixed just as an change in his strategy. The Nash equilibrium for algorithmic artifact to reach the Nash equilibrium. games whose strategies have to be optimized within Usually, each company maximizes its payoffs by a range of numerical values is usually called the differentiating its univariate payoffs function consid-equilibrium of Cournot–Nash (Binmore, 1992). In ering the strategies of the other companies fixed. In general, this equilibrium does not have to be unique, this case, this function of payoffs is difficult to but Fig. 1 shows a saddle form and the Nash differentiate and we used a successive bracketing equilibrium is unique for this game. algorithm (Press et al., 1986) to find the maximum. So, the result of the game is that both companies This algorithm requires only several evaluations of will simultaneously set their family sizes below the the payoff function to find its maximum.
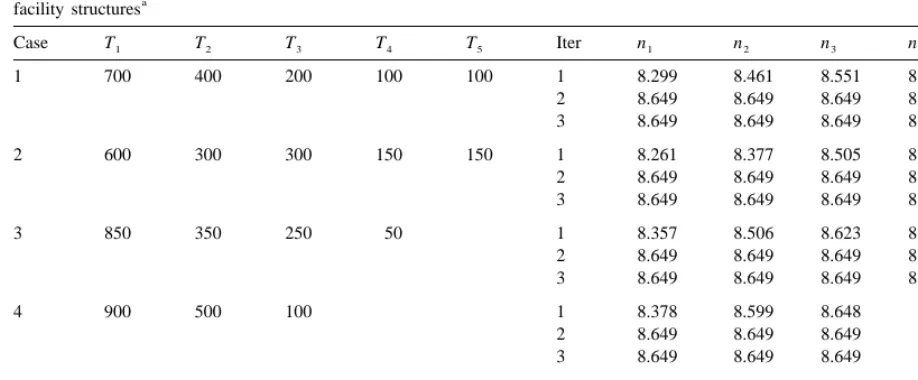
2 genetic optimum and no company will win the game, We considered an example with N510 and h 5
but the genetic progress will decrease from 1.242 to 0.25. The players were five companies whose testing 1.201. Under the assumptions made for this game, facilities were 700, 400, 200, 100 and 100, respec-big companies do not win over small companies nor tively. As in the duopoly game, all companies have vice versa, but companies that use the theory of to decide the optimum strategy and they have to games will win over altruist companies that use the predict the optimum strategies of the opponents. expected genetic progress as criterion. Starting strategies were arbitrarily set as 5 progeny
If only one of the companies decides unilaterally per sire for all companies. We show in case 1 of to be competitive, Table 2 shows that company 2 Table 3 the result of the algorithm that converged in will increase its expected number of successful sires 2 rounds of iteration. The 3rd round was calculated from 3.33 to 3.57 (7%), and company 1 will increase to verify that results do not change and hence that its results from 6.66 to 6.88 (3%). That is, the small the set of strategies reached is the Nash equilibrium. company will be more interested than the big The algorithm presented in case 1 of Table 3 can company to be competitive. In these circumstances, be interpreted as follows. First, all players can it can be noticed that a previous agreement between calculate that company 1 will choose n 58.299 as
1
companies to be simultaneously altruist is difficult, the optimum strategy using the successive bracketing as in any other zero-sum game. algorithm on its payoff function and considering that the fixed strategies of the other companies were 3.2. Result of the game involving more than two n 55, n 55, n 55 and n 55. Afterwards, all
2 3 4 5
companies players know that company 2 will guess the strategy
of company 1 and it will choose n 58.461 as the 2
The game involving two companies was analyzed optimum strategy considering n 58.299, n 55,
1 3
by setting several pairs of strategies and looking at n 55 and n 55. Following this successive set of
4 5
the payoff surface (Fig. 1). If more than two optimizations where each company can predict the companies are playing the game, the number of behavior of the other companies, the algorithm possible sets of strategies grows dramatically and the reaches the Nash equilibrium. Note that the family multidimensional table of payoffs is difficult to size was not forced to be an integer number, as in the represent. For that reason, each company uses nu- duopoly game.
merical procedures to obtain the Nash equilibrium. Table 3 also shows four other cases with different The algorithm starts from an arbitrary set of number of companies and different testing facilities. strategies, and each company successively calculates All cases studied considered T51500. From this
Table 3
Results and convergence of the algorithm reaching the Nash equilibrium in several cases with 2, 3, 4 or 5 companies and several testing a
facility structures
Case T1 T2 T3 T4 T5 Iter n1 n2 n3 n4 n5
1 700 400 200 100 100 1 8.299 8.461 8.551 8.598 8.647
2 8.649 8.649 8.649 8.649 8.649
3 8.649 8.649 8.649 8.649 8.649
2 600 300 300 150 150 1 8.261 8.377 8.505 8.574 8.649
2 8.649 8.649 8.649 8.649 8.649
Heritability was 0.25 and the number of sires selected by truncation was 10. T are the testing facilities of each company and n is thei i strategy of each company.
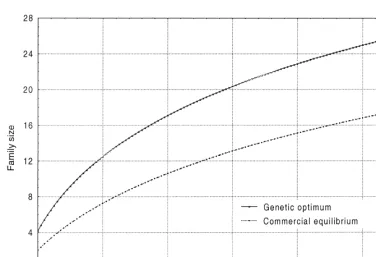
depend on the number of companies involved in the the ratio T /N on the family size and the expected game. Moreover, it does not depend on the propor- genetic progress. With N fixed at 10 sires to be tion of testing facilities of each company. In fact, it selected, the ratio T /N ranged from 20 to 500 and depends only on the ratio T /N and the heritability. In heritability was 0.20. These figures show that the the next section, we will investigate the relationship family size determined in order to cooperate is also between the heritability, the ratio T /N, the commer- larger than the family size to compete, whatever the cial optimum and the genetic optimum. ratio T /N. All cases show that competition produces
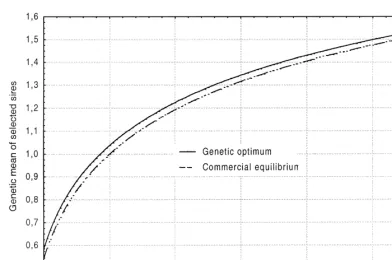
a decrease in the expected genetic progress. 3.3. Effect of the heritability coefficient and the
ratio T /N on the commercial equilibrium
4. Discussion
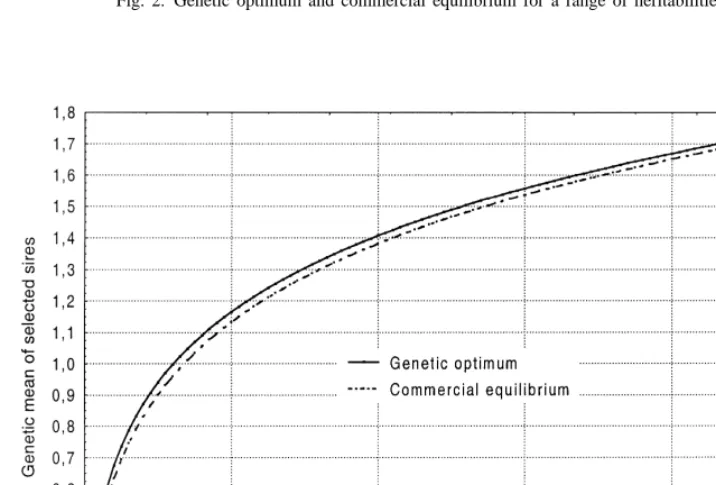
We calculated both the genetic optimum and the
Nash equilibrium for case 1 presented in Table 3 for Despite the simplifying assumptions made, the a range of heritabilities. These results, which are game analyzed in this paper shows in general that shown in Fig. 2, demonstrate that the commercial optimizing the genetic progress does not produce the optimum family size is always smaller than that for optimum commercial results. The game does not the genetic optimum, especially for small mimic exactly the real behavior of the market. It heritabilities. Fig. 3 shows the expected genetic assumes that the number of sires selected for the progress when the five companies determine the market and the benefits have an exact linear relation-family size in order to maximize the genetic progress ship, without considering that selected animals have explicitly and the expected genetic progress when the different commercial value depending on their selec-five companies determine the family size at the tion indexes. Nevertheless, the benefits usually de-commercial equilibrium. The expected genetic pro- pend on the quality of the selected sires. It also does gress obtained for 5 competitive companies is around not consider the effect of different amount of in-3% smaller than for five cooperative or altruist formation about the genetic value of the sires before companies, under all values of the heritability. the progeny test.
Fig. 2. Genetic optimum and commercial equilibrium for a range of heritabilities.
Fig. 4. Genetic optimum and commercial equilibrium or a range of ratios between the amount of testing facilities and the number of sires demanded by the market.
game was only analyzed for one generation and the which consider all relationships. In this case, the company stocks have the same mean breeding accuracy of the sire evaluation is related both with values. That is an important limitation of the game, the number of progeny and the mating strategy in the because in a game involving several generations, a whole population.
company can decide to optimize the genetic progress Strategies have been restricted to pure strategies, of its stock at the first generation, even decreasing its that is, strategies where a company uses the same proportion of the market, in order to get an advan- family size to test all its sires. For practical purposes, tage for future generations. The reader will notice where the game is not so simple, analyzing strategies that analyzing multiple generation games is non with a different number of progeny per sire may be trivial because we should analyze complex genera- very relevant in cases with previous information or tion dependent strategies like ‘be always competi- cases where the testing period have to be done in tive’, ‘be altruist while the others are also altruist, several stages.
Fig. 5. Genetic progress obtained for the five companies when they use the commercial equilibrium or the genetic optimum for a range of ratios between the amount of testing facilities and the number of sires demanded by the market.
concentrate its effort on the determination of the more sires, and the sampling variance of their heritability, the number of the total testing facilities commercial results will decrease to a larger extent available in the population and the number of sires than for large companies.
required for the market. The last two numbers Results presented in this paper suggest that a depend on the population size, the number of years reduction in the number of progeny per sire will that the sires are kept in the AI station, the per- increase the number of sires selected from a com-centage of animals that farmers will use to test new pany stock. In this case, the proportion of selected sires, etc. sires will decrease because both the accuracy and the During the game, there is no reason for two variance of the expected breeding values will de-companies to cooperate when playing against other crease. Thus, the better commercial results can be companies, because the size of each company does explained because of the rise in the number of tested not affect the commercial equilibrium or its payoff. sires. In this context, the commercial equilibrium is A company that uses the theory of games to the strategy where the proportion of selected sires determine its family size will increase its proportion multiplied by the number of tested sires reach its of selected AI sires when it is competing with other maximum.
Hill, W.G., 1971. Investment appraisal for national breeding
game because their objective is to maximize
explicit-programs. Anim. Prod. 71, 37–50.
ly the number of sires beyond the truncation point.
James, J.W., 1979. Optimum family size in progeny testing when ¨
prior information is available. Zeitsch. Tierz. Zuchtungsbiol. 95, 194–203.
References Ashtiani, S.R.M., James, J.W., 1993. Optimum family size for progeny testing in populations with different strains. Genet. Sel. Evol. 25, 339–352.
Binmore, K., 1992. Fund and Games: a Text on Game Theory,
Nash, J., 1951. Non-cooperative games. Ann. Math. 54, 286–295. D.C. Heath, Lexington, MA.
Press, W.H., Flannery, B.P., Teukolski, S.A., Vetterling, W.T., Burden, R.L., Faires, J.D., 1985. Numerical Analysis, PWS,
1986. Numerical Recipes: The Art of Scientific Computing, Boston, MA.
Cambridge University Press, Cambridge. Bourdon, R.M., 1997. Understanding Animal Breeding, Prentice
Rasmusen, E., 1994. Games and Information. An Introduction To Hall, Upper Saddle River, NJ.
Game Theory, Blackwell, Oxford. Fernando, R.L., Gianola, D., 1990. Optimal designs for sire
Robertson, A., 1957. Optimum group size in progeny testing and evaluation schemes. In: Gianola, D., Hammond, K. (Eds.),
family selection. Biometrics 13, 442–450. Statistical Methods For Genetic Improvement of Livestock,
von Neumann, J., Morgenstern, O., 1944. The Theory of Games in Springer Verlag.
Economic Behavior, Wiley, New York. Foulley, J.L., Schaeffer, R.L., Song, H., Wilton, W., 1983. Progeny