Baseline Study for Rural and Remote
Education Initiative for Papuan
Provinces
Report of Findings
Prepared for Dr. Monika Nielsen Education Specialist
The United Nations Children’s Fund (UNICEF) / Papua Kantor Dinas Otonom PEMDA Tingkat 1, Kotaraja Jayapura, Papua
Prepared by Myriad Research
The authors wish to acknowledge the important contributions to the numerous people who
made this study possible. Dr. Monika Nielsen, Sri Widuri, Siti Eliza Mufti, Hiro R Sugi, and R.
Justin Sodo of the United Nations Children’s Fund (UNICEF) / Indonesia provided valuable guidance and support throughout the preparation and implementation of this study. Dr.
Margareth Dubeck, Katherine Batchelder, and Chris Cummmiskey of the RTI International
provided scientific guidance on the EGRA and SSME instrument and data analysis. The Ministry
of Education and Culture (MOEC) also made important contributions in developing and
implementing this study and helped to ensure that the instruments were appropriately aligned
to an Indonesian context. In particular, we wish to thank Dr. Asrijanty, Head of the Analysis
and Assessment Information System – Centre of Education Assessment and Dr Dewi Utama Faizah, Head of the Assessment and Accreditation Directorate of Primary Education, from
MOEC, for their support. The technical experts of this study – Dr. Wayan Susila, Dr. Yeti Mulyawati, Dr. Agus Suyatna, Neny Isharyanti M.A provided invaluable support throughout
the study. Most importantly, this work could not have succeeded without the cooperation
and contributions of the six area coordinators, 72 assessors and supervisors, and the students,
parents, teachers, head teachers, heads of villages, and education authority officers at the
district and provincial levels included in the study. Finally, we would like to pay tribute to the
contributions of our beloved colleague, Retno Maruti, who was ill and passed away during the
Page
Acknowledgment iii
No table of contents entries found.Table 4.6:Score of Zero for EGRA by Subtask and Grade ... 87 Table 4.7: Reading Ability of Early Grade Students by District ... 89 Table 4.8: Correlation Analysis of EGRA Subtasks ... 90 Table 4.9: Oral Reading Fluency and Reading Comprehension by Demographics ... 91 Table 4.10: Oral Reading Fluency and Reading Comprehension by Book
Ownership ... 92 Table 4.11: Oral Reading Fluency and Reading Comprehension by Reading Habit .... 93 Table 4.12: Oral Reading Fluency and Reading Comprehension by Homework ... 93 Table 4.13: Oral Reading Fluency and Reading Comprehension, by Pre-school
Attendance, Main Language a Home, and Teacher Recognition ... 94 Table 4.14: Oral Reading Fluency and Reading Comprehension by Teachers’
Reactions to Students’ Inability to Answer Questions ... 95 Table 4.15: Oral Reading Fluency and Reading Comprehension from Parental
Support ... 96 Table 4.16: Oral Reading Fluency and Reading Comprehension from Student
Absenteeism ... 96 Table 4.17: Oral Reading Fluency and Reading Comprehension Based on Parents’
Education Level ... 97 Table 4.18: Oral Reading Fluency and Reading Comprehension Based on Parents’
Characteristics ... 98 Table 4.19: Oral Reading Fluency and Reading Comprehension Based on
Teachers’ Characteristics ... 99 Table 4.20: Oral Reading Fluency and Reading Comprehension Based on
Teachers’ Language ... 100 Table 4.21: Students’ Main Language ... 100 Table 4.22: Teachers’ Main Language... 101 Table 4.23: Oral Reading Fluency and Reading Comprehension Based on School
Characteristics ... 101 Table 4.24: Oral Reading Fluency and Reading Comprehension Based on School
Characteristics ... 102 Table 4.25: Oral Reading Fluency and Reading Comprehension Based on School
Characteristics ... 103 Table 4.26: Oral Reading Fluency and Reading Comprehension Based on
Classroom Characteristics... 104 Table 4.27: Oral Reading Fluency and Reading Comprehension Based on
Classroom Characteristics... 104 Table 4.28: Oral Reading Fluency and Reading Comprehension: Impact of
Table 4.29: Oral Reading Fluency and Reading Comprehension: Impact of
Parents’ Characteristics ... 107 Table 4.30: Oral Reading Fluency and Reading Comprehension: Impact of
Teachers’ Characteristic ... 108 Table 4.31: Oral Reading Fluency and Reading Comprehension: Impact of a
School’s Characteristics ... 109 Table 4.32: Oral Reading Fluency and Reading Comprehension: Impact of
Classroom Characteristics... 110 Table 4.33: Oral Reading Fluency and Reading Comprehension: Impact of all
SSME Dimensions... 111-112 Table 6.1: Tactical Improvements Needed at Each Stakeholder Level ... 210
ABK Anak Berkebutuhan Khusus: children with special needs APK Angka Partisipasi Kasar: gross enrolment rate
APM Angka Partisipasi Murni: net enrolment rate
AUSAID Australian Agency for International Development
BOS Bantuan Operasional Sekolah: school operational assistance
BOSDA BOS Daerah: school operational assistance at district level
BPMK Badan Pemberdayaan Masyarakat Kampung: agency for community empowerment at village level
BPS Badan Pusat Statistik: Statistics Indonesia
Calistung Tes membaca, menulis, berhitung: reading, writing, and arithmetic test DAK Dana Alokasi Khusus: specific allocation fund
DIKTI Pendidikan Tinggi: Directorate General of Higher Education
DEO District Education Office
DPA Dokumen Pelaksanaan Anggaran: budget realisation document
EdData II Education Data II
EGRA Early Grade Reading Assessment
KAT Komunitas Adat Terpencil: remote indigenous community
KKG Kelompok Kerja Guru: teacher’s working group
KKKS Kelompok Kerja Kepala Sekolah: head teacher’s working group KPG Kursus Pendidikan Guru: teacher training
KTSP 2006 Kurikulum Tingkat Satuan Pendidikan 2006: name of 2006’s curriculum
MBS Manajemen Berbasis Sekolah: school based management
MGMP Musyawarah Guru Mata Pelajaran: discussion forum of teachers who teach similar subject
MOEC Ministry of Education and Culture
MUSRENBANG Musyawarah Perencanaan Pembangunan: development planning forum
NGO Non Government Organisation
NT Nusa Tenggara
ORF Oral Reading Fluency
OTSUS Otonomi Khusus: special autonomy
PAUD Pendidikan Anak Usia Dini: early childhood education
PAUDNI Pendidikan Anak Usia Dini, Non Formal, Informal: early childhood education, non formal and informal education
PEO Provincial Education Office
PERDASUS Peraturan Daerah Khusus: local regulations for a special autonomy province
PGSD Pendidikan Guru Sekolah Dasar: primary school teacher education
PISA Program for International Student Assessment
PKH Program Keluarga Harapan: government program for poor family
PKLK Pembinaan Pendidikan Khusus dan Layanan Khusus: supervisions on special education and services
PNPM Program Nasional Pemberdayaan Masyarakat: national program of community empowerment
PSM Program Serta Masyarakat: community participation program
PUSKESMAS Pusat Kesehatan Masyarakat: community health centre
RAPBS Rencana Anggaran Pendapatan Belanja Sekolah: school’s budget and expenses plan
RENJA Rencana Kerja: working plan
RENSTRA Rencana Strategis: strategic plan
RESPEK Rencana Strategi Pengembangan Kampung: village development strategy planning
RKAS Rencana Kegiatan dan Anggaran Sekolah: school’s activities and budget plan
RKB Ruang Kelas Baru: new classroom
RKS Rencana Kerja Sekolah: school work plan
RPP Rencana Pelaksanaan Pembelajaran: lesson plan
RTI RTI International: a trade name of Research Triangle Institute
SPG Sekolah Pendidikan Guru: school of education -senior high school level
SPGA Sekolah Pendidikan Guru Agama: school of religious education -senior high school level
SSME Snapshot of School Management Effectiveness
STBM Sanitasi Total Berbasis Masyarakat: community-based sanitation 3T Terdepan (forefront), Terluar (outer), Tertinggal (left behind)
TIMSS Trends in International Mathematics and Science Study
TK Taman Kanak Kanak: kindergarten
TKD Tes Kemampuan Dasar: basic competencies test
TNP2K Tim Nasional Percepatan Penanggulangan Kemiskinan: national team for the acceleration for povery reduction
UKS Unit Kesehatan Sekolah: school health unit
UNESCO the United Nations Educational, Scientific and Cultural Organisation UNICEF the United Nations Children’s Fund
UPTD Unit Pelaksana Teknis Dinas Daerah: technical implementor unit at district level
USAID the United States Agency for International Development
WTA Willi Toisuta & Associates
YKW Yayasan Kristen Wamena: Wamena Christian foundation
Papua and Papua Barat (West Papua) provinces rank among the lowest in Indonesia across
most human development indices. The two provinces also have higher poverty rates than the
national average. In terms of illiteracy rate, Papua and Papua Barat are among provinces with
the highest rates. As a result, Papua and Papua Barat are both provinces with a high amount
of illiteracy and poverty (UNESCO and MOEC, 2012). UNICEF et al. (2012) revealed
significant disparities in literacy rates between urban and rural Papuans, with higher illiteracy
in rural areas (49%) compared to urban areas (5%). Disparities are most pronounced in the
highland districts where rates of illiteracy ranged from 48% to 92%. The data shows the
inequality of students’ access to quality education services in rural and remote areas of the two provinces.
UNICEF Indonesia, funded by AUSAID, successfully implemented Phase 1 of the Papua and
Papua Barat Education Programme during 2010-2013. Following the first phase, the second
phase of the program has been started to support the district and provincial governments and
key education foundations to facilitate improved educational opportunities for children living
in rural and remote areas of Papua and Papua Barat. To provide relevant information on early
grade reading and school management, a baseline study of Early Grade Reading Assessment
(EGRA) and Snapshot of School Management Effectiveness (SSME) was conducted in
March-April 2015. The EGRA measures the basic skills that a student must possess to eventually be
able to read fluently and comprehend; and the SSME survey captures the “best” ways in which effective schools influence student learning.
Myriad administered the two surveys to 180 schools, equally allocated across the six districts,
namely: Biak, Jayapura, Mimika, Jayawijaya, Sorong, and Manokwari. The surveys involved 2,934
grade 2 and 3 students, 2,645 parents, 330 teachers, and 178 head teachers. In addition, 162
in-depth interviews with students and their parents, teachers, head teachers, community
leaders, as well as district and provincial education officers were also conducted. An equal
number of in-depth interviews across districts were carried out.
Overall, this baseline study revealed that the majority of early grade students in rural and
remote areas of Papuan provinces were readers with limited comprehension (38.55%) or
non-readers (48.47%). Only less than 15% of them were categorized as non-readers: reading with
is far below the average range for students in Indonesia, and similarly, far below other students
in Maluku, Nusa Tenggara, and Papua region (from an EGRA National Survey conducted by
RTI International and USAID/Indonesia in 2014). Furthermore, the students’ reading ability was inconsistent across the surveyed districts. Jayapura students significantly outperformed
their counterparts from the other five districts; while on the other hand, Jayawijaya students
obtained the lowest performance. This baseline study revealed all the components that are
related to the stakeholders of basic education in Papuan provinces, including students and
their families, teachers, head teachers and schools, the communities, and local education
authorities, which contributed to the low level of reading ability.
The study revealed that students faced several challenges to achieve better reading
performance. The challenges included economic, geographic, and socio-cultural disadvantages.
Students received limited support from their families, such as the unavailability of parental
support when they were studying at home, the necessity to help their parents earn a living,
the unavailability of any books at home other than the limited textbooks provided by their
schools, and in a few cases incidents of domestic physical abuse. As a result, there was limited
learning and reading environment at home observed. The condition was worsened by the
geographical and social disadvantages. This study found that, apart from being sick, the main
reason for students’ absence was due to geographical and social disadvantages such as: the unavailability of transportation, the occurrences of bad weather, and the danger of traveling
to school due to local conflicts. This absenteeism had a significant negative impact on the students’ reading performance.
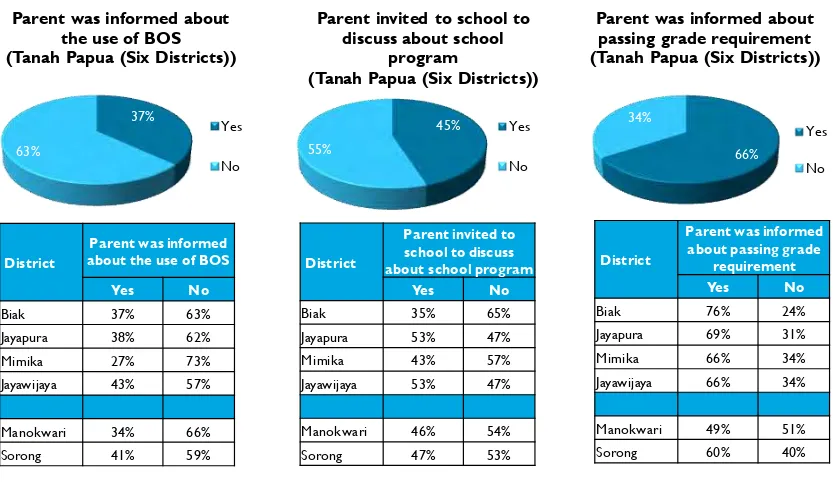
Parents were only involved in and informed about their children's academic progress on a
limited basis. Also, they were never informed about the school plans or programs. Parents
were dissatisfied about teachers’ absences and their limited involvement, but on the other hand, the teachers were also unhappy about parental support. As a result, limited
communication and collaboration between parents and teachers/schools occurred.
The teacher factor also contributed to students’ disadvantages. There was a lack of teachers for early grade classrooms, so that teachers were forced to teach multiple classrooms. There
teacher (honorary teacher), also disadvantaged students, not to mention the limited
supervision and control from the head teachers and school supervisors. These all have
resulted in teachers' low motivation and ultimately led to teachers’ absenteeism and reduced quality of teaching.
Head teachers had their own contributions to students’ disadvantages. They had limited manpower in school; while on the other hand, they were required to handle administrative
tasks from education office at the district level. Balancing these two responsibilities made it
difficult for them to manage the schools optimally. In addition, the head teachers were also
not fully supported by the community and the school supervisors.
Schools and classroom facilities also hindered the students’ potentials to learn and read more. The majority of schools had very limited facilities, and they were not clean and tidy. The
unavailability of proper toilets, clean water resources, electricity, libraries, and a sufficient
number of books in the libraries and classrooms, and even a sufficient number of seats and
desks in the classrooms, have resulted in the low quality of teaching and learning processes
that could be provided to the students.
This baseline study also revealed the most consistent factors impacting students’ reading performance, namely: district differences, students’ grades, parents’ education and literacy, students’ and parents’ main language, parents’ income, teachers’ academic qualifications, classroom seating arrangements, book availability and accessibility, students’ displayed works, school type - either public or private, school accreditation, as well as the availability and the
usage of library services. However, among these factors, some of them are “policy relevant” but they can unlikely be changed for individual students, such as district, wealth, school type
and accreditation, and teacher academic qualification. Meanwhile, some others are “in-school and student factors” and doing something about these factors would have a meaningful impact on students’ reading performance. For instance, changing students’ seating arrangement from the classical model to the U-shaped or small group arrangement also has a significant impact.
Allocating enough funds to purchase attractive and interesting reading materials for early
grade students, and giving them access to borrow the books would also improve their reading
performance. In addition, creating a more academic but cheerful classroom environment by
This baseline study also concluded that students' reading habits at home had a significant
impact on their reading performance. Therefore, the teachers might assign the students to
read aloud at home to other family members. Furthermore, the teachers might need to be encouraged to give written feedback on their students’ exercise books, as this factor significantly increased students’ reading performance. In relation to the exercise book, teachers and head teachers might need to pay attention to the students who even do not
have the book. In addition, homework frequency might also need to be increased. This study
found that homework had a significant impact on students’ reading performance, but the frequency was found to be still insufficient. Moreover, the students need to be appreciated by
both teachers and parents, while at the same time, proper- non physical punishment is also
required. The balance of giving rewards and applying punishment was found to significantly
increase the students’ reading performance.
This study also found out that students’ reading performance was not differentiated by the teachers’ training experiences and their academic qualifications. Students whose teachers were with or without pre-service training had a relatively similar level of reading performance.
Furthermore, students whose teachers said that they had ever attended training on how to
teach reading also had a similar level of reading performance as those whose teachers never
did. Interestingly, this study also found that teachers with bachelor’s degree qualifications did not necessarily have students with better reading performance than their fellow teachers who
graduated from senior high school.
The last factor of “in-school and student factors” is the school's condition and facilities. As this study found that this factor had a significant impact on students’ reading performance, the education authority at the district level needs to pay close attention to this. From the desk
research and in-depth interviews, it was found that there is a specific budget for school facility
improvements. However, the results from school observations told a different story. Almost
half of the schools observed in this baseline study had poor facilities to support the students’ learning process.
This baseline study also recognized the other factors which significantly contributed to the
teachers, school supervisors, community leaders, and education officers at the district and
provincial levels was not optimally achieved. A lack of control and supervision over the head
teachers from the school supervisors and education officers lowered the head teachers’ school management quality. It was not uncommon to find schools without the presence of
head teachers during the data collection. Meanwhile, the lack of school supervisors to cover
the large and remote geographical areas of Papua also contributed to the insufficient control
and supervision. At the end side of the control is education office at the district and provincial
levels. These authorities were not without problems. Classical problems such as a lack of
personal and a lack of manpower with enough and appropriate competences to do the job
were among the reasons frequently stated during the interviews. Consequently, what was
happening in the primary schools located in rural and remote areas of the provinces was not
fully understood by these authorities.
While no single solution is suggested for improving the conditions of basic education in rural
and remote areas of the Papuan provinces, this baseline study identified “in-school and student factors” that might be more manageable and easier to be improved at the school level by the head teachers and supported by parents and the community, in order to obtain significant
improvement in the reading ability of the early grade students. Meanwhile, the “policy-relevant factors” which are unlikely to be changed immediately, need to be gradually improved by provincial and district education authorities. To be able to do this, an adequate capacity and
commitment of the provincial and district education officers for strategic planning and
This chapter discusses the background and the objectives of the baseline study. It is followed
by an overview of the Early Grade Reading Assessment (EGRA), which consists of discussions
on the reasons to test early grade reading, and what the measures are. Following the
discussions on the EGRA, the Snapshot of School Management Effectiveness (SSME) is
discussed at the end of this chapter.
1.1 Background
Papua and Papua Barat (known together as Tanah Papua) have a total population of more than
3.9 million (BPS, 2015). According to Elmslie (2010), in 2010, 47.89% of the population is
indigenous Papuan. Approximately 70% of the population resides in rural and remote areas
characterised by considerable educational inequalities across different socio-economic groups
and between indigenous and non-indigenous populations.
Papua and Papua Barat provinces rank among the lowest in Indonesia across most human
development indices. In 2013, with a national average human development index of 73.81, the
Papua index was 66.25, while the Papua Barat index was 70.62. In addition, the two provinces
have a higher poverty rate than the national average. According to BPS (2014), the national
poverty rate average was 11.25%, while Papua was 30.05% and Papua Barat was 27.13%, with
a significant disparity between urban and rural areas.
In terms of illiteracy rate, Papua and Papua Barat are among provinces with the highest rate.
UNESCO and the Ministry of Education and Culture (MOEC) in 2012 indicated a national
average score of 4.43% or 6,730,682 illiterate people, but there are discrepancies among
provinces. Figure 1.1 indicates the percentage of adult literacy and the number of illiterates at
the provincial level (UNESCO and MOEC, 2012). There are four provinces whose illiteracy
rate is the highest, namely West Nusa Tenggara (16.48%), East Nusa Tenggara (10.13%), West
Sulawesi (10.33%), and Papua (36.31%). In addition, there are seven provinces with illiteracy
rates between 5.0% - 9.9%, namely Gorontalo (5.05%), Bali (6.35%), Southeast Sulawesi
(6.76%), Papua Barat (7.37%), East Java (7.87%), West Kalimantan (7.88%), and South Sulawesi
Figure1.1: Percentage and Number of Illiterates in Indonesia
UNESCO and MOEC (2012) also indicated a close connection between illiteracy and poverty
at all levels, as shown in Figure 1.2. The provinces with the lowest level of literacy are also
normally the poorest economically. If a province has a high number of illiterates, the province’s poverty rate is also high or vice versa. Papua and Papua Barat are both located in Quadrant
Figure 1.2: Relationship Pattern between Poverty and Illiteracy Rates
Recent research, conducted by RTI International and funded by USAID, on the National Early
Grade Reading Assessment (EGRA) among second grade students in primary schools across
Indonesia revealed that the eastern part of Indonesia (Maluku, Nusa Tenggara, and Papua) had
the highest percentage of non-readers, namely 22% as compared to the national average of
5.8%. Java, Bali, and Sumatera regions had the lowest percentage of readers. The
non-readers are defined as second grade students who could not read at all.
UNICEF et al. (2012) pointed out the disparities of the illiteracy rate in rural and remote areas
of Papua and Papua Barat as compared to the urban areas. In Papua Province, about 37% of
the population resides in mountainous highland districts, 41% lived in easy-to-access lowland
districts, and 21% resided in lowland difficult-to-access districts. Families and children living in
rural and remote areas experienced the highest economic and educational disparities.
Significant disparities existed in literacy rates between urban and rural Papuans, with higher
illiteracy in rural areas (49%) compared to urban areas (5%). Disparities were most
pronounced in the highland districts where rates of illiteracy ranged from 48% to 92%. Almost
50% of the population in rural Papua above 5 years of age had never attended school,
To reduce the gap, MOEC has prioritized the eastern parts of Indonesia, including Papua and
Papua Barat, to receive higher budget allocations of BOS (Bantuan Operasional Sekolah) or
school operational assistance. The aim is to enhance basic and middle education quality in the
provinces. At the higher education level, MOEC has a specific program for provinces that is
classified as 3T (Terdepan = forefront; Terluar = outer; Tertinggal = left behind), including Papua
and Papua Barat. The scope of the program covers teachers' training in the 3T areas of Papua
and Papua Barat (Directorate General of Higher Education-DIKTI, MOEC, 2014).
Although MOEC has several programs targeted to the 3T provinces, the results of the study
conducted by RTI International revealed a significant gap in terms of teacher qualifications
across regions. Almost 80% of teachers in Java-Bali had a Bachelor’s Degree, while only 47% in Maluku, Nusa Tenggara, and Papua regions had such a qualification. Students of teachers
with a secondary level diploma (senior high school level) were more likely to have lower oral
reading fluency scores than those whose teachers had bachelor’s degrees. Unfortunately, teachers with secondary level diplomas were more common in the remote and rural areas of
Papua and Papua Barat. Less than 20% of the teachers had formal teaching qualifications.
On the other hand, the data from MOEC shows relatively different figures. In Papua and Papua
Barat, according to MOEC (2014), the percentages of teachers who hold bachelor’s degrees are 74.10% and 80.75%, respectively. In terms of the number of primary school teachers, in
2013/2014, there were 13,016 primary school teachers in Papua, and 7,062 teachers in Papua
Barat. These teachers in Papua handled 223,683 students, while the teachers in Papua Barat
handled 110,045 students. Therefore, based on these figures, the ratio of teacher vs. student
in Papua and Papua Barat is 1:17 and 1:15, respectively. Compared to the national figures, in
which the total number of primary school teachers in 2013/2014 was 1,900,831 versus the
number of students at 25,796,669, it resulted in a ratio of 1:14. Given these numbers, it seems
that statistically there are no problems in terms of teacher qualifications and teacher quantity
in these two provinces. However, the results of this baseline study tell us a relatively different
story, especially when the context of this study is about basic education in the rural and
remote areas of the Papuan provinces.
The results from an SSME survey conducted by RTI International and USAID/Indonesia in
Tenggara-Papua region was twice higher than other regions. In terms of the length of the school day,
around 30% of the schools in Maluku-NT-Papua had less than 5 hours, while the national
average is around 20%. The SSME survey also reported that around 87% of head teachers in
the Maluku-NT-Papua region observed the classroom every 2-3 months up to once a year as
compared to the national average of 60%. These findings might be among various explanations
why the performance of early grade students in eastern parts of Indonesia is lower than
others.
The above data shows the inequality of students’ access to quality education services in the eastern parts of Indonesia compared to those in the western parts. These issues are
considered as important by UNICEF Indonesia. In 2010-2013, UNICEF successfully
implemented Phase 1 of the Papua and Papua Barat Education Programme, funded by AusAID.
Following the first phase, the second phase of the program has been started to support the
district and provincial governments and key education foundations (yayasan) to facilitate
improved educational opportunities for children living in rural and remote areas of Papua and
Papua Barat to overcome the educational challenges (inequalities) in accessing and completing
quality basic education. To provide actual and current information on early grade reading and
school management, a baseline study should be conducted so that Phase 2 of the program can
be better implemented.
1.2 Objectives
The main objectives of the research are as follows:
a. To establish baseline data and information for interventions in 6 districts of Papua
and Papua Barat. The data and information covered several key indicators as outlined
in the monitoring and evaluation framework of the program. The same indicators
will be reassessed in the post-intervention study to be conducted at programme
completion in 2016.
b. To provide robust data and to address information gaps. The study was carried out at sub-district, district, and provincial levels with key informants and respondents that
include children, households/parents, communities, community leaders, religious
c. To collect and analyze data. It covered learning outcomes among students in early grades, the quality of education, school management, parents’ attitudes toward education, and information provided by education authorities.
1.3 Overview of Early Grade Reading Assessment
1.3.1 Why Test Early Grade Reading?
The Early Grade Reading Assessment (EGRA) is an oral student assessment designed to
measure the most basic foundation skills for literacy acquisition in the early grades:
recognizing letters of the alphabet, reading simple words, understanding sentences and
paragraphs, and listening with comprehension. EdData II developed the EGRA methodology
in 2006 and has applied it in 11 countries and 19 languages. It has been adopted and used by
other implementing partners in more than 30 other countries and in more than 60 other
languages. RTI International holds the current EdData II task order contract from
USAID/Washington (USAID Education Data Global, 2014).
Why early grade reading? The ability to read and understand a simple text is one of the most
fundamental skills a child can learn. Without basic literacy, there is little chance that a child
can escape the intergenerational cycle of poverty. Yet, in many countries students enrolled
in schools for as many as six years are unable to read and understand a simple text. Recent
evidence indicates that learning to read both early and at a sufficient rate are essential for
learning to read well. Acquiring literacy becomes more difficult as students grow older;
children who do not learn to read in the first few grades are more likely to repeat and
eventually drop out, while the gap between early readers and non-readers increases over
time.
Most national and international assessments are paper-and-pencil tests administered to
students in grades four and above (that is, they assume that the students can read and write).
Results for those few low-income countries that participated in PISA or TIMSS indicated that
the median child in a low-income country performed at about the third percentile of a
cannot ascertain what they did know (often because they scored so poorly that the test
could not distinguish whether the child did not know the content or simply could not read
the test).
On the other hand, EGRA is designed to orally assess the most basic foundation skills for
literacy acquisition in early grades, including pre-reading skills such as listening
comprehension. The test components are based on recommendations made by an
international panel of reading and testing experts and include timed, 1-minute assessments
of letter naming, nonsense and familiar words, and paragraph reading. Additional (untimed)
segments include comprehension, relationship to print, and dictation. In each of the language
pilots conducted to date, EGRA met psychometric standards as a reliable and valid measure
of early reading skills.
Based on the EGRA applications in more than forty countries, RTI International reported
the results thus far indicated generally low levels of student acquisition of foundation literacy
skills. To provide an overall sense of the reading levels in the countries where EGRA has
been applied, RTI International provided summary averages for oral reading fluency in terms
of correct words per minute as shown in Table 1.1. Country names have been excluded to
avoid comparisons as cross-language comparisons are not encouraged due to differences in
language structure.
Table 1.1: Oral Reading Fluency Levels (Correct Words per Minute) in EGRA
In Indonesia, a 2014 National EGRA survey revealed that the national average of correct
words per minute for second grade students was 52.1. However, this result was not
consistent across regions. Second grade students in the Jawa-Bali region significantly
outperformed all other regions, even outscoring the national average by more than 7 words
per minute. Maluku, Nusa Tenggara, and Papua, on the other hand, showed the lowest correct
words per minute at only 29.7, as shown in Table 1.2. The table may indicate the existence of
reading problems in the eastern part of Indonesia.
Table 1.2: Oral Reading Fluency Level (Correct Words Per Minute) in Indonesia EGRA
The EGRA results can be used by policy makers to identify schools with particular needs and
develop instructional approaches for improving foundation skills, for example: poor letter
naming results may indicate the need for additional alphabet exercises. In addition, based on the EGRA results, teachers may be taught to monitor students’ oral reading fluency and practice decoding strategies. In some African countries, such as Mali and Niger, EGRA results
were used to convey the development of materials and sequenced, as well as scripted teaching.
The continuous assessment strategies have demonstrated very promising results. As a result,
EGRA data is used for planning, monitoring, and evaluating education policies and programs.
RTI International (2014), however, acknowledged the limitations of EGRA and its results.
Firstly, EGRA measures a specific set of critical early grade reading skills, not necessarily all
important literacy skills. Secondly, the individual nature of assessment administration and the
size of a typical sample mean that it is usually used to report results at the district, regional,
national, or program level, not at the school or student level. Thirdly, EGRA is not a
high-stake accountability tool. Finally, the assessment is not suited for direct cross-language
comparisons, but could be used to report on the percentage of children meeting grade-level
expectations. Despite the limitations, EGRA has been applied to assess early grade reading
ability in many countries, including Indonesia, as there is no clear benchmark for reading ability
in the national curriculum.
1.3.2 What EGRA Measures
Grade 2
National 52.1
Jawa-Bali 59.2
Sumatera 47.4
The EGRA instrument consists of a variety of subtasks designed to assess foundational reading
skills that are crucial to becoming a fluent reader. EGRA measures the basic skills that a child
must possess to eventually be able to read fluently and with comprehension—the ultimate goal of reading. There are five key components of EGRA measures, namely: alphabetic
principle, phonemic awareness, fluency, vocabulary, and comprehension, which each is further
described in the following sections.
Alphabetic Principle
To learn to read, children need to be familiar with the alphabet and the written spelling
systems. An alphabetic principle is the knowledge that letters and letter sequences represent
the sounds of spoken language. EGRA subtasks that measure this skill are: letter name
identification, syllable reading, non-word decoding, and dictation.
Phonemic Awareness
Phonemic awareness is the ability to hear, manipulate and break apart the smallest units of
sounds (phonemes) in words. EGRA subtasks that measure this skill are initial sound
identification and phoneme segmentation.
Fluency
Fluency measures not only whether a child knows something (accuracy), but whether s/he has
integrated the knowledge and can process the information automatically (quickly). Oral
reading fluency is the ability to read a text out loud with speed, accuracy, and expression.
Being able to comprehend text requires being able to read words correctly at some minimal
speed per minute. An EGRA subtask that measures this skill is oral reading fluency (ORF).
Vocabulary
Vocabulary is knowledge of the meaning of words. There are two types of vocabulary:
expressive vocabulary and receptive vocabulary. Expressive vocabulary is the ability to put
words that we understand into use when we speak or write. Receptive vocabulary is the
ability to understand the meanings of words that we hear or read. EGRA subtasks that
measure these skills are oral vocabulary, reading comprehension, and listening
Comprehension
Comprehension is the ability to understand, interpret, and use what has been read.
Comprehension is dependent on all other components of reading. EGRA subtasks that
measure this skill are reading comprehension and listening comprehension.
EGRA measures each of the previously mentioned abilities/components to assess the
foundational reading skills. The skills are tested in individual subtasks and presented in order
of increased level of difficulty. Because the first few subtasks are easier, EGRA can, therefore,
measure a range of reading abilities for beginning readers.
EGRA, in Indonesia and elsewhere, is not intended to be a high-stakes accountability measure
to determine whether a student should move up to the next grade level. Additionally, EGRA
should not be used to evaluate individual teachers. The final EGRA instrument for this baseline
Table 1.3: EGRA Instrument Subtasks in a Baseline Study
Three of the subtasks were timed, namely letter sound identification, non-word reading, and
oral passage reading. Each timed subtask was administered over a one-minute period during
which the student responded to as many items in the task as possible. For scoring purposes,
the assessor noted which letters or words were read correctly/incorrectly, and at the end of
a minute, the assessor noted how many items the student attempted in the time available. The score for each timed subtask was calculated and expressed as “correct items per minute.” Therefore, these subtasks can be characterized as “fluency” measures. Non-fluency subtasks included untimed sets of questions. The results were calculated and expressed as “percentage of items correct out of total items attempted.”
1.4 Overview of the Snapshot of School Management Effectiveness
The SSME framework is based on research reported by Craig and Heneveld (1996) and
Carasco, Munene, Kasente, and Odada (1996). The SSME is an instrument that yields a quick
but rigorous and multifaceted figure of school management and pedagogic practice in a
country or region. The instrument was designed to capture “best” indicators of effective
Subtask Skill Description: the student was asked to...
Letter sound identification (timed)
Alphabetic principle: letter-sound correspondence
...say the sound each letter makes, while looking at a printed page of 100 letters of the alphabet in random order and in upper and lower case
Nonword reading (timed)
Alphabetic principle: letter-sound correspondence
Fluency- automatic decoding
...read a list of 50 nonwords printed on a page. Words were constructed from actual orthography, but were not real words in bahasa Indonesia; such as “kone”
Oral passage reading (timed)
Fluency- automatic word reading in context
... read a grade-appropriate short story out loud from a printed page
Reading comprehension Comprehension ...orally respond to 5 questions that the assesor asked about the short story
Listening comprehension
Oral language comprehension and vocabulary
...listen to a story that the assessor read out loud, then orally answer 3 questions about the story
Oral vocabulary Basic vocabulary and oral langauge comprehension
...point to body parts or objects in the room as identified by the assesor; place pencil to show understanding of prepositions
Dictation Oral comprehension; writing skills; alphabetic process
schools that, as past research has shown, affect student learning. The resulting data is designed
to let school, district, provincial, or national administrators and donors learn what is currently
occurring in their schools and classrooms and to assess how to make their schools more
effective.
Based on the framework for analyzing effective schools described in the literature about
effective schools, the SSME collects information about basic school inputs such as school
infrastructure, pedagogical materials, teacher and head teacher characteristics, student
characteristics, as well as parental and community involvement and learning outcome data, via
the application of core portions of the EGRA.
The SSME is administered during one school day by the assessor team. In this baseline study,
it was carried out in conjunction with the EGRA and in the same selected schools. Each of
the components of the SSME is designed to supply information from a different perspective.
The SSME design aims to balance the need to include a broad mix of variables—to allow potentially impactful characteristics to be identified—with the competing need to create a tool that is as undisruptive to the school day as possible. The combined components of the
SSME can produce a comprehensive figure of a school’s learning environment, and when the results from multiple schools in a region are compared, it becomes possible to account for
differences in school performance. Table 1.4 lists the SSME components in this baseline study.
Table 1.4: SSME Components in a Baseline Study
Level Main Variables to be Measured Data Sources
School
School leadership, teacher characteristics, enrollment, attendance, infrastructure and facilities, school closings
Head teacher questionnaires
Teacher characteristics and practices, pedagogical oversight
Teacher questionnaires
Infrastructure and facilities, repairs, safety, availability and use of teaching and learning materials
School and
classroom inventory
Student and Parent
Student background, interactions with the teacher, interaction with family members
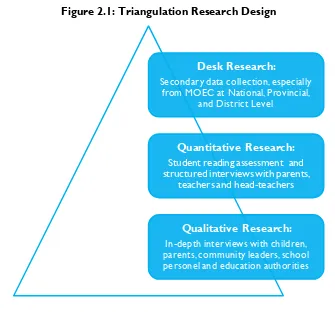
To achieve the research objectives, a triangulation research design was applied. Desk research
to collect secondary data, along with qualitative and quantitative research was carried out.
The details about this triangulation technique are displayed in Figure 2.1.
Figure 2.1: Triangulation Research Design
2.1 Desk Research
Relevant secondary data on education statistics at the local level (provincial, district, and
sub-district) along with results from previous studies, notes, and other information related to the
programme design (pillars) as well as indicators were collected and analyzed to support and
explain the findings from qualitative and quantitative research. The BPS (Statistics Indonesia),
Pusat Data dan Statistik Pendidikan (Centre for Education Data and Statistics), and MOEC
were other resources of the secondary data. The Centre was also the source of information
regarding the data on schools and student populations that was used in the sampling process.
2.2 Quantitative Research
Desk Research: Secondary data collection, especially
from MOEC at National, Provincial, and District Level
Qualitative Research: In-depth interviews with children, parents, community leaders, school personel and education authorities
Quantitative Research: Student reading assessment and structured interviews with parents,
Surveys were carried out among children, parents (households), school teachers, and head
teachers. The survey was conducted through face-to-face structured interviews. For children,
the focus of measurement was on reading skills, while for schools -through teachers and head
teachers- key school indicators such as enrollment, attendance rates, school facilities, number
of teachers, etc. were also covered in the survey. For these surveys, research instruments, in
particular reading assessment, were developed in collaboration with different experts/sources
and in consultation with the national and provincial education officials.
As the main objective of the Rural and Remote Education Initiative for Papuan Provinces are gains
in reading skills in grade 2 and 3. Thus, the instrument was designed to measure basic reading
skills among students in early grades. The sample was designed to measure reading skills of
grade 2 students. However, in certain cases where the number of grade 2 students was less
than the sample size required, then students from grade 3 were also assessed.
Meanwhile, the parent survey captured several measurements such as: children’s reading habits at home, parental and family support at home, socio-economic conditions, etc. In
addition to the student reading assessment and parent interviews, the survey also covered
snapshots on school management effectiveness. The snapshots covered teacher and head
teacher interviews, as well as observations on school and classroom facilities.
In this baseline study, research protocols of EGRA and SSME developed by RTI
International-USAID were adjusted and adapted to a Papuan context, while at the same time also referred
to international and national reading assessments (for example, EGRA, Save the Children
reading tools and the Indonesian government’s measurement- Calistung.)
Students from second grade (or in some cases they might be from third grade) were involved
with a relatively equal distribution between girls and boys. The surveys covered schools where
the UNICEF Programme is going to be implemented (intervention schools) and schools
without UNICEF’s intervention (control schools). For this baseline study, the data analysis will not be conducted separately between these school groups, as intervention schools have not
2.3 Sampling
The intervention schools that will be supported through the Rural and Remote Education
Initiative for Papuan Provinces were selected in collaboration with the District Education
Offices (DEO). The selection consisted of 120 intervention schools in 6 districts, and it would
be equally distributed across districts. Hence, each district had 20 intervention schools to
adapt 2 models of intervention:
1. Model A: Cluster, at 10 schools per district
2. Model B: On the job / in school, at 10 schools per district
Based on the calculation of the sample sufficiencies, using the below formula, each model of
intervention and control group should have at least 1,200 student samples in order to have a
5% margin of error at a 95% confidence level:
� = [���⁄� � ⁄ ]
�
As a result, we had 2,400 samples of students from the intervention schools and 1,200
students from the control schools. To achieve 1,200 samples of students per intervention
model or control school, we assessed 20 students per school. The samples were taken from
second grade students. In the case where the number of second grade students was less than
20, students from third grade were assessed to fill the gap. The following mechanism was
applied in selecting the classrooms:
1. If the school had more than one second grade classroom, and the total number of
students in each classroom was more than 20, we selected one second grade classroom
to achieve 20 students in a random manner.
2. If the school only had one second grade classroom, and the total number of students in
the classroom was more than 20, then the students from this classroom were randomly
3. If the school only had one second grade classroom and the total number of students was
less than 20, we selected students from a third grade classroom to meet the quota.
4. If the school only had one classroom for both second and third grade students, the
students were randomly selected from that classroom.
Table 2.1: Intervention Schools of the UNICEF Programs vs. Control Schools
The students were randomly selected and equally distributed between boys and girls, unless
the student population in the school could not meet this gender-balanced criterion. The
assessor made a list of the students' names from the selected classrooms, based on their
seating arrangement. The list was separated into girls' names and boys' names. Then, from
each classroom, random numbers were assigned to select the names from each list.
Pair samples of children and their parents were applied, so that the same number of parents
or caregivers was interviewed, unless the parents refused or failed to be interviewed. With
regards to the teacher sample size, from each selected school, one teacher from second grade
and one from third grade were interviewed. Consequently, there were 240 teachers from the
intervention schools and 120 from the control schools. The teacher was chosen from the
selected classroom(s). The head teacher from each sampled schools was also interviewed.
The breakdown of the number of children, parents, teachers, and head teachers that were
interviewed is shown in Table 2.2.
2.4 Qualitative Research
In-depth interviews with children, parents, community leaders, teachers, and head teachers,
along with education officers at provincial and district levels were conducted. Specific research
instruments were developed for each type of respondent. To gain insightful information during
the in-depth interviews from non-education authority respondents, especially in capturing
specific barriers of education that have been faced by them, projective techniques were
applied in the form of completion of statements and figure association. The idea behind this
technique is that people cannot, rather than will not, tell their real opinions, perceptions, or
fears. This is not a matter of will or ability. By applying this technique, the interviewees were
encouraged to project their feelings and thoughts through pictures or a completion of
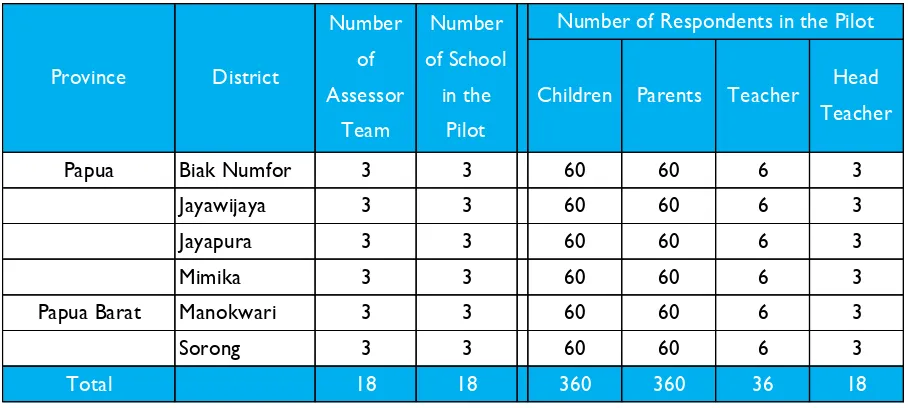
statements. The number of in-depth interviews in this baseline survey is shown in Table 2.3.
Table 2.3: Number of In-depth Interviews
In addition to the above in-depth interviews, we also observed a few teachers while they were
delivering Bahasa Indonesia lessons to their students. The observations were conducted by
recording the process in 2 x 25 minutes. The number of observations conducted is shown in
Table 2.4. The records of the observation were analyzed separately by the UNICEF’s Education Team.
Table 2.4: Number of Teaching Processes Recorded Type of
Respondents
Papua Papua Barat
Biak Numfor Jayawijaya Jayapura Mimika Manokwari Sorong
Children 5 5 5 5 5 5
Parents 5 5 5 5 5 5
Teacher 5 5 5 5 5 5
Head Teacher 5 5 5 5 5 5
Community Leaders 5 5 5 5 5 5
MOEC at District &
Provincial Level 2 2 2 2 2 2
Grand Total 162
Province District Number of Teaching Recording: Model A
Number of Teaching Recording: Model B
Number of Teaching Recording: Control
Schools
Papua
Biak Numfor 3 3 3
Jayawijaya 3 3 3
Jayapura 3 3 3
Mimika 3 3 3
Papua Barat Manokwari 3 3 3
Sorong 3 3 3
2.5 Research Ethics on Vulnerable Populations and Children
All of the respondents’ rights in this survey were strictly protected. As this survey involved children and adults living in rural areas with a relatively low level of education and low
socio-economic conditions, ethics on vulnerable populations and children were applied.
For child respondents in this survey, their participation was protected according to the
UNICEF’s Guidelines (2002). The convention on the rights of the children’s participation in this research is:
1. All rights must be available to all children without discrimination of any kind. Equity and
non-discrimination should be emphasized.
2. The best interests of the child must be a major factor in all actions concerning children.
3. Children’s views must be considered and taken into account in all matters that affect them. They should not be used merely as data subjects of an investigation.
In addition, the children and other vulnerable populations in this survey were fully informed
and had to understand the consequences and impact of expressing their opinions. They were
free to not participate and were not pressured. Their participation was a right, not an
obligation.
Based on the guidelines, the followings were implemented during the data collection to ensure the respondents’ rights:
1. Ensured the confidentiality of the respondents: their names were not included in the
information to be collected.
2. Informed the respondents: the respondents were informed about the purpose of the
interviews and the general steps of the interviews. They could feel free to answer or to
express their opinions, they did not have to answer the questions if they did not want
to, etc.
3. Consent was sought by asking for their oral agreement to participate in the study.
4. Equity and non-discrimination were strictly applied through the random selection of the
students, parents, and teachers. More specifically, the socio-economic conditions of the
5. Respect of respondents and their views was applied through the questionnaire design.
For the child respondents, a participatory and friendly questionnaire was designed.
2.6 Recruitment and Training of Assessors
For the quantitative survey, the data was collected by local assessors, while the in-depth interviews of the qualitative research were conducted by Myriad’s researchers. Myriad recruited and trained the assessors to collect the data at the school level.
The assessors were recruited from local universities located in Papua and Papua Barat. Based on Myriad’s experiences in conducting the EGRA survey under RTI International -funded by USAID, college students from local universities provided optimal results as they spoke local
languages and they were accustomed to the local culture. Therefore, university students
enrolled in local higher education institutions located in each district were recruited.
The assessors were grouped into 4 persons per team. They collected the data from children,
parents, teachers, and head teachers in a 3-day assessment period per school. One of the
team members was assigned as the team leader with certain roles such as acting as the
spokesperson of the team in the school visit, checking the quality of his team members in the
data collection process, and leading and motivating the team members during data collection.
The total number of teams and assessors was 18 teams with 72 assessors.
After the selection had been completed, the assessors were trained by Myriad Team on how
to implement the research instruments in the field. Five days of training were carried out to
cover all research instruments, sampling methods, research areas, and logistical aspects. Six
trainers were assigned to train assessors of each district, so that the training was conducted
2.7 Piloting the Research Instruments
Piloting the research instruments was conducted prior to the data collection. The main
objective of the piloting was to implement research instruments in a real situation so that
challenges could be identified and overcome, and adjustments could be made. Piloting was
carried out after the assessor training workshop in 6 targeted districts. Each assessor team
carried out a pilot in 1 school, which resulted in a total of 18 schools. The activity was
completed in 3 days, with details as explained in Table 2.5.
Table 2.5: Piloting the Research Instruments
After the pilot program, no major adjustments were made on the research instruments except
for a few minor changes in the flow of the SSME questions to make the interviews flow
smoothly.
2.8 Data Collection
A Computer Assisted Personal Interview (CAPI) was applied using Nexus Tablet. Research
instruments were loaded into the electronic device. The main reason for applying the CAPI
technique was two-fold. First, it was more efficient as the data was automatically punched and
stored in the Myriad server. In other words, no data entry was required. Second, quality Children Parents Teacher Head
Teacher
Papua Biak Numfor 3 3 60 60 6 3
Jayawijaya 3 3 60 60 6 3
Jayapura 3 3 60 60 6 3
Mimika 3 3 60 60 6 3
Papua Barat Manokwari 3 3 60 60 6 3
Sorong 3 3 60 60 6 3
Total 18 18 360 360 36 18
Number of Respondents in the Pilot
Province District
Number of Assessor
Team
Number of School
control of the data collection could be optimized as the date, time, and GPS of the school
location could be monitored from the device.
The step-by-step activities that were carried out by each assessor team in each school are as
follows:
a. The assessors introduced themselves and sought permission from the head teacher upon
their arrival. The team leader explained the purpose of the assessment. A room for
assessment was requested, such as in the library, an extra curricula room, empty
classroom, etc.
b. The assessor team selected the second grade classroom with the mechanism that was
explained in the previous sub-section. If required, third grade students were also
involved. A simple random sampling was applied.
c. The assessor team chose 20 students from the selected classrooms. The names of the
students were listed on two separate lists: boys and girls based on their seating
arrangement. The assessor team requested random numbers from their electronic device
in order to select the students.
d. Selected students were then taken to the assessment room one by one until all 20
students completed the interviews.
e. Two teachers from the selected classroom (observing gender balance) were randomly
chosen using a simple random sample method. Teacher interviews were conducted after
the students were interviewed.
f. Lastly, the head teacher was interviewed.
g. Parallel with the school assessment, two assessors from the team started interviews with
the parents or the caregivers. Home interviews were conducted. The addresses of the
selected students were requested from the head teacher.
h. Each assessor team assessed one school for 3 days. Therefore, the total number of survey
days was around 30 days.
For the in-depth interviews, the following are the step-by-step activities:
a. The key informants were identified and then approached to be interviewed. Children
procedure was applied to the teachers. Meanwhile, the head teachers were selected
from the same schools of the selected children and teachers.
b. The community leaders were identified prior to the data collection. Advice from
UNICEF was sought to determine the key informants.
c. Similarly, the key informants from MOEC at the provincial and district levels were also
identified and advice from UNICEF was also requested.
2.9 Final Sample
The numbers attained for the final sample in the data collection are presented in Table 2.6.
The total number of schools that were assessed is 180, equally distributed across districts.
The number of head teachers planned to be interviewed was 180. However, the head teachers
in one school in Mimika and one in Jayawijaya could not be interviewed as they were
unavailable at school during the three days of assessment. None of the senior teachers or
assistant head teachers was also available to be interviewed then. Similarly, the number of
teachers that had been interviewed was also under the target. The total sample of teachers
to be interviewed was 360, consisting of two teachers per school as the sample. However,
in some schools, there was only one teacher who taught early grade classes.
The number of students in the sample was also under the target. Each district was planned to
have a sample size of 600 students. However, the real condition in the field revealed that not
all schools had 20 students from second and third grades. In addition, during the three days
of assessment, not all students of the early grades came to school. In regards to the parents,
not all parents provided a positive response to be interviewed. Some of them did not want
to participate in this study.
In terms of the number of school observations, all schools were observed by the assessors,
and this resulted in 100% achievement. However, the classroom observations were under
Table 2.6: Final Sample
In terms of school profiles, 62% of the sampled schools were public schools, and the remaining
38% were private schools. Mimika was represented by the highest percentage of private
schools as compared to other districts. In contrast, Manokwari had the highest percentage of
public schools.
Table 2.7: Final Sample, by School Types Province District
Type of Respondent
School Head
Teacher Teacher Students Parents
School Inventory
Classroom Inventory
Papua
Biak 30 30 60 541 541 30 54
Jayapura 30 30 59 541 500 30 48
Mimika 30 29 58 459 369 30 53
Jayawijaya 30 29 55 520 448 30 55
Papua Barat Manokwari 30 30 51 395 366 30 49
Sorong 30 30 47 478 421 30 44
Total 180 178 330 2934 2645 180 303
Public School Private School
All Papua 62% 38%
Biak 60% 40%
Jayapura 63% 37%
Mimika 53% 47%
Jayawijaya 70% 30%
Manokwari 87% 13%
3.1 The Student Profiles and Their Voices
The students in this baseline study consisted of almost an equal proportion of boys (51%) and
girls (49%) across all districts. The majority of the students were in the second grade (66%),
and the rest (34%) were third grade students. In terms of age, 60% of them were 6-8 years
old, 37% were 9-11 years old, and the remaining 3% were over 11 years old. All the districts
had second and third grade students at the age of 12 years old and over.
Table 3.1: Student Age Ranges by District
District
Student Ages
6-8 y.o 9-11 y.o 12 y.o or more
Biak 64% 34% 2%
Jayapura 61% 37% 2%
Mimika 55% 40% 5%
Jayawijaya 56% 40% 4%
Manokwari 52% 42% 6%
Sorong 60% 37% 3%
Half of the students (56%) stated that they attended pre-school, while the other half (43%)
said that they never did. As a comparison, at the national level, 80% of early grade students
attended the pre-school. Looking at the district level, Jayawijaya and Sorong had the largest
number of students who said that they never attended pre-school. In contrast, the majority
Table 3.2: Pre-School Attendance
Some of the students in this baseline study (7%) said that they were afraid to go to school.
Higher percentages of students in Sorong, Mimika, and Jayawijaya said that they were afraid
to go to school compared to students in the other studied districts.
Table 3.3: Afraid of Going to School
District
Students Afraid of Going to School
Yes No
Biak 3% 97%
Jayapura 4% 96%
Mimika 12% 88%
Jayawijaya 9% 91%
Manokwari 3% 97%
Sorong 14% 86%
District
Attended Pre-School (PAUD/ TK)
Yes No
National 80% 20%
Biak 52% 48%
Jayapura 82% 18%
Mimika 65% 35%
Jayawijaya 24% 76%
Manokwari 77% 23%
Sorong 45% 55%
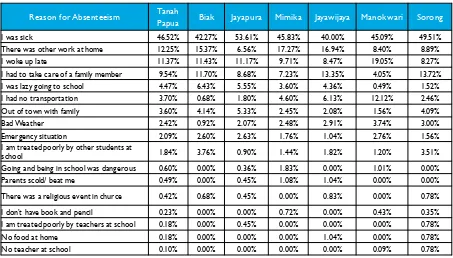
In terms of the students’ absenteeism and tardiness, almost half of the students admitted that they were absent (53%) or came late to school (59%) in the past week. Across all districts,
illness was the main reason for absenteeism (46.52%), while having to work at home was
revealed as the second main reason (12.25%). Other reasons for the students’ absenteeism were related to socio-economic and geographical disadvantages such as having no
transportation, dealing with bad weather, being treated poorly by other students or by
teachers, being without food at home, and having no teacher at school. A relatively similar pattern of the main reasons for students’ absenteeism was identified across all districts.
Table 3.4: Student Absenteeism and Tardiness
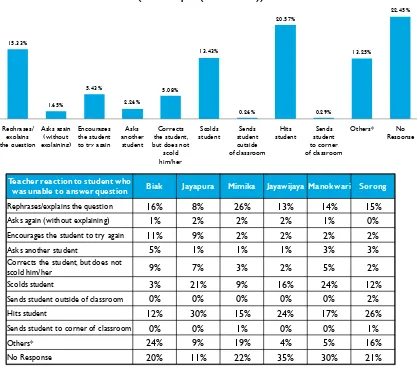
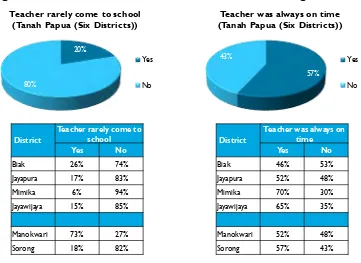
The teachers’ attendance in school was observed by the students, as 11% of the students stated that their teacher was not always in school. Jayawijaya and Sorong had a relatively
higher level of teacher absenteeism compared to other districts according to the students.
Reason for Absenteeism Tanah
Papua Biak Jayapura Mimika Jayawijaya Manokwari Sorong
I was sick 46.52% 42.27% 53.61% 45.83% 40.00% 45.09% 49.51%
There was other work at home 12.25% 15.37% 6.56% 17.27% 16.94% 8.40% 8.89%
I woke up late 11.37% 11.43% 11.17% 9.71% 8.47% 19.05% 8.27%
I had to take care of a family member 9.54% 11.70% 8.68% 7.23% 13.35% 4.05% 13.72%
I was lazy going to school 4.47% 6.43% 5.55% 3.60% 4.36% 0.49% 1.52%
I had no transportation 3.70% 0.68% 1.80% 4.60% 6.13% 12.12% 2.46%
Out of town with family 3.60% 4.14% 5.33% 2.45% 2.08% 1.56% 4.09%
Bad Weather 2.42% 0.92% 2.07% 2.48% 2.91% 3.74% 3.00%
Emergency situation 2.09% 2.60% 2.63% 1.76% 1.04% 2.76% 1.56%
I am treated poorly by other students at
school 1.84% 3.76% 0.90% 1.44% 1.82% 1.20% 3.51%
Going and being in school was dangerous 0.60% 0.00% 0.36% 1.83% 0.00% 1.01% 0.00%
Parents scold/ beat me 0.49% 0.00% 0.45% 1.08% 1.04% 0.00% 0.00%
There was a religious event in churce 0.42% 0.68% 0.45% 0.00% 0.83% 0.00% 0.78%
I don’t have book and pencil 0.23% 0.00% 0.00% 0.72% 0.00% 0.43% 0.35% I am treated poorly by teachers at school 0.18% 0.00% 0.45% 0.00% 0.00% 0.00% 0.78%
No food at home 0.18% 0.00% 0.00% 0.00% 1.04% 0.00% 0.78%