©2013 he International Institute for Sustainable Development Published by the International Institute for Sustainable Development.
international institute for sustainable Development
he International Institute for Sustainable Development (IISD) contributes to sustainable development by advancing policy recommendations on international trade and investment, economic policy, climate change and energy, and management of natural and social capital, as well as the enabling role of commu-nication technologies in these areas. We report on international negotiations and disseminate knowledge gained through collaborative projects, resulting in more rigorous research, capacity building in develop-ing countries, better networks spanndevelop-ing the North and the South, and better global connections among researchers, practitioners, citizens and policy-makers.
IISD’s vision is better living for all—sustainably; its mission is to champion innovation, enabling societies to live sustainably. IISD is registered as a charitable organization in Canada and has 501(c)(3) status in the United States. IISD receives core operating support from the Government of Canada, provided through the International Development Research Centre (IDRC), from the Danish Ministry of Foreign Afairs and from the Province of Manitoba. he Institute receives project funding from numerous governments inside and outside Canada, United Nations agencies, foundations and the private sector.
Head ofice
161 Portage Avenue East, 6th Floor Winnipeg, Manitoba
Canada R3B 0Y4 Tel: +1(204)958-7700 Fax: +1(204) 958-7710 Website: www.iisd.org
Written by Julie Dekens and Matt McCandless August 2013
ment Agency and ADRA.
he manual is adapted from the Community Based Risk Screening Tool – Adaptation and Livelihoods (CRiSTAL) framework, which was developed by IISD and three other partners to help project managers and planners design activities that support adaptation to climate variability and change at the community level. IISD tested a irst version of this manual during a training of trainers (ToT) session conducted in May 2013 in Kayonza District.
Feedback collected from participants during this pilot test has been incorporated in the current version of the manual. his manual is a living document. It is expected that updated versions will be developed in the future in response to additional experiences in the ield. You are invited to send your feedback to [email protected].
he authors would also like to thank Jo-Ellen Parry from IISD and Vincent Okello and Allan Shin Seung-hwan from ADRA for providing useful comments and feedback on drats of this manual.
Photo Credits:
ClimAte risk mAnAgement for loCAl AgriCulturAl CooPerAtives in rwAnDA
Contents
module 1. About this manual: 10 key questions ... 6
What Is the Issue his Manual Aims to Address? ... 6
What Is the Purpose of his Manual? ... 6
Who Is the Intended Audience? ... 6
How Is his Manual Used? ... 7
When Should his Manual Be Used? ... 7
How Is the Manual Structured? ... 7
How Long Does it Take to Apply the Manual? ... 7
Where Should the Manual Be Applied? ... 7
What Resources Are Needed? ... 7
How to Record the Information? ... 7
module 2. About the Approach: 10 step-by-step instructions ... 8
Phase a: Understand the business context ... 9
Step 1: Map the key elements of the selected agricultural value chain ... 9
Step 2: Map the location of key activities in the area where the business operates ... 10
Step 3: Map the timing of key activities throughout the year (optional, if time permits) ... 11
Step 4: Identify the inputs, outputs, and external services most important to the selected chain ... 12
Phase B: Understand the climate context ... 13
Step 5: Summarize information on observed and projected climate change in the area where the selected cooperative operates ... 13
Step 6: Map the key climate and non-climate hazards afecting the selected value chain ... 14
Phase C: evaluate the implications for the cooperative ... 15
Step 7: Identify the business’s most climate-sensitive inputs, outputs and external services ... 15
Step 8: Explore climate impacts at each stage of the selected value chain ... 16
Step 9: Explore climate responses at each stage of the selected value chain ... 17
module 3. the maisha Bora Cooperative Case study ... 19
Business Context ... 19
Climate Context ... 19
Implications for the Cooperative ... 20
references and Additional resources ... 21
Annex 1: key concepts (in the context of this manual) ... 22
Annex 2: reporting tables (with examples of completed tables) ... 24
list of figures Figure 1. Example of a value chain mapping exercise. ... 9
Figure 2. Map showing the geographic low (black arrows) of maize. ... 10
Figure 3. Focus group discussion with the results of an input matrix on top let of the wall... 12
Figure 4. Example of a climate hazard map at the production level of the maize value chain. ... 14
Figure 5. Focus group discussions with the members of a maize cooperative in Eastern Rwanda. ... 15
Figure 6. A participant presents the results of a group discussion on climate impacts and responses along the maize value chain in Eastern Rwanda. ... 18
list of tables Table 1: Impacts of climate hazards on the demand and supply sides of a speciic value chain ... 6
Table 2. Resources required to conduct the training ... 7
Table 3. Overall framework for data collection and analysis ... 8
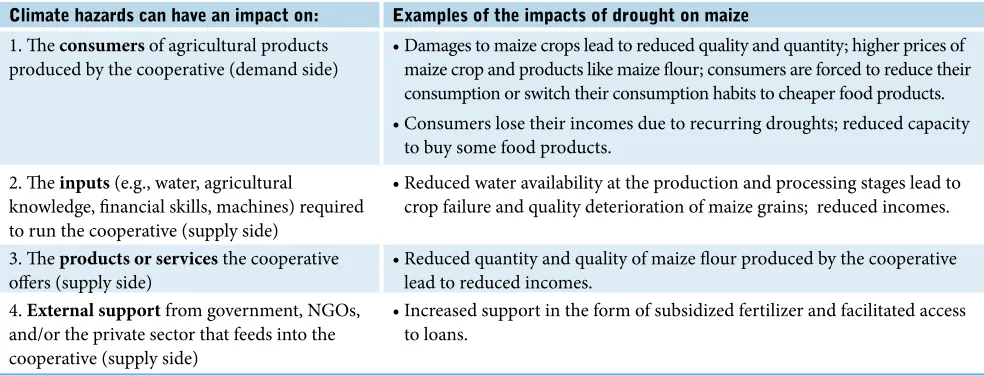
table 1: impacts of climate hazards on the demand and supply sides of a speciic value chain
Climate hazards can have an impact on: examples of the impacts of drought on maize
1. he consumers of agricultural products produced by the cooperative (demand side)
• Damages to maize crops lead to reduced quality and quantity; higher prices of maize crop and products like maize lour; consumers are forced to reduce their consumption or switch their consumption habits to cheaper food products. • Consumers lose their incomes due to recurring droughts; reduced capacity
to buy some food products.
2. he inputs (e.g., water, agricultural
knowledge, inancial skills, machines) required to run the cooperative (supply side)
• Reduced water availability at the production and processing stages lead to crop failure and quality deterioration of maize grains; reduced incomes.
3. he products or services the cooperative ofers (supply side)
• Reduced quantity and quality of maize lour produced by the cooperative lead to reduced incomes.
4. external support from government, NGOs, and/or the private sector that feeds into the cooperative (supply side)
• Increased support in the form of subsidized fertilizer and facilitated access to loans.
module 1.
About this manual: 10 key questions
1. what is the issue this manual Aims to Address?
With its National Cooperatives Promotion Policy, the Government of Rwanda is encouraging com-munity self-development through cooperatives. Like any venture, local cooperatives should devel-op business plans, or detailed action programs or roadmaps specifying their objectives, product(s), target market(s) and capital requirements.
Risk assessment and management should be a key component of these business plans. It refers to the process of identifying the main risks or factors that can hamper a business’s performance and designing strategies to minimize and, if possible, take advantage of these risks. Risks may be inancial (e.g., market price luctuation), environmental (e.g., deforestation), political (e.g., change in trade policy), socioeconomic (e.g., changes in consumer preferences), and techno-logical (e.g., infrastructure failures).
In Rwanda, where most agriculture is rain fed, the production of agro-products is very dependent on climatic conditions. As such, climate risks (i.e., risks
from climate variability and change) are one of the key factors that inluence the competitiveness of lo-cal agricultural cooperatives. Climate risks can have impacts on both the demand and supply sides of a speciic value chain as described in Table 1.
2. what is the Purpose of this manual?
his guide seeks to support the integration of mea-sures that address climate variability and change into agricultural cooperatives’ activities to ensure long-term sustainability of investments and reduce the exposure and vulnerability of business activities to actual and expected climatic changes.
3. who is the intended Audience?
minimize and, if possible, take advantage of these risks. his is done by taking a value chain ap-proach through an analysis of the links between climate hazards and agricultural production along the length of a value chain (from production to marketing and consumption) identiied as most important to the selected cooperative.
5. when should this manual Be used?
his manual can be used at diferent stages of a business cycle:
• at the planning stage, to inform the develop-ment of a cooperative’s business plan (risk man-agement analysis) or a project proposal.
• at the implementation stage, to revise a business plan, existing activities and/or develop new ones taking into account climate risks.
• at the monitoring and evaluation stage, to eval-uate progress toward climate risk management (or climate adaptation). he manual can be irst used at time A to create a baseline for monitor-ing and evaluation and then at time B to measure progress made towards climate risk management.
6. How is the manual structured?
his manual is organized in three modules. Fol-lowing this introduction (Module 1), the manual provides step-by-step instructions for data collec-tion and analysis (Module 2) and a case study of a local agro-cooperative focusing on the maize value
of completed reporting tables.
7. How long Does it take to Apply the manual?
he time required for the training can vary accord-ing to the objectives, the number of participants, the size of the cooperative, the number and com-plexity of the value chain(s) selected, and the bud-get and time available. Ideally, users should plan for between two and three days.
8. where should the manual Be Applied?
While this manual is speciically designed for use in Rwanda, it could be applied in other contexts where farmers’ associations and local coopera-tives are involved in value addition of agricultural products. he training should take place in the area where the selected cooperative operates.
9. what resources Are needed?
Table 2 (below) lists the resources required to con-duct the training.
10. How to record the information?
[image:7.612.36.536.505.694.2]It is extremely important that the training organizer document the entire process by taking detailed notes of all the discussions (formal and informal) and pho-tos of all key outputs (e.g., maps, tables, group dis-cussions). Speciic attention should be paid to docu-ment the participants’ narratives in their own words and to distinguish in the analysis “what people say” from the organizer’s analysis of “what people say.”
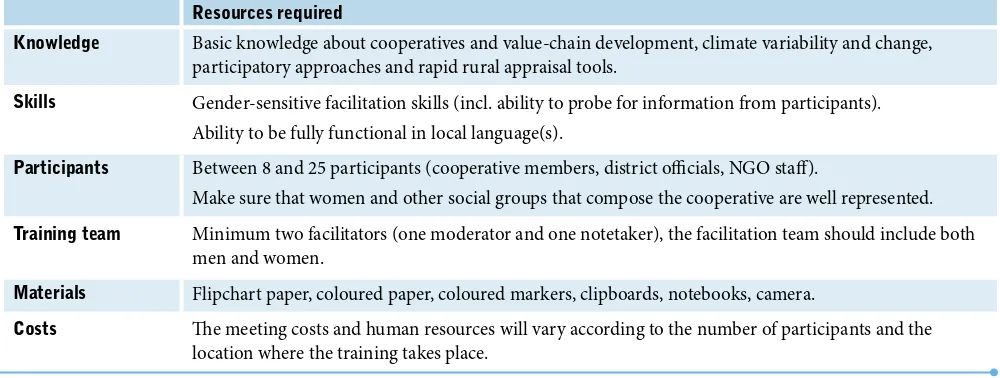
table 2. resources required to conduct the training
resources required
knowledge Basic knowledge about cooperatives and value-chain development, climate variability and change, participatory approaches and rapid rural appraisal tools.
skills Gender-sensitive facilitation skills (incl. ability to probe for information from participants).
Ability to be fully functional in local language(s).
Participants Between 8 and 25 participants (cooperative members, district oicials, NGO staf).
Make sure that women and other social groups that compose the cooperative are well represented.
training team Minimum two facilitators (one moderator and one notetaker), the facilitation team should include both men and women.
materials Flipchart paper, coloured paper, coloured markers, clipboards, notebooks, camera.
module 2.
About the Approach:
10 step-by-step instructions
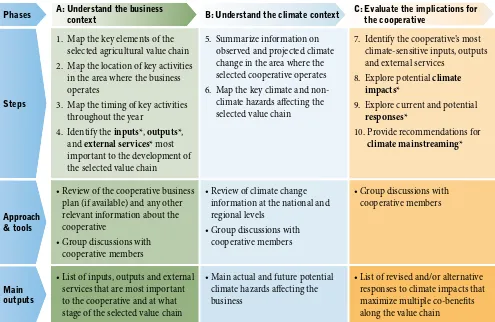
Table 3 provides an overview of the approach used to integrate climate adaptation* into the speciic value chain(s)* selected. Data collection and analysis are organized according to a 10-step process (described in details in this module), divided into three stages that aim to:
A. understand the business context: he “what,” “where,” and “when” of the selected agricultural value chain*.
B. understand the climate context:he location, frequency* and intensity* of climate hazards* cur-rently and in the future in the context of climate change* in the area where the cooperative* operates.
[image:8.612.80.575.366.688.2]C. evaluate the implications of different climate hazards for the cooperative: he impacts of climate haz-ards on each stage of the selected value chain and the current and alternative responses* to support climate adaptation.
table 3. overall framework for data collection and analysis
Phases A: understand the business
context B: understand the climate context
C: evaluate the implications for the cooperative
steps
1. Map the key elements of the selected agricultural value chain 2. Map the location of key activities
in the area where the business operates
3. Map the timing of key activities throughout the year
4. Identify the inputs*, outputs*, and external services* most important to the development of the selected value chain
5. Summarize information on observed and projected climate change in the area where the selected cooperative operates 6. Map the key climate and non-climate hazards afecting the selected value chain
7. Identify the cooperative’s most climate-sensitive inputs, outputs and external services
8. Explore potential climate impacts*
9. Explore current and potential responses*
10. Provide recommendations for climate mainstreaming*
Approach & tools
• Review of the cooperative business plan (if available) and any other relevant information about the cooperative
• Group discussions with cooperative members
• Review of climate change information at the national and regional levels
• Group discussions with cooperative members
• Group discussions with cooperative members
main outputs
• List of inputs, outputs and external services that are most important to the cooperative and at what stage of the selected value chain
• Main actual and future potential climate hazards afecting the business
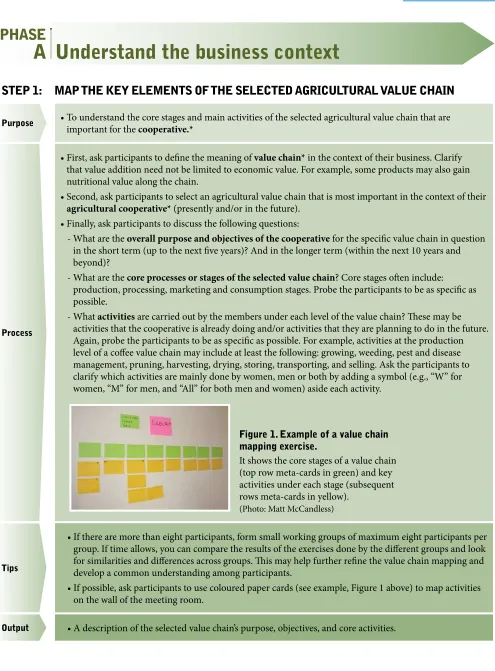
steP 1: mAP tHe key elements of tHe seleCteD AgriCulturAl vAlue CHAin
Purpose • To understand the core stages and main activities of the selected agricultural value chain that are
important for the cooperative.*
Process
• First, ask participants to deine the meaning of value chain* in the context of their business. Clarify that value addition need not be limited to economic value. For example, some products may also gain nutritional value along the chain.
• Second, ask participants to select an agricultural value chain that is most important in the context of their
agricultural cooperative* (presently and/or in the future).
• Finally, ask participants to discuss the following questions:
- What are the overall purpose and objectives of the cooperative for the speciic value chain in question in the short term (up to the next ive years)? And in the longer term (within the next 10 years and beyond)?
- What are the core processes or stages of the selected value chain? Core stages oten include: production, processing, marketing and consumption stages. Probe the participants to be as speciic as possible.
[image:9.612.41.536.49.720.2]- What activities are carried out by the members under each level of the value chain? hese may be activities that the cooperative is already doing and/or activities that they are planning to do in the future. Again, probe the participants to be as speciic as possible. For example, activities at the production level of a cofee value chain may include at least the following: growing, weeding, pest and disease management, pruning, harvesting, drying, storing, transporting, and selling. Ask the participants to clarify which activities are mainly done by women, men or both by adding a symbol (e.g., “W” for women, “M” for men, and “All” for both men and women) aside each activity.
figure 1. example of a value chain mapping exercise.
It shows the core stages of a value chain (top row meta-cards in green) and key activities under each stage (subsequent rows meta-cards in yellow).
(Photo: Matt McCandless)
tips
• If there are more than eight participants, form small working groups of maximum eight participants per
group. If time allows, you can compare the results of the exercises done by the diferent groups and look for similarities and diferences across groups. his may help further reine the value chain mapping and develop a common understanding among participants.
• If possible, ask participants to use coloured paper cards (see example, Figure 1 above) to map activities
on the wall of the meeting room.
output • A description of the selected value chain’s purpose, objectives, and core activities.
moDule 2. About the Approach: 10 step-by-step instructions
steP 2: mAP tHe loCAtion of key ACtivities in tHe AreA wHere tHe Business
oPerAtes
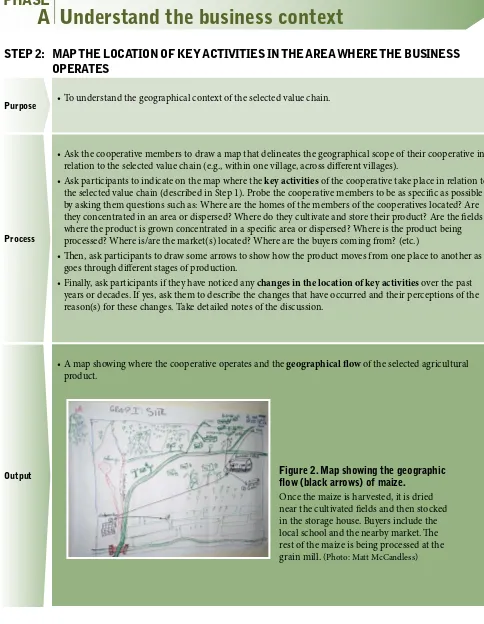
Purpose • To understand the geographical context of the selected value chain.
Process
• Ask the cooperative members to draw a map that delineates the geographical scope of their cooperative in
relation to the selected value chain (e.g., within one village, across diferent villages).
• Ask participants to indicate on the map where the key activities of the cooperative take place in relation to the selected value chain (described in Step 1). Probe the cooperative members to be as speciic as possible by asking them questions such as: Where are the homes of the members of the cooperatives located? Are they concentrated in an area or dispersed? Where do they cultivate and store their product? Are the ields where the product is grown concentrated in a speciic area or dispersed? Where is the product being processed? Where is/are the market(s) located? Where are the buyers coming from? (etc.)
• hen, ask participants to draw some arrows to show how the product moves from one place to another as it
goes through diferent stages of production.
• Finally, ask participants if they have noticed any changes in the location of key activities over the past years or decades. If yes, ask them to describe the changes that have occurred and their perceptions of the reason(s) for these changes. Take detailed notes of the discussion.
output
[image:10.612.78.562.84.708.2]• A map showing where the cooperative operates and the geographical low of the selected agricultural product.
figure 2. map showing the geographic low (black arrows) of maize.
Once the maize is harvested, it is dried near the cultivated ields and then stocked in the storage house. Buyers include the local school and the nearby market. he rest of the maize is being processed at the grain mill. (Photo: Matt McCandless)
understand the business context
PHAse
steP 3: mAP tHe timing of key ACtivities tHrougHout tHe yeAr (oPtionAl, if
time Permits)
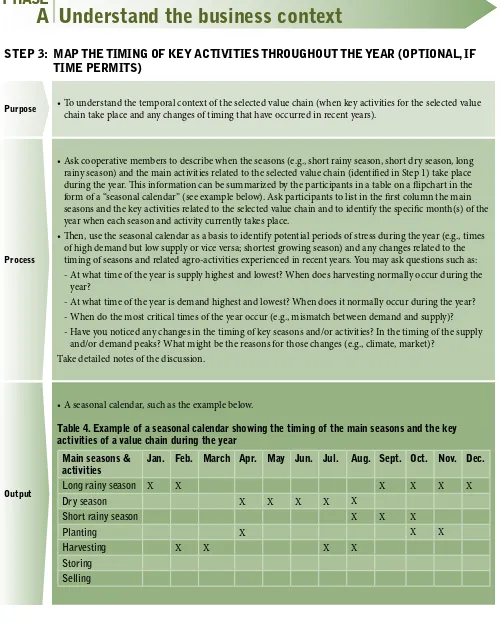
Purpose • To understand the temporal context of the selected value chain (when key activities for the selected value
chain take place and any changes of timing that have occurred in recent years).
Process
• Ask cooperative members to describe when the seasons (e.g., short rainy season, short dry season, long
rainy season) and the main activities related to the selected value chain (identiied in Step 1) take place during the year. his information can be summarized by the participants in a table on a lipchart in the form of a “seasonal calendar” (see example below). Ask participants to list in the irst column the main seasons and the key activities related to the selected value chain and to identify the speciic month(s) of the year when each season and activity currently takes place.
• hen, use the seasonal calendar as a basis to identify potential periods of stress during the year (e.g., times
of high demand but low supply or vice versa; shortest growing season) and any changes related to the timing of seasons and related agro-activities experienced in recent years. You may ask questions such as: - At what time of the year is supply highest and lowest? When does harvesting normally occur during the
year?
- At what time of the year is demand highest and lowest? When does it normally occur during the year? - When do the most critical times of the year occur (e.g., mismatch between demand and supply)? - Have you noticed any changes in the timing of key seasons and/or activities? In the timing of the supply
and/or demand peaks? What might be the reasons for those changes (e.g., climate, market)? Take detailed notes of the discussion.
output
[image:11.612.38.538.85.708.2]• A seasonal calendar, such as the example below.
table 4. example of a seasonal calendar showing the timing of the main seasons and the key activities of a value chain during the year
main seasons & activities
Jan. feb. march Apr. may Jun. Jul. Aug. sept. oct. nov. Dec.
long rainy season X X X X X X
dry season X X X X X
short rainy season X X X
planting X X X
Harvesting X X X X
storing selling
moDule 2. About the Approach: 10 step-by-step instructions
steP 4: iDentify tHe inPuts, outPuts, AnD externAl serviCes most imPortAnt
to tHe seleCteD CHAin
Purpose • To prioritize the resources (inputs, outputs and external services) most necessary to the cooperative at each
stage of the selected value chain.
Process
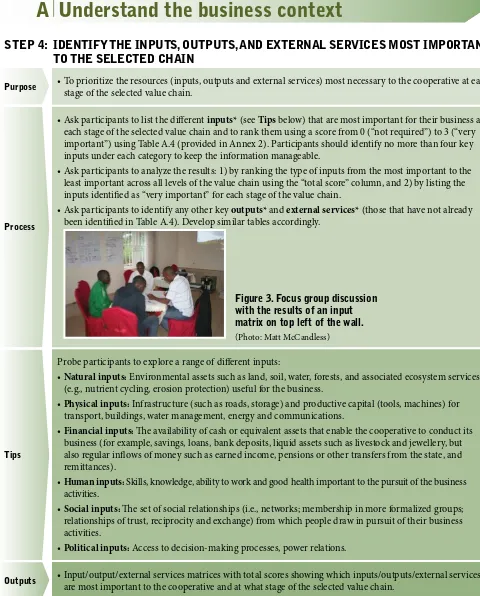
• Ask participants to list the diferent inputs* (see Tips below) that are most important for their business at each stage of the selected value chain and to rank them using a score from 0 (“not required”) to 3 (“very important”) using Table A.4 (provided in Annex 2). Participants should identify no more than four key inputs under each category to keep the information manageable.
• Ask participants to analyze the results: 1) by ranking the type of inputs from the most important to the
least important across all levels of the value chain using the “total score” column, and 2) by listing the inputs identiied as “very important” for each stage of the value chain.
• Ask participants to identify any other key outputs* and external services* (those that have not already been identiied in Table A.4). Develop similar tables accordingly.
[image:12.612.79.559.91.687.2]
figure 3. focus group discussion with the results of an input matrix on top left of the wall.
(Photo: Matt McCandless)
tips
Probe participants to explore a range of diferent inputs:
• Natural inputs: Environmental assets such as land, soil, water, forests, and associated ecosystem services (e.g., nutrient cycling, erosion protection) useful for the business.
• Physical inputs: Infrastructure (such as roads, storage) and productive capital (tools, machines) for transport, buildings, water management, energy and communications.
• Financial inputs: he availability of cash or equivalent assets that enable the cooperative to conduct its business (for example, savings, loans, bank deposits, liquid assets such as livestock and jewellery, but also regular inlows of money such as earned income, pensions or other transfers from the state, and remittances).
• human inputs: Skills, knowledge, ability to work and good health important to the pursuit of the business activities.
• social inputs: he set of social relationships (i.e., networks; membership in more formalized groups; relationships of trust, reciprocity and exchange) from which people draw in pursuit of their business activities.
• Political inputs: Access to decision-making processes, power relations.
outputs • Input/output/external services matrices with total scores showing which inputs/outputs/external services
are most important to the cooperative and at what stage of the selected value chain.
understand the business context
PHAse
steP 5: summArize informAtion on oBserveD AnD ProJeCteD ClimAte CHAnge
in tHe AreA wHere tHe seleCteD CooPerAtive oPerAtes
Purpose • To understand the climate context in Rwanda with a speciic focus on the region where the selected
cooperative operates.
Process
• Before the training, review key sources of information on climate change* in Rwanda. (See Tips below)
• Provide a clear deinition of key terms and make sure participants understand the diference between
weather* and climate* and between climate variability* and climate change.*
• Summarize and present to the members of the cooperative key information on:
- Current and past changes in climate conditions and extremes that have occurred over the past decades in the business area preferably based on peer-reviewed sources, oicial government reports, and completed by consultations done at the local level.
- Future changes in temperature, rainfall, extreme weather events and any other important phenomena based on scientiic sources only.
• his information can be summarized on a lipchart using bullet points. If possible, ask participants to take
a few minutes to summarize key results in Table B.5 presented in Annex 2 so that all members internalize the information.
tips
• In Rwanda, the Ministry of Lands and environment (MINeLa) is responsible for designing the state policy related to environment protection, conservation and management, including climate change. he Rwanda environment Management authority housed in the MINELA is responsible for policy implementation and the Rwanda Meteorological services in the Ministry of Infrastructure is responsible for forecasts and warnings of weather, climate, water and related environmental elements.
• Key national documents on climate change include: the National Adaptation Programme of Action (2006), the National Strategy on Climate Change and Low Carbon Development (2011) and the Second National Communication to the United Nations Framework Convention on Climate Change (2012) (see References section).
• For general information on climate change in Africa (including regional East African information), refer to
the Intergovernmental Panel on Climate Change (IPCC) especially Boko et al. (2007) and Christensen et al. (2007) (see References section).
moDule 2. About the Approach: 10 step-by-step instructions
steP 6: mAP tHe key ClimAte AnD non-ClimAte HAzArDs AffeCting tHe
seleCteD vAlue CHAin
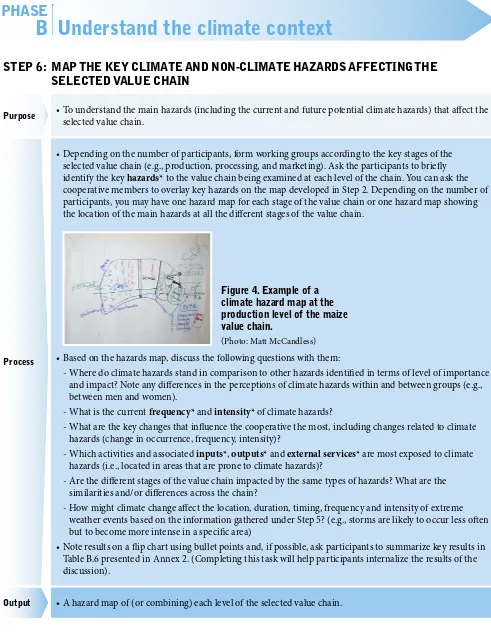
Purpose • To understand the main hazards (including the current and future potential climate hazards) that afect the
selected value chain.
Process
• Depending on the number of participants, form working groups according to the key stages of the
[image:14.612.80.571.73.706.2]selected value chain (e.g., production, processing, and marketing). Ask the participants to briely identify the key hazards* to the value chain being examined at each level of the chain. You can ask the cooperative members to overlay key hazards on the map developed in Step 2. Depending on the number of participants, you may have one hazard map for each stage of the value chain or one hazard map showing the location of the main hazards at all the diferent stages of the value chain.
figure 4. example of a climate hazard map at the production level of the maize value chain.
(Photo: Matt McCandless)
• Based on the hazards map, discuss the following questions with them:
- Where do climate hazards stand in comparison to other hazards identiied in terms of level of importance and impact? Note any diferences in the perceptions of climate hazards within and between groups (e.g., between men and women).
- What is the current frequency* and intensity* of climate hazards?
- What are the key changes that inluence the cooperative the most, including changes related to climate hazards (change in occurrence, frequency, intensity)?
- Which activities and associated inputs*, outputs* and external services* are most exposed to climate hazards (i.e., located in areas that are prone to climate hazards)?
- Are the diferent stages of the value chain impacted by the same types of hazards? What are the similarities and/or diferences across the chain?
- How might climate change afect the location, duration, timing, frequency and intensity of extreme weather events based on the information gathered under Step 5? (e.g., storms are likely to occur less oten but to become more intense in a speciic area)
• Note results on a lip chart using bullet points and, if possible, ask participants to summarize key results in
Table B.6 presented in Annex 2. (Completing this task will help participants internalize the results of the discussion).
output • A hazard map of (or combining) each level of the selected value chain.
understand the climate context
PHAse
steP 7: iDentify tHe Business’s most ClimAte-sensitive inPuts, outPuts
AnD externAl serviCes
Purpose • To assess the degree to which the key business inputs, outputs and external services are afected by climate
hazards.
Process
• Clarify to the participants that in this manual, climate impact* refers to the consequences of climate hazards on the chain being examined in the context of climate variability and change. Impacts may be negative (e.g., loss of income) or positive (e.g., increased yield and extension services). Climate hazards can inluence business competitiveness through their impacts on agro-products supply and demand.
• Reiterate that an agricultural cooperative should always assess the impacts of climate hazards on the supply
of agricultural products, including on inputs,* outputs,* and external services,* as well as on buyers and their demand for agro-products (e.g., climate hazards can disrupt food consumption by inluencing the income of buyers and food prices). (See Table 1, Module 1)
[image:15.612.40.535.37.712.2]• Ask participants to ill in Table C.7 in Annex 2. In the irst column, ask them to list the main inputs* identiied in Step 4 required at each level of the selected value chain. In the irst row, ask them to write down the main current and future potential climate hazards* identiied in Step 6. hen, ask the participants to score the impacts of each climate hazard on the inputs using a scale from -3 (“signiicant negative impacts”) to 1 (“positive impacts”). Ask participants to add a justiication of their ranking in brackets whenever necessary.
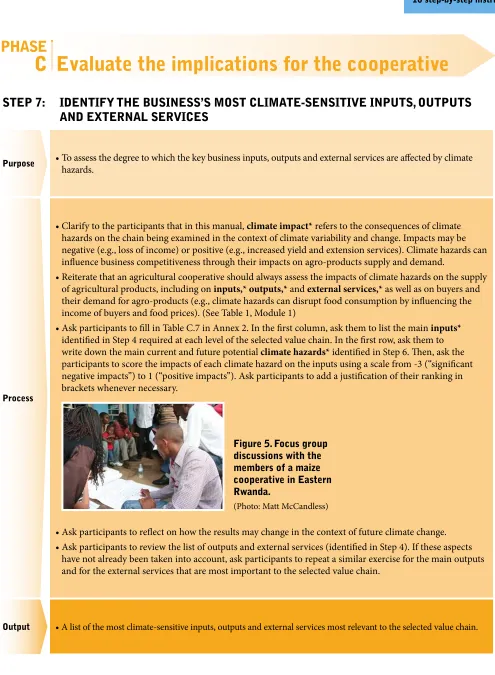
figure 5. focus group discussions with the members of a maize cooperative in eastern rwanda.
(Photo: Matt McCandless)
• Ask participants to relect on how the results may change in the context of future climate change. • Ask participants to review the list of outputs and external services (identiied in Step 4). If these aspects
have not already been taken into account, ask participants to repeat a similar exercise for the main outputs and for the external services that are most important to the selected value chain.
output • A list of the most climate-sensitive inputs, outputs and external services most relevant to the selected value chain.
moDule 2. About the Approach: 10 step-by-step instructions
steP 8: exPlore ClimAte imPACts At eACH stAge of tHe seleCteD vAlue CHAin
Purposes • To understand the impacts of current and potential future climate hazards on the selected value chain.
Process
• First, ask participants to identify at each level of the selected value chain the following using Table C.8 (irst
three columns only) in Annex 2:
- Direct impacts: he immediate efects, positive and/or negative, of a climate hazard* on the cooperative’s inputs,* outputs* and external services* in relation to the selected value chain. Examples of the
direct impacts of drought along a cofee value chain could include: reduced yield and quality of cofee (production level); disruption of market access; and delays in delivery (marketing level).
- Indirect impacts: he positive and/or negative consequences of the direct impacts on the cooperative. Examples of indirect impacts include reduced income, damaged reputation, lost costumers (all levels of the chain), and increased downtime (processing level).
- Other causes of impacts: Identify the other factors that contribute to the severity of direct and indirect impacts (e.g., soil erosion contributing to crop loss). hese are important to note because other non-climatic trends and changes (e.g., poverty, environmental degradation) may exacerbate the negative impacts of climate hazards on the selected value chain. hese other factors may have already been identiied in previous steps (see hazard map, Step 6, and list of non-climatic factors, Table B.6). Examples of other causes of impacts along the cofee value chain include aging cofee trees and soil degradation (production level).
• Second, and once they have completed the irst three columns of Table C.8, ask the members of the
cooperative to discuss the results, asking questions such as:
- Do diferent climate hazards (e.g., lood and drought) have similar or diferent impacts along the value chain? What are the impacts of a combination of climate hazards on the selected chain?
- Who is impacted the most at what level of the value chain and by which climate hazard or combination of climate hazards?
- How do impacts at one level of the value chain inluence (or not) the rest of the value chain (e.g., cumulative efects, time lag efects; creation of new risks)?
- Are the negative impacts of climate hazards experienced only at a speciic stage of the value chain? Are some stages unafected by climate hazards? Do some stages beneit from the impact of the identiied climate hazards?
output • A list of climate impacts* and other non-climatic factors inluencing climate impacts at each stage of the
selected value chain.
evaluate the implications for the cooperative
PHAse
steP 9: exPlore ClimAte resPonses At eACH stAge of tHe seleCteD
vAlue CHAin
Purposes • Prioritize existing and/or alternative responses to minimize the negative impacts of climate hazards and
maximize any opportunities along the selected chain.
Process
• Ask participants to complete Table C.8 in Annex 2 by focusing on current and alternative responses* to climate hazards at each level of the selected value chain:
• Current responses: Ask the members of the cooperative to describe how they currently respond to each combination of direct and indirect impacts of climate hazards (described in Step 8). Examples of existing responses along the maize value chain include diversiication of activities into livestock, savings (production level), and contract farming. Probe participants to explore a range of responses. For example, ask participants to think about short-term (immediate) and long-term (oriented towards longer-term business security) responses; anticipatory (i.e., before the impacts of climate hazards become evident) and reactive (i.e., ater initial impacts of climate hazards become evident) responses. Examples of diferent types of responses include: bearing losses; spreading the burden of losses across diferent actors or systems; changing location; continuing the activities but in a modiied manner; stopping the activities and modifying the threat itself.
• sustainability: Describe whether the cooperative members consider the current responses sustainable or not, for how long and for whom within the cooperative. A response is not sustainable if it leaves some members of the cooperative or the entire cooperative worse of in the long term; that is if it undermines the business’s objectives identiied in Step 1. For example, it is unsustainable to develop irrigation in a place where water scarcity is increasing.
• alternative responses: In case some response strategies are identiied as unsustainable, ask participants to select potential alternative strategies. Ask participants to prioritize alternative strategies that maximize multiple co-beneits and especially those that:
1. Support both climate adaptation* and mitigation.* For example, agroforestry can contribute to both mitigation (through carbon sequestration) and adaptation (because shade tree species can minimize the negative impacts of heavy rainfall events and drought on crops grown underneath them).
2. Take into account future potential climatic conditions (see Step 5).
3. Provide multiple co-beneits all along the value chain (instead of just at one speciic level).
• Required resources: Ask participants to identify what resources (i.e., inancial, human, social, natural, political, technological) they need to implement current or alternative strategies. Finally, ask them to prioritize current and alternative responses based on their feasibility.
output • A list of priority responses to climate hazards along the selected value chain.
moDule 2. About the Approach: 10 step-by-step instructions
steP 10: mAke reCommenDAtions for mAinstreAming ClimAte ConsiDerAtions
into tHe seleCteD vAlue CHAin
Purpose • Compile and analyze the results from all previous steps.
Process
• Ask participants to inalize and compile all the results from the group discussions and to analyze, present
and relect on the results in groups based on the following steps:
1. Hang the hazard map(s) (Step 6) on the wall and ask participants to describe what the map says in terms of the value chain exposure* to climate hazards. Ask participants to summarize their indings in one sentence and write it down on a lipchart.
2. Identify in Step 7 which inputs/outputs/external services of the selected value chain are the most sensitive* to the climate hazards. Ask participants to summarize their indings in one sentence and write it down on a lipchart.
[image:18.612.80.577.96.694.2]3. Hang Table C.8 on the wall and rank the responses by order of importance in terms of degree of feasibility and multiple co-beneits (e.g., adaptation and mitigation beneits, short-term and long-term beneits, economic and social beneits).
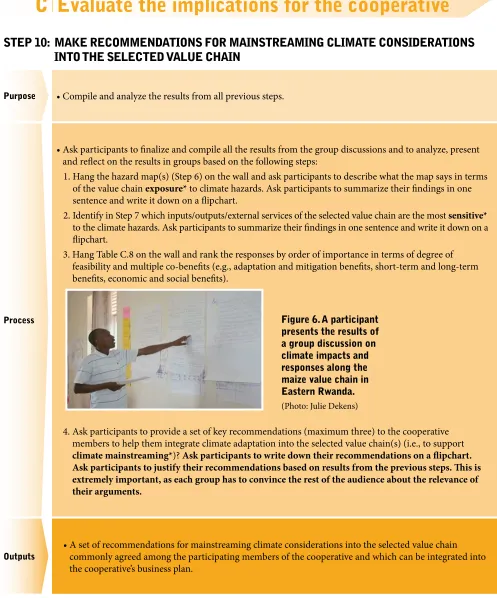
figure 6. A participant presents the results of a group discussion on climate impacts and responses along the maize value chain in eastern rwanda.
(Photo: Julie Dekens)
4. Ask participants to provide a set of key recommendations (maximum three) to the cooperative members to help them integrate climate adaptation into the selected value chain(s) (i.e., to support climate mainstreaming*)? ask participants to write down their recommendations on a lipchart. ask participants to justify their recommendations based on results from the previous steps. his is extremely important, as each group has to convince the rest of the audience about the relevance of their arguments.
outputs
• A set of recommendations for mainstreaming climate considerations into the selected value chain
commonly agreed among the participating members of the cooperative and which can be integrated into the cooperative’s business plan.
evaluate the implications for the cooperative
PHAse
module 3.
the maisha Bora Cooperative Case study
A trial of this manual was run for the Maisha Bora cooperative during a three-day workshop in May 2013, with diferent groups examining the produc-tion (including drying), processing (grinding), and storage stages of the cooperative’s maize value chain. he exercise was carried out at the site of the cooperative, with members present to answer ques-tions and provide insights. his module details the indings of this case study.
Business Context
Maisha Bora is a cooperative centered in the Gats-ibo district of the Eastern Province of Rwanda. As of May 2013, the cooperative has 122 members (68 women and 54 men) and was registered in 2011 as a cooperative with the Rwanda Cooperative Agen-cy. Before 2011, farmers were organized informally as an association. he cooperative’s mandate is to be open and accessible to people with HIV/AIDS (i.e., the cooperative cannot refuse sick people) and the majority of members are HIV/AIDS positive. he vision for the cooperative is for all members to become economically and socially self-reliant. Its members farm on eight hectares of communal land as well as on private household plots ranging in size from 0.5 to 2 hectares. Agriculture on the commu-nal land is governed by the local government, and cooperative members only grow the crops autho-rized by the district for each parcel of land.
Major activities for this cooperative include the production, drying and processing of maize and soybeans, as well as the management of livestock (goats and others). Although no business plan for Maisha Bora was available, cooperative members explained the workings of the business to work-shop participants. he cooperative owns plastic
sheets for drying all maize communally, grinding machines, and a decorticator (a machine for strip-ping plant husks etc.). A storage house is rented during times of harvest for storing and drying the crops. Maize production in 2012 was 25 tonnes. he grinding machine is also used by non-cooper-ative members, which provides additional income to the cooperative.
he cooperative also pools and markets grain, an activity that has had a major beneit to members. Originally, the cooperative would sell to itinerant traders at low market rates and the maize would be processed at a factory in Kigali. Following the hir-ing of a business consultant, the markethir-ing strat-egy shited to seeking longer-term supply contracts that would reduce price luctuation.
he key inputs to the business as identiied by workshop participants include fertilizers (avail-able at subsidized price), water, the decorticator, land and soil. he outputs of the business are maize and various plant byproducts used for fodder and fuel. Some of the key challenges faced are the lack of available land resources, illness of members due to HIV/AIDS afecting their ability to work, and inconsistent production due to climate variability and change.
Climate Context
he cooperative is located in the Eastern Province of Rwanda in the “cool sub-humid” agro-ecological zone category.1,2 his signiies mean temperatures in
the range of 15 to 20 degrees Celsius and a growing period of 180 to 270 days in length. he Gatsibo dis-trict is characterized by high temperatures in the mid- to high-20s degrees Celsius and low temperatures in
1 See http://harvestchoice.org/products/map/912,1802 for Agro-ecological zonation maps for Africa.
moDule 3. the maisha Bora Cooperative Case study
the mid-teens. Precipitation peaks twice per year in the months of April and November or December. he period from May to September is the driest. Total an-nual precipitation is around 900 millimetres.3
Due to its hilly terrain, drainage in the area is rapid, oten causing loods following heavy rain-fall events. his area is also prone to droughts. he Maisha Bora cooperative members describe their climate context as existing in three states of equal frequency: too much sunshine, leading to dry con-ditions and lower crop returns; too much moisture leading to loods and crop damage; and an opti-mum mix of rainfall and solar radiation when crop yields are highest.
Droughts and loods are the main climate hazards faced in the region, and poor adaptation to these events is considered a key climate vulnerability.* here is concern that the increasing frequency and intensity of such events due to climate change could exacerbate this vulnerability. hese concerns are validated by climate change projections (gener-ated by IISD using the MarkSim weather ile gen-erator4 based on existing climate records supplied
by Rwanda’s National Meteorological Agency) sug-gesting higher temperatures and increased rainfall by 2025 and 2050.
While increased temperatures can lead to higher rates of evapotranspiration and intensify droughts, a more signiicant concern is the projected increase in precipitation in Eastern Rwanda. Climate change predictions for Gatsibo predict greater rain in the already wet months of December, February, April, May and December. Based on the climate change projections, the most sensitive inputs are likely to be water, land and anything requiring transport by roads that may become damaged by looding.
implications for the Cooperative
A number of climate impacts were identiied at the various stages of the chain, but the greatest concern at all levels was looding. Floods are directly respon-sible for destroying crops, as the hillsides above the cooperative ields are not protected from erosion, causing water and sediment to surge down the
slopes, eroding ields and crops. In addition to afect-ing the quantity of food, loods can lower the quality of those grains that are produced. When crop out-put is reduced by loods, cooperative members have less food for their own household consumption, and also have reduced income due to lower revenue from crop sales. Floods can also destroy cooperative infra-structure such as storage sheds and locations used for drying grains. Public infrastructure such as roads and bridges are also impacted by loods, afecting the transport of goods and people.
Other climate hazards identiied by cooperative members included droughts and hailstorms that reduce crop output. Other concerns raised by co-operative members included: the degradation of crops in the storage and processing stages; loss of crop quality through degradation and spoilage due to inadequate storage areas; and unskilled equip-ment operators not ensuring that machinery is well maintained, leading to improper processing. Based on previous experiences, the above impacts can re-duce maize yields to 10 tonnes, less than half of the production (around 25 tonnes) of grain in a good year (i.e., 3 tonnes per hectare).
Participants identiied various responses to mini-mize the negative impacts of climate hazards, par-ticularly looding, on the activities of the Maisha Bora Cooperative as described below:
• Natural resources management: Participants concluded that there is a need to manage water in upstream areas at the top of hills, from which loodwaters come (such as through integrated water management at the watershed level). hese headwaters are oten in neighbouring districts and under separate administrations, requiring cooper-ation in how solutions are managed, implemented and inanced. Other key responses focused on nat-ural resources management included: terracing, reforestation of upland slopes, improved manage-ment of wetlands in upstream areas, and eliminat-ing the cleareliminat-ing and burneliminat-ing of bush.
• Technological responses: Another set of pro-posed responses focused on more technological
3 Based on existing climate records supplied by Rwanda’s National Meteorological Agency.
references
and reinforcement of existing buildings such asstorage sheds and machine shops.
• Capacity building: Other solutions that were proposed for reducing vulnerability to climate hazards, particularly loods and drought, focused on capacity building through training and knowl-edge sharing. Ideas shared included: providing better training for equipment operators; exchange visits with other cooperatives to share informa-tion on practices; and discussion and dialogue with people in neighbouring areas to manage vul-nerabilities more comprehensively.
• Livelihood changes: hese solutions included: inding of-farm work to supplement income and relocating some activities to lands less prone to looding.
Overall, the exercise of assessing climate risk for the Maisha Bora cooperative by focusing on the maize value chain helped it to identify climate risks from a holistic perspective (i.e., beyond just production issues). he issue of inancing adap-tation options remains a challenge. Many of the proposed solutions will require investment, and the cooperative has limited ability to leverage the required funds. he results could further serve as a basis to incorporate climate adaptation into the cooperative business plan and associated project proposals. By understanding and addressing these risks, the cooperative is better place to proactively manage them, rather than dealing with the dam-age done ater they occur. he results also high-light the need to manage tradeofs. Managing risk oten means balancing priorities, for example, between short-term productivity gains at the ex-pense of future productivity. Understanding these risks can reveal where investment is needed— whether in the form of money, human resources, and opportunity cost—to proactively prevent cli-mate hazards from adversely afecting the coop-erative’s viability in the face of climate variability and change.
Boko, M., I. Niang, A., Nyong, C., Vogel, A., Githeko, M., Medany, B., Osman-Elasha, R. Tabo, & Yanda, P. (2007). Africa. Climate Change 2007: Impacts, adaptation and vulnerability. In M.L. Parry, O.F. Canziani, J.P. Palutikof, P.J. van der Linden & C.E. Hanson (Eds.), Contribution of Working Group II to the Fourth Assessment Report of the Intergovernmental Panel on Climate Change, (pp. 433–467). Cambridge, U.K.: Cambridge University Press.
Retrieved from http://www.ipcc.ch/publications_and_data/ar4/wg2/en/ch9.html
Christensen, J.H., B. Hewitson, A. Busuioc, A. Chen, X. Gao, I. Held, R. Jones, R.K. Kolli, W.-T. Kwon, R. Laprise, V. Magaña Rueda, L. Mearns, C.G. Menéndez, J. Räisänen, A. Rinke, A. Sarr and P. Whetton. (2007). Regional climate projections. In S. Solomon, D. Qin, M. Manning, Z. Chen, M. Marquis, K.B. Averyt, M. Tignor & H.L. Miller (Eds.), Climate Change 2007: he physical science basis. Contribution of Working Group I to the Fourth Assessment Report of the Intergovernmental Panel on Climate Change Cambridge, U.K. & New York: Cambridge University Press. Retrieved from http://www.ipcc.ch/publications_and_data/ar4/wg1/en/ch11.html
CRiSTAL website. (n.d.). Retrieved from http://www.iisd.org/cristaltool/
Government of Rwanda. (2012). he Second National Communication to the UNFCCC.
Retrieved from http://unfccc.int/national_reports/non-annex_i_natcom/items/2979.php
Ministry of Lands, Environment, Forestry, Water and Mines. (2006). he National Adaptation Programme of Action. Republic of Rwanda. Retrieved from http://unfccc. int/resource/docs/napa/rwa01e.pdf
Ministry of Natural Resources. (2011). Rwanda Green Growth and Climate Resilience Strategy. National Strategy on Climate Change and Low Carbon Development. Retrieved from http://www.rema.gov.rw/index.php?option=com_content&view=category&layou t=blog&id=194&Itemid=174&lang=en
M4P. (2008). Making value chains work better for the poor: A toolbook for practitioners for value chain analysis, Version 3. Making Markets Work Better for the Poor (M4P) Project, U.K. Department for International Development (DFID). Phnom Penh, Cambodia: Agricultural Development International. Retrieved from http://aciar.gov.au/iles/ node/14580/making_value_chains_work_better_for_the_poor_a_to_14413.pdf#
Rwanda Cooperative Agency. (2011). Training program on management of cooperatives. Participants notes for the training. Retrieved from http://www.rca.gov.rw/IMG/pdf/ RCA_Staf_Training_-_Participanats_Notes_-_Revised_11th_March_2011.pdf
Rwanda Cooperative Agency. (2006). National policy on promotion of cooperatives.
Annex 1: key concepts
(in the context of this manual)
Agricultural cooperative
A type of business owned and managed by the members that should contribute to income generation through improving value addition of agricultural products (i.e., livestock, ish, crops, fruits and/or vegetables).
Climate Long-term averages (across decades, usually 30 years) of climate variables such as temperature, precipitation, humidity, wind, cloud type and amount, and solar radiation.
Climate adaptation A process of adjusting to current and future potential climatic changes (i.e., addressing the impacts of climate change). In this manual, climate adaptation is closely related to climate risk management.
Climate change Long-term changes in the climate that persist for decades or longer arising from natural causes or human activity. Human-induced climate change is attributed to greenhouses gas (GHG) emissions that absorb and emit radiation.
Climate hazard (or hydro-meteorological hazard)
A potentially damaging event or phenomenon of a climatic nature. Examples include extreme weather events (e.g., loods, droughts, thunderstorm, and hailstorm); changes in location, timing, frequency, intensity of extreme weather events; and gradual changes such as rising temperature and changing rainfall patterns.
Climate impact he realization of a climate risk.
Climate mainstreaming
he integration of measures that address climate variability and change into the agricultural cooperative’s activities to ensure long-term sustainability of investments and reduce the sensitivity of business activities to actual and expected climatic changes.
Climate mitigation Activities designed to address the causes of climate change by reducing the sources of greenhouse gases (GHG) emissions in the atmosphere and/or by enhancing the sinks (removal) of GHG from the atmosphere.
Climate variability short-term changes in the climate beyond that of individual weather events. For example, extreme weather events such as heavy rains or droughts that do not necessarily represent a trend.
Climate risk he probability of harmful consequences or expected loss (e.g., death, reduced economic productivity, environmental damage) resulting from interactions between climate hazards, exposure to these hazards and vulnerable conditions.
Climate risk management
he use of climate information in decision making to minimize potential harm or losses associated with climate variability and change. In this manual, climate risk management is closely related to climate adaptation.
exposure he value chain exposure to climate hazards refers to the number of inputs, outputs and external services relevant to the value chain as well as the number of buyers of the product(s) produced by the cooperative that are present in climate hazard-prone areas.
external services he external support from Government, NGOs, and/or the private sector that feed into the business). Examples of external support include: inance (e.g., loans, savings); extension (e.g., training on agricultural practices); farm inputs (e.g., subsidies for fertilizers); information, Communication and Technologies (e.g., price information accessible on cell phones, road networks); research and development (e.g., new pest resistant varieties); machinery and storage equipment (by private companies) and organic/fair trade certiication.
frequency How oten a climate hazard occurs in the area where the value chain operates (e.g., “once every year,” “twice a decade”).
Hazards A potentially damaging condition, event or phenomenon for the cooperative and the selected value chain. Examples: HIV-AIDS, social unrest, political instability, corruption of local leaders, deforestation, price luctuation.
inputs he resources required to run the cooperative from production to marketing.
intensity How strong the hazard is when it occurs in the area where the value chain operates (e.g., “loods typically reach the entire village and half the surrounding ields”).
responses he range of strategies undertaken by the members of the cooperative (individually and collectively) to minimize the negative impacts of climate hazards on the selected value chain and/or to maximize any potential beneit.
outputs he products or services the cooperative ofers.
sensitivity he value chain sensitivity to climate hazards refers to the degree to which the value chain (its inputs, outputs, external services and the buyers of the product(s) produced by the cooperative) are afected, either adversely or beneicially, by climate variability or change.
value chain he chain of activities which add value, from the production of a raw material to the processing and the consumption of the inal product.
vulnerability he susceptibility of a value chain to the adverse efects of a climate hazard. he vulnerability of the value chain to climate hazards is a function of the value chain’s sensitivity and adaptive capacity. Adaptive capacity refers to the ability of the cooperative to take advantage of opportunities or to cope with the consequences of potential damages.
Annex 2: reporting tables
(with examples of completed tables)
Core processes versus main inputs
Production Processing marketing Consumption totAl
sCore
natural inputs
Physical inputs
financial inputs
Human inputs
social inputs
Political inputs (at the level of the cooperative)
reporting table A.4:
Prioritization of key inputs at each level of the selected value chain
example of a completed table A.4
Core processes versus main inputs
Production Processing marketing Consumption totAl
sCore
natural inputs
land 3 1 0 0 3
water 3 2 0 0 5
soil 3 0 0 0 3
Physical inputs
Road 2 2 3 2 9
grinding machines 0 3 2 0 5
storage house 1 3 1 0 5
Bicycles 0 2 2 1 5
electricity 0 3 1 0 4
financial inputs
micro-credit 3 3 3 0 9
savings 2 1 1 2 6
Human inputs
market information 2 1 3 3 9
weather information 3 1 1 0 5
agronomic practices 3 0 0 0 3
social inputs
trust among cooperative members
3 3 3 0 9
Reputation of the cooperative
1 1 3 3 8
Political inputs (at the level of the cooperative)
well-connected cooperative leader
2 2 2 0 6
participatory decision making process
1 2 3 0 6
Annex 2: rePorting tABles (with examples of completed tables)
reporting table B.5:
summary of information on observed and projected climate change in the
area where the selected cooperative operates
reporting table B.6:
main climate and non-climate hazards affecting the selected value chain
trends in climate variables observed climate (past and present)
future potential climate
temperatures
Precipitation patterns (amount, timing)
extreme weather events
Climate hazards Current climate hazards
frequency (how often a hazard occurs)
intensity (how “strong” the hazard is when it occurs)
future evolution under climate change (step 5)
non-climate hazards
Human health hazards; socio-cultural hazards
Political hazards environmental hazards
example of a completed table B.6
main climate hazards Current climate hazards frequency (how often a hazard occurs)intensity (how “strong” the hazard is when it occurs)
future evolution under climate change
• Drought (all stages of the value chain)
• Once every two years
• At least three weeks without rainfall and unusually warm temperatures
• More prolonged and frequent droughts
• Flood
(all stages of the value chain)
• Once every year • Floods all the ields surrounding the main river
• More intense (loods could reach the village) and frequent loods
• Seasonal change (all stages of the value chain)
• Every year or so since the past few years
• Prediction of cultivation seasons is more and more diicult
• Likely to continue non-climate hazards Human health hazards; socio-cultural hazards
Political hazards environmental hazards
economic & inancial hazards
• HIV-AIDS • Limited
involvement of women beyond production
• Corruption of political leaders
• Deforestation • Soil degradation
Annex 2: rePorting tABles (with examples of completed tables)
reporting table C.7:
impacts of climate hazards on the main business inputs at each stage of
the selected value chain
main inputs (step 4) Current climate hazards (step 6) total score
Production
Processing
marketing
Consumption
1 Positive impact 0 no impact
-1 minor negative impact -2 moderate negative impact -3 signiicant negative impact
x mixed impacts (both positive and negative) ? i don’t know
example of a completed table C.7
main inputs (step 4) Current climate hazards (step 6) total score
Production Drought flood seasonal change
Water -3 -1 (increased salinization) ? -4
Land -3 -2 (increased land degradation) ? -5
Soil -3 -2 (increased soil erosion) ? -5
Micro-credit -3 (increased demand but reduced access to micro-credits)
-3 (increased demand but reduced access to micro-credits)
-3 (increased demand but reduced access to micro-credits)
-9
Weather info 0 -2 (reduced access due to network disruptions)
0 -2
Agronomic practices -3 (current practices are inappropriate)
-3 (current practices are inappropriate)
-3 (current practices are inappropriate)
-9
Trust among coop members -2 (increase of thets) -2 -2 -6
Processing Drought flood seasonal change
Grinding machines 0 -2 (Deterioration of equipment) 0 -2
Storage house 0 -2 (Deterioration) 0 -2
Electricity -3 -1 0 -4
Micro-credit -3 -3 -3 -9
Trust among coop members -2 (increase of thets) -2 -2 -6
marketing Drought floods seasonal change
Road 0 -3 0 -3
Micro-credit -2 -2 -2 -6
Market info 0 -2 0 -2
Trust among coop members -2 (increase of thets) -2 -2 -6
Reputation -3 -3 -2 -8
Participatory decision-making process
0 0 0 0
Consumption Drought flood seasonal change
Market info 0 -3 0 -3
Reputation of the coop -3 -3 -2 -8
1 Positive impact 0 no impact
-1 minor negative impact -2 moderate negative impact
-3 signiicant negative impact x mixed impacts (both positive
and negative) ? i don’t know
Annex 2: rePorting tABles (with examples of completed tables)
reporting table C.8:
impacts of climate hazards at each stage of the selected agricultural value chain and current
and alternative responses
Current & future potential climate hazards
impacts responses
Direct impact indirect impact
other causes of impacts
Current responses
is it working? for whom? for how long?
Alternative responses
required resources
Production
E.g., droughts
transformation
marketing
internAtionAl institute for sustAinBle DeveloPment
Head ofice
161 portage avenue east, 6th floor winnipeg, manitoba, R3B 0Y4, Canada tel: +1 (204) 958-7700
fax: +1 (204) 958-7710 www.iisd.org