Gadjah Mada International Journal of Business Vol. 15, No. 3 (September - December 2013): 269 - 285
* Corresponding authors. E-mail: [email protected]
Efficiency of S&P CNX Nifty Index Option
of the National Stock Exchange (NSE),
India, using Box Spread Arbitrage Strategy
G. P. Girish,
aand
Nikhil Rastogi
ba IBS Hyderabad, ICFAI Foundation For Higher Education (IFHE) University, Andhra Pradesh, India
b Institute of Management Technology (IMT) Hyderabad, India
Abstract: Box spread is a trading strategy in which one simultaneously buys and sells options having the
same underlying asset and time to expiration, but different exercise prices. This study examined the effi-ciency of European style S&P CNX Nifty Index options of National Stock Exchange, (NSE) India by making use of high-frequency data on put and call options written on Nifty (Time-stamped transactions data) for the time period between 1st January 2002 and 31st December 2005 using box-spread arbitrage strategy. The advantages of box-spreads include reduced joint hypothesis problem since there is no consideration of pricing model or market equilibrium, no consideration of inter-market non-synchronicity since trading box spreads involve only one market, computational simplicity with less chances of mis-specification error, estimation error and the fact that buying and selling box spreads more or less repli-cates risk-free lending and borrowing. One thousand three hundreds and fifty eight exercisable box-spreads were found for the time period considered of which 78 Box box-spreads were found to be profit-able after incorporating transaction costs (32 profitprofit-able box spreads were identified for the year 2002, 19 in 2003, 14 in 2004 and 13 in 2005) The results of our study suggest that internal option market efficiency has improved over the years for S&P CNX Nifty Index options of NSE India.
Abstrak:Box spread adalah strategi trading dimana seseorang dapat secara simultan membeli dan menjual
option yang memiliki dasar aset dan waktu berakhir yang sama, namun dengan harga latihan yang berbeda. Penelitian ini menguji efisiensi gaya Eropa S&P CNX Nifty Index Option pada Bursa Efek Nasional di India dengan memanfaatkan data frekuensi tinggi pada put dan call option yang tertulis di Nifty (data transaksi cap waktu) untuk periode antara 1 Januari sampai 1 Desember 2005 dengan menggunakan strategi arbritase box spread. Keuntungan dari box spread adalah berkurangnya masalah hipotesis gabungan karena tidak ada pertimbangan atas model harga atau ekuilibrium pasar modal, tidak ada pertimbangan atas non-sinkronitas antarpasar modal karena box spread perdagangan hanya meliputi satu pasar modal, kemudahan komputasional dengan berkurangnya kesalahan spesifikasi, kesalahan estimasi, dan fakta bahwa pembelian dan penjualan box spread kurang lebih menggandakan pinjam-meminjam yang bebas resiko. Sebanyak 1358 box spread ditemukan dan sebanyak 78 box spread dianggap menguntungkan setelah
Acknowledgement
Introduction
The derivatives trading at India’s Na-tional Stock Exchange (NSE) commenced on June 12, 2000 with futures trading on S&P CNX Nifty Index. Nifty Index options on S&P CNX Nifty index started trading at NSE from June 2001. The Index options of NSE India have recorded a turnover of Rupees 23,890,021.53 crore (US $ 4,392.41 billion) during the financial year 2012-13. According to the World Federation of Exchanges report of 2011 (Market survey by International Options markets Association), the National Stock Exchange of India was second among all exchanges in the world based on the num-ber of stock index options contracts traded in 2011 (in terms of volume). With an order-driven market microstructure of NSE India, it would be interesting to examine the inter-nal option market efficiency using box-spread for a stock exchange of a developing nation whose volume of index option contracts traded is one of the highest among all ex-changes in the world.
A financial market’s functioning and its development depends on its efficiency. Ac-cording to Brunetti and Torricelli (2007), most of the empirical research in the litera-ture of financial markets rests on the defini-tion of market efficiency as “the absence of arbitrage opportunities” i.e. in an efficient market, if there is absence of arbitrage, two assets providing identical future
payoffs/prof-its must trade at the same price. If there is any deviation from ‘no arbitrage’ values, there will be an immediate reaction from market participants resulting in rapid disappearance of the mispricing. Option market efficiency can be investigated in two ways namely cross market efficiency or by internal option mar-ket efficiency. In case of the former test, it is based on tests of the joint efficiency of the option and the underlying market whereas in the case of internal option market test of ef-ficiency, it aims at assessing the existence of arbitrage opportunities within the very same option market. Internal option market effi-ciency tests can be performed by making use of various types of arbitrage strategies such as box and butterfly spreads involving only options.
Very few studies have tried to explore and investigate the efficiency of S&P CNX Nifty index options of NSE India (except Vipul 2009). In this study we examine the efficiency of European style S&P CNX Nifty index options of the Indian National Stock Exchange (NSE) by using time-stamped transactions data (i.e. high-frequency data on put and call options written on Nifty) of Nifty options provided by NSE India for time pe-riod between 1st January 2002 to 31st
Decem-ber 2005 and by making use of box-spread arbitrage strategy which is a model-free method for testing the efficiency of options markets. Since only options are involved, it is believed to be a better way of
investigat-memperhitungkan biaya transaksi (Sebanyak 32 buah box spread yang menguntungkan diidentifikasi pada tahun 2002, 19 buah pada tahun 2003, 14 buah pada tahun 2004, dan 13 buah pada tahun 2005). Hasil penelitian ini menunjukkan bahwa efisiensi pasar option internal telah meningkat selama bertahun-tahun untuk S&P CNX Nifty Option dari Bursa Efek Nasional di India.
ing options market efficiency. The rest of the paper is structured as follows: In Section 2 we review relevant literature in the context of internal market efficiency, option trading strategies, box spread arbitrage strategy and explain the motivation of our study. In sec-tion 3 we introduce Nasec-tional Stock Exchange of India, derivative segment of NSE India and explain their relevance. In section 4 we introduce box-spread arbitrage strategy, types of arbitrageurs involved, the nature and mag-nitude of transaction costs for each type of arbitrageur. In section 5 we describe the re-search methodology adopted in this study for identifying mispricing in option contracts, arbitrage opportunities and discuss our em-pirical findings and results in section 6 and conclude the article in section 7.
Literature Review
A financial market’s functioning and its development depends on its efficiency. Mar-kets can be investigated for their efficiency by means of model-based tests or by explor-ing arbitrage pricexplor-ing relationships. Accordexplor-ing to Brunetti and Torricelli (2007), most of the empirical research rests on the definition of market efficiency as the absence of arbitrage opportunities. Option market efficiency can be investigated under two relevant notions: a) Cross markets efficiency (which is based on tests of the joint efficiency of the option and the underlying market). b) Internal op-tion market efficiency (which aims at assess-ing the existence of arbitrage opportunities within the very same option market). Cross market tests of efficiency are mostly per-formed on the lower boundary conditions that have to hold for call and put options and mostly based on arbitrage pricing relationship (i.e. the put-call parity). Whereas tests of in-ternal option market efficiency are performed
by making use of various types of arbitrage strategies such as box and butterfly spreads involving only options. Since, only options are involved, it’s believed to be a better way of investigating options market efficiency.
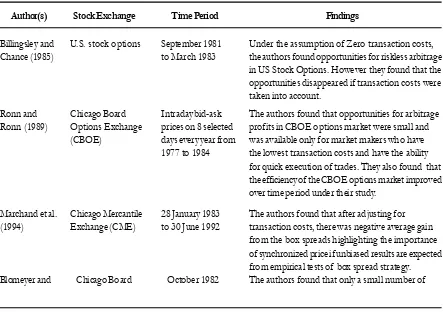
Billingsley and Chance (1985) tested the efficiency of the U.S. stock options by mak-ing use of box spread strategy. They did so by compiling the daily closing price of stock options from The Wall Street Journal. The study was done by considering the time pe-riod between September 1981 and March 1983. In their study, they derived 277 box spreads from daily closing stock option prices and found that there were opportunities for riskless arbitrage in U.S. Stock Options, but, under a zero transaction cost assumption. They found that the opportunities disap-peared if transaction costs were taken into account. Ronn and Ronn (1989) in their study of efficiency of Chicago Board Options Ex-change (CBOE) options market, considered the intraday bid-ask prices on 8 selected days every year between 1977 and 1984. Only long box spread strategy was examined thereby avoiding problems associated with the use of American options and they found that oppor-tunities for arbitrage profits in CBOE options market were small and available only for market makers who have the lowest transac-tion costs and have the ability for quick ex-ecution of trades. They also found that the efficiency of the CBOE options market im-proved over the time period under their study. In our study we will consider transaction costs unlike Billingsley and Chance’s (1985) study and we will make use of European style options of NSE India unlike CBOE’s Ameri-can options considered by Ronn and Ronn (1989).
fu-tures options by using box spreads and they did so by considering transaction prices as well as imputed bid-ask prices. They did their study by considering the CME data of S&P 500 Futures options. The time period con-sidered for their study was between 28 Janu-ary 1983 and 30 June 1992. They found that, after adjusting for transaction costs, there was negative average gain from the box spreads, which implied that the longer it took to com-plete the box spread strategy, the more the profit varied. This result actually highlighted the importance of synchronized price, espe-cially if researchers intended to obtain unbi-ased results as far as empirical tests of box spread strategy are concerned. In our study we consider time-stamped transaction price data to obviate non-synchronicity of Nifty Index options and consider only those box spreads which could have been exercised by traders i.e. the first box spread that can be formed and exercised while using box spread strategy in real-time scenario rather than tak-ing into consideration all possible box spreads, which might or might not be exercised. Blomeyer and Boyd (1995) in their study ex-amined the efficiency of the options on Trea-sury bonds (T-bond) futures contract of Chi-cago Board of Trade (CBOT) by examining both ex post and ex ante arbitrage opportuni-ties using transaction by transaction data over the period of study. They considered all price changes of options and futures contracts be-tween October 1982 and mid of June 1983 and found only a small number of ex post arbitrage opportunities available. Even this study made use of American options which can be exercised early.
Hemler and Miller (1997) in their study examined the efficiency of European style S&P 500 Index options traded on the Chi-cago Board Options Exchange (CBOE). Their main aim was to investigate the effect
of October 1987 stock market crash on mar-ket efficiency of CBOE by making use of Box Spread Strategy. They found 84 long box spreads and 12 short box spreads which were profitable before the October 1987 crash happened whereas, post crash, they found 1834 long box spreads and 719 short box spreads which were profitable. Persistence of mispricing was found to be 3 weeks after the crash. Hemler and Miller (1997) found a substantial increase in profit opportunities post crash compared to pre crash period, i.e. they found significant arbitrage opportunities for S&P 500 European options post-crash of October 1987. However, in the discussion of their results and conclusion, they warned that some quotes might not have been ex-ecuted, due to stale prices, indicating some arbitrage profits may have been virtually im-possible to achieve. Ackert and Tian (2001) in their study examined the efficiency of S&P 500 index options of the Chicago Board of Trade (CBOT) by considering a sample con-sisting of daily closing option prices between February 1992 and January 1993. They found frequent and substantial violations of the box spread relationship, even though their analy-sis reflected transaction costs. The results obtained by Ackert and Tian (2001), do not provide any support for options market effi-ciency of CBOT improving over time.
few low-profit arbitrage opportunities. Fung et al. 2004 in their study examined the pric-ing efficiency of Hang Seng Index options market in Hong Kong, which is an emerging market and thinly traded, by making use of Box spread Strategy. The study was based on 20 months of tick-by-tick bid-ask and trans-action quotes. It was found that there were very few arbitrage opportunities and upon further examination based on the reporting time of quotes, it was found that all the ap-parent mispricings were deceptive and they could be explained by stale quotes. The ab-sence of real arbitrage opportunities con-firmed the efficiency of the Hong Kong op-tions market. The results obtained in their study showed that the Hong Kong options market was arbitrage-efficient under a com-petitive market-making system, thereby mak-ing the results akin and similar to the results
usually obtained for developed options mar-ket.
Benzion et al. 2005 in their study ex-amined the efficiency of the Israeli options market by examining box spread strategy. They made use of a real-time computer pro-gram to find Arbitrage gain opportunities by considering the sample of index options traded on the Tel-Aviv Stock Exchange [TA25 stock index (TA25)] in June-July 2000. They used the fully computerized trading sys-tem on the Tel-Aviv Stock Exchange and a special program installed on a broker’s com-puter trading system to detect arbitrage op-portunities in real time and compute gains for various scenarios of transaction costs and time delays. It was found from the study that only few small-gain arbitrage opportunities were possible which vanished quickly and supported the efficiency of the Israeli options market.
Table 1. Summary of Literature reviewed on Box-Spread Arbitrage Strategy
Author(s) Stock Exchange Time Period Findings
Billingsley and U.S. stock options September 1981 Under the assumption of Zero transaction costs, Chance (1985) to March 1983 the authors found opportunities for riskless arbitrage
in US Stock Options. However they found that the opportunities disappeared if transaction costs were taken into account.
Ronn and Chicago Board Intraday bid-ask The authors found that opportunities for arbitrage Ronn (1989) Options Exchange prices on 8 selected profits in CBOE options market were small and
(CBOE) days every year from was available only for market makers who have 1977 to 1984 the lowest transaction costs and have the ability
for quick execution of trades. They also found that the efficiency of the CBOE options market improved over time period under their study.
Marchand et al. Chicago Mercantile 28 January 1983 The authors found that after adjusting for (1994) Exchange (CME) to 30 June 1992 transaction costs, there was negative average gain
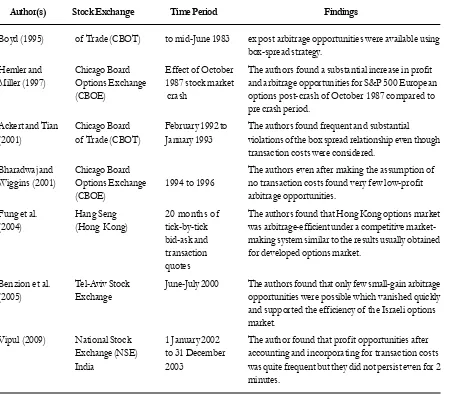
Table 1 (Continued)
Author(s) Stock Exchange Time Period Findings
Boyd (1995) of Trade (CBOT) to mid-June 1983 ex post arbitrage opportunities were available using box-spread strategy.
Hemler and Chicago Board Effect of October The authors found a substantial increase in profit Miller (1997) Options Exchange 1987 stock market and arbitrage opportunities for S&P 500 European
(CBOE) crash options post-crash of October 1987 compared to pre crash period.
Ackert and Tian Chicago Board February 1992 to The authors found frequent and substantial (2001) of Trade (CBOT) January 1993 violations of the box spread relationship even though
transaction costs were considered.
Bharadwaj and Chicago Board The authors even after making the assumption of Wiggins (2001) Options Exchange 1994 to 1996 no transaction costs found very few low-profit
(CBOE) arbitrage opportunities.
Fung et al. Hang Seng 20 months of The authors found that Hong Kong options market (2004) (Hong Kong) tick-by-tick was arbitrage-efficient under a competitive
market-bid-ask and making system similar to the results usually obtained transaction for developed options market.
quotes
Benzion et al. Tel-Aviv Stock June-July 2000 The authors found that only few small-gain arbitrage
(2005) Exchange opportunities were possible which vanished quickly
and supported the efficiency of the Israeli options market.
Vipul (2009) National Stock 1 January 2002 The author found that profit opportunities after Exchange (NSE) to 31 December accounting and incorporating for transaction costs India 2003 was quite frequent but they did not persist even for 2
minutes.
Vipul (2009) for the first time examined the market efficiency for the European style Nifty index options of the National Stock Exchange (NSE) India, an emerging market, by making use of box-spread strategy. Time-stamped transactions data provided by NSE between 1 January 2002 and 31 December 2003 (505 trading days) was used for this study. It was found that profit opportunities, after accounting and incorporating for trans-action costs, was quite frequent, but, they did not persist even for 2 minutes. Vipul (2009) highlighted that violations of box-spread par-ity in the Indian market may be due to its
Motivation for the Study
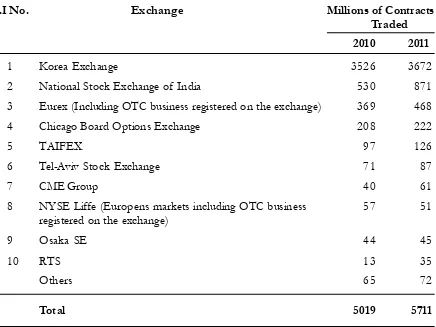
The World Federation of Exchanges (Market survey by International Options markets Association) report of 2011 high-lights that based on the number of stock in-dex options contracts traded in 2011 i.e. in terms of Volume, the National Stock Ex-change (NSE) India was second among all exchanges in the world (see Table 2). With an order-driven market microstructure of NSE India, we believe that investigating in-ternal option market efficiency using box-spread for a stock exchange of a developing nation whose volume of index option
con-tracts traded is one of the highest among all exchanges in the world is very important. As seen from section 2, literature on the effi-ciency of Index options has mostly been stud-ied for: US Markets [i.e. Billingsley and Chance (1985) for U.S Stock Options mar-ket, Ronn and Ronn (1989) for CBOE op-tions, Marchand et al. (1994) for S&P 500 Futures Options, Hemler and Miller (1997) for S&P 500 Index options of CBOE, Ackert and Tian (2001) for CBOT, Evnine and Rudd (1985) and Kamara and (Miller1995)], Euro-pean markets [i.e. Capelle-Blancard and Chaudhury (2001) for French index (CAC40) option market, Mittnik and Rieken (2000) for
Table 2. Top 10 Exchanges Based on the Number of Stock Index Options Contracts Traded in 2011
S.I No. Exchange Millions of Contracts
Traded
2010 2011
1 Korea Exchange 3526 3672
2 National Stock Exchange of India 530 871
3 Eurex (Including OTC business registered on the exchange) 369 468
4 Chicago Board Options Exchange 208 222
5 TAIFEX 97 126
6 Tel-Aviv Stock Exchange 71 87
7 CME Group 40 61
8 NYSE Liffe (Europens markets including OTC business 57 51
registered on the exchange)
9 Osaka SE 44 45
10 RTS 13 35
Others 65 72
Total 5019 5711
German index (DAX) option, Cavallo and Mammola (2000) for Italian index Option market and Brunetti and Torricelli (2007) for Italian Options market]. Other than US and European markets, only Israeli (Benzion et al. 2005) and Hong Kong markets (Fung et al. 2004) have been studied. In case of the Indian context, only Vipul (2009) has done a similar study using Box spread Arbitrage Strat-egy by considering time-stamped transaction prices of Nifty options, provided by NSE India, for 505 trading days i.e. from January 1, 2002, to December 31, 2003, highlighting the characteristics of a young market.
NSE India’s Futures and Options seg-ment has some inherent facilitating factors which favor efficiency of pricing of index options as well as Stock Options. It would be interesting to study the market efficiency of index options (also Stock options) of NSE India. The facilitating factors favoring effi-ciency of pricing of index options are: (Vipul 2009) a) The index options (as well as Stock Options) are European because of which there is no early exercise and actually makes the arbitrage based on put–call parity, box spreads and other spreads, more efficient; b) Low margin deposit Requirements; c) Low Brokerage; d) Computerized trading of op-tions and futures (in Futures & Opop-tions seg-ment of NSE) and the underlying shares (in Cash Market segment) in the same exchange is expected to make the derivatives and cash trading systems much better integrated; e) Computerized trading allows the traders to identify and execute arbitrage opportunities with greater ease and speed and lower trans-action costs (using computer programs); f) Transaction costs are comparatively less for arbitrageurs due to order-driven trading mechanism and cash settlement of deriva-tives. But, ban on short sales in the cash
mar-ket of NSE India, would affect the efficiency negatively. It may cause an overpricing of put contracts owing to inefficient hedging [As highlighted by Bharadwaj and Wiggins (2001); Ofeket al. (2004); Vipul (2009)]. Overall, based on the facilitating factors mentioned above, we expect higher efficiency for the Indian market in-spite of being a young mar-ket with order-driven marmar-ket microstructure. This present study considers time-stamped transaction prices (to obviate non-synchronicity) of Nifty options and gives a different picture compared to Vipul’s work by considering and forming only those box spreads which can be exercised by traders i.e. the first box spread that can be formed and exercised while using box spread strategy in real-time scenario rather than taking into con-sideration all possible box spreads, which might or might not be exercised as consid-ered by Vipul (2009) for the time period con-sidered between January 1 2002, till 31 De-cember 2005. This study tries to unravel the true picture about the internal market effi-ciency of F&O segment of NSE India.
National Stock Exchange (NSE),
India
NSE India provides a trading platform for of all types of securities for investors under one roof, namely Equity, Corporate Debt, Central and State Government Securi-ties, T-Bills, Commercial Paper (CPs), Cer-tificate of Deposits (CDs), Warrants, Mutual Funds (MFs) units, Exchange Traded Funds (ETFs) and Derivatives like Index Futures, Index Options, Stock Futures, Stock Options, Currency Futures and Interest Rate Futures. The National Stock Exchange, India, provides trading in 4 different segments namely the Wholesale Debt Market (WDM) segment, Capital Market (CM) segment, Futures & Options (F&O) segment and the Currency Derivatives Segment (CDS).
The derivatives trading at the National Stock Exchange, India commenced on June 12, 2000 with futures trading on S&P CNX Nifty Index. Over a period of time, the prod-uct base has increased substantially. Cur-rently, trading takes place in options on S&P CNX Nifty Index, futures and options on CNX IT, Bank Nifty, Nifty Midcap 50 Indi-ces and 190 single stocks as of March 2010. Since inception, NSE has established itself as the sole market leader in Futures and Op-tions segment in the country and during 2012-13, it accounted for 99 percent of the
mar-ket share in this segment. Table 2 shows the Number of Contracts traded and the turn-over of various Indices of F&O segment of NSE India. For the present study, S&P CNX Nifty Index is the underlying and NIFTY In-dex options are considered to test the inter-nal market efficiency of NSE India using Box Spread Strategy.
Derivatives Trading in India
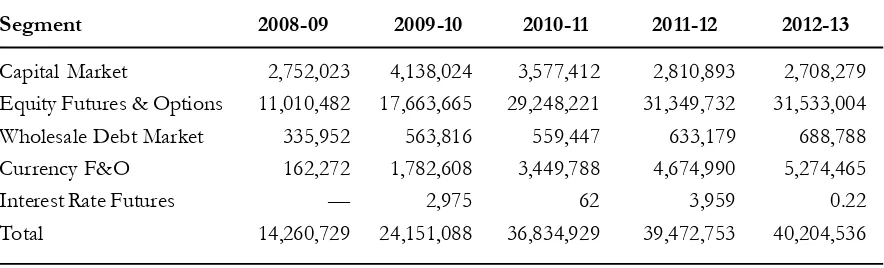
In June 2001, the Nifty Index options on S&P CNX Nifty index (underlying) started trading at the National Stock Exchange (NSE), India. The derivatives trading system at the National Stock Exchange, India, is called NEAT-F&O (National Exchange for Automated Trading – Futures & Options) trading system which is fully automated screen-based trading and is available for all kinds of derivative products available on NSE. The “Futures and Options Segment” and the “Equity Segment” of NSE, India are open for trading from Monday to Friday be-tween 9:55 a.m. to 3:30 p.m. Trading at both these two segments of NSE, India (i.e. in both Equity and Futures and Options Segments) is done through identical, computer-based open limit order-book systems without any market makers or specialists. In 2012-13, Table 3. Trading Value of Different Market Segments in NSE India
Segment 2008-09 2009-10 2010-11 2011-12 2012-13
Capital Market 2,752,023 4,138,024 3,577,412 2,810,893 2,708,279
Equity Futures & Options 11,010,482 17,663,665 29,248,221 31,349,732 31,533,004
Wholesale Debt Market 335,952 563,816 559,447 633,179 688,788
Currency F&O 162,272 1,782,608 3,449,788 4,674,990 5,274,465
Interest Rate Futures — 2,975 62 3,959 0.22
Total 14,260,729 24,151,088 36,834,929 39,472,753 40,204,536
Note: All values are in Rupees Crore
NSE accounted for nearly 99 percent of the total turnover of the derivative instruments which were having stock indices and indi-vidual stocks as the underlying. NEAT-F&O supports an anonymous order driven market, which operates on a strict price/time priority and provides tremendous flexibility to users, especially, in terms of kinds of orders that customers can place on the system. Various time and price related conditions such as Immediate or Cancel, Limit/Market Price, Stop Loss, etc. can be built into an order. Trad-ing in derivatives of NSE India is more or less similar to trading in securities in the Capi-tal Market segment of NSE India.
The Nifty options and futures are traded in monthly series where the last Thursday of the month is the expiration date for each se-ries. In real time, the best ‘buy’ and the best ‘sell’ orders are displayed on the computer screens of trading stations. Since NSE has
no market makers, both the ‘buy’ and ‘sell’ sides of the ex-post price of a transaction are available for traders as well as ex-ante price quotations before the transaction takes place. For this reason, the issue of market makers’ bid–ask spread is not important while look-ing out for an arbitrage transaction at NSE India. This is the reason why, only, transac-tion prices are used for identifying mispricing for present study.
The fact that trading of options and futures takes place in the same market seg-ment (i.e. F&O segseg-ment of NSE India) makes the market for these securities, better integrated than those markets which have a separate trading market for futures and sepa-rate trading market for options. The risk man-agement system, expiration dates and the settlement practices for these securities are similar in these segments. The best part is that equity shares are also traded in the same stock Table4. Benchmark Indices and Trading Volumes in Futures &Options Segment of
NSE India in 2012-13
Products Underlying No. of Contracts Turnover
Rs.cr. US $ bn
NIFTY CNX Nifty 862,519,602 23,890,021.53 4,392.41
BANKNIFTY BANK Nifty 46,458,215 1,318,166.29 242.36
MINI FTY CNX Nifty 7,243,050 77,690.99 14.28
CNXIT CNX IT 38,596 1,215.00 0.22
Nifty Midcap 50 Nifty Midcap 50 2,682 93.31 0.02
CNXINFRA CNXINFRA 146 3.67 0.00
CNXPSE CNXPSE 291 6.46 0.00
DJIA DJIA 206,680 6,826.57 1.26
S&P 500 S&P 500 65,512 2,322.68 0.43
FTSE100 FTSE100 442,760 12,358.35 2.27
TOTAL 916,977,534 25,308,704.86 4,653.25
exchange, but in a different segment i.e. Capi-tal Market (CM) segment with similar settle-ment and trading practices. Since trading of options and futures happens in the same mar-ket segment, there is a possibility of quick identification and execution of arbitrage transactions which require positions in op-tions and futures requiring low margin re-quirements. Traders enter their requisite or-ders into the computer server through their trading stations which are matched continu-ously and automatically. The computer screen-based system actually allows use of computer programs for identification of any kind of arbitrage opportunities and ensures quick execution if present. For option con-tracts which are ‘In the money’, the final ex-ercise settlement takes place at the closing value of Nifty i.e. on the last trading day of the option contract. The closing value of S&P CNX Nifty Index is the weighted average Nifty value during the last half hour of trad-ing in the Equity Segment of NSE India.
Box Spread Strategy
The box spread is a trading strategy in which one simultaneously buys and sells op-tions having the same underlying asset and time to expiration, but different exercise prices.
The most common strategies involving options only are:
Call and put spreads
Call and put butterfly spreads
Box spreads
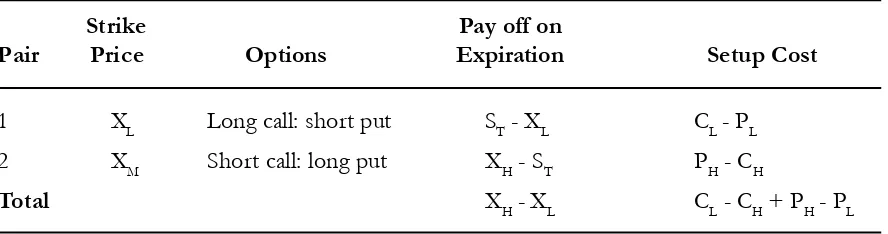
Long box spread is constructed by mak-ing use of 2 European calls and 2 European puts, all having the same underlying and the same expiration date. Out of these, one pair of put and call will have a lower strike price (XL) and the other pair of call and put will have higher strike price (XH). A long posi-tion in a box spread is set up as follows:
Table 5. Long Box Spread
Strike Pay off on
Pair Price Options Expiration Setup Cost
1 XL Long call: short put ST - XL CL - PL
2 XM Short call: long put XH - ST PH - CH
Total XH - XL CL - CH + PH - PL
Note: A long box spread requires positions in four option contracts. The two points of one call and one put option each at “low” and “high” strike prices, provide an expiration-day payoff of XH - XL. The setup cost is CL - CH + PH - PL on the trading day. ST is the expiration-day settlemen value of index. CH and CL are the call premiums for the strikes prices XH and XL, and PH and PL are the put premiums for the strike prices XH and XL.
1. Long a call option having the strike price at a premium
2. Short a put option having the strike price at a premium
3. Short a call option having the strike price at a premium
4. Long a put option having the strike price at a premium
A long box spread always requires a positive initial investment (CL - CH + PH - PL) because of the following reasons: a) Premium for a call with a lower strike price is always more than that of a premium for a call with a higher strike price. b) Similarly, Premium on a put with a higher strike price is always more than that of premium on a put with a lower strike price. As shown in Table 5 (Long Box Spread), the long box spread always provides a certain cash inflow (XH - XL) on the expira-tion day. Similarly, a short posiexpira-tion in a box spread can be created by taking positions opposite to the ones mentioned for long box spread. A short box spread will give an in-flow of (CL - CH + PH - PL) at the time of formation of box spread and it will require a certain payment (XH - XL) at the time of ex-piration. A profitable arbitrage is possible with a box spread is possible only when, the interest rate implicit in the box spread, is dif-ferent from the risk-free interest rate for the corresponding period. The reason for this is the fact that, both the setup cost (CL - CH + PH - PL) and the final payoff (XH - XL) do not have any uncertainty. But, arbitrage oppor-tunities are exploitable only if the profit ex-ceeds the transaction costs.
The Advantages of using Box-Spreads to carry forth clean test of market efficiency are:
a) Box spread significantly reduces joint hy-pothesis problem, i.e., In general, any test of market efficiency must invariably
as-sume some model of market equilibrium. But, by using box spreads to investigate market efficiency, we need not assume a particular option pricing model.
b) Analysis is computationally simple when no pricing model is assumed. Therefore, there are less chances of mis-specification error, estimation error. Example – We need not estimate market volatility, nor is there any need to calculate the impact of divi-dends or the possibility of early exercise on option prices etc.
c) Since trading box spreads involves only one market, we need not worry about in-ter-market non-synchronicity or the poten-tial difficulty of implementing an inter-market strategy for arbitrage purpose. d) Since we implement the box spread
strat-egy using European-style options, buying and selling box spreads more or less repli-cates risk-free lending and borrowing
Different types of Arbitrageurs
and Their Transaction Costs
Costs
Arbitrage opportunity exists only when return from box spread is different from the risk-free return. To construct a box spread, an arbitrageur incurs a cost. An arbitrageur usually considers both the relevant benefits and the costs associated before making his/ her decision. Only when the risk free return is greater than all the costs incurred, the arbitrageur may utilize arbitrage opportunity. The usual costs incurred are:
1. Payoff cost (XH - XL): 2 pairs of call and put options having the same underlying and expiration day
3. Interest on setup cost: If an arbitrageur goes long on box spread, then payoff is received only on the expiration day. The risk-free interest on the setup cost for this period is the opportunity cost of the arbitrageur. 4. Brokerage cost: Irrespective of long or short
position on box spread, the arbitrageur pays brokerage for each of the four con-tracts of the box spread.
5. Interest on margin deposit: Irrespective of long or short position on box spread, the arbitrageur has to take short position for two contracts at the beginning to create a box spread. Therefore, Margin money needs to be deposited with the exchange. Interest that could be earned by the arbitrageur during the holding period is an opportunity cost for the arbitrageur.
The margin deposit at NSE India de-pends on the value at risk (VaR) and it is cal-culated using Standard Portfolio Analysis of Risk (SPAN®) system of NSE.
Costs associated with different categories of Arbitrageurs
Transaction costs are different for dif-ferent class of arbitrageurs. Arbitrageurs can be broadly classified into 3 classes on the basis of the transaction costs incurred by each of them. In this study, transaction costs consid-ered are same as the ones considconsid-ered in Vipul’s (2009) study. They are:
a. General investors: For General investors, the rate of brokerage considered is about 0.04 percent of the “strike price plus option premium” of the contract. General inves-tor loses the interest opportunity on the margin deposit and loses (gains) the inter-est on the setup cost for a long (short) position.
b. Institutional investors: The brokerage for an Institutional investor is about 0.03 percent of the “strike price plus option premium” of the contract. But Institutional inves-tors have an advantage, especially in the brokerage, because of the volumes they trade. Overall transaction costs for insti-tutional investors are similar to those for the general investors except for the bro-kerage.
c. Members: Brokerage cost is not applicable to Members of the exchange because, they themselves are brokers. However, on a conservative note, overall transaction cost is assumed to be 0.03 percent (the same as that for the institutional investors) be-cause of back office and other costs.
The interest on the setup cost affects all the categories of arbitrageurs in a similar fashion.
Methods
Data
The high-frequency time stamped data of call and put options written on S&P CNX Nifty Index are used for the study. The time-stamped data of transaction prices of are pro-vided by National Stock Exchange of India for the time period between 1st January 2002
and 31st December 2005. In the time period
that can be formed and exercised while using box spread strategy in real-time scenario rather than taking into consideration all pos-sible box spreads, which might or might not be exercised.
Identifying Box-Spreads
Stage 1: Pairing
Pairs of put and call options were made such that their strike prices and expiration dates matched. For optimal utilization of less numerous put transactions, put options were taken as the starting point for pairing. For each put transaction, the first call transaction fol-lowing it was selected for pairing. Call trans-actions were not repeated across pairs.
Stage 2: Second level of pairing
Objective in this stage was to identify two pairs (a quartet) of put and call options, such that their expiration dates match, but the strike prices differed
Stage 3: Sourcing risk free interest rates
The risk-free interest rates were sourced from the daily ‘Zero-coupon yield curve’ (ZCYC) database of NSE India. NSE India estimates the ZCYC for each day, from the market prices of the Treasury bills (T-bills) and Treasury bonds (T-bonds) of the Gov-ernment of India, traded on the “Wholesale Debt Market” Segment of NSE India. ZCYC is estimated using the Nelson–Siegel func-tional form (Nelson & Siegel 1987).
Stage 4: Testing for arbitrage opportunity
Each quartet (of two calls and two puts) was tested for arbitrage opportunities. An ar-bitrage was possible with long or the short box-spread strategy
Arbitrage Profit for Long Box-Spread Strategy,
APLB= (XH - XL) - (CL - PL + PH - CH) [1 + r(T t)] M[r(T t)] -B[1 + r(T - t)]
Similarly,
Arbitrage Profit for Short Box-Spread Strat-egy,
APSB= (CL - PL + PH - CH)[1 + r(T t)] -(XH - XL) M[r(T t)]
-B[1 + r(T - t)]
Where,
M= Margin deposit B= Brokerage
R= risk-free interest rate T= Date of expiration
t= Date of setting up the box spread In both the cases of APLB and APSB, the investment required was always positive. The opportunity cost of Margin deposit and the Brokerage differs for the three categories of arbitrageurs, makes the profit opportuni-ties different. We performed a statistical test to the result of arbitrageur opportunity with one sample t-test. We tested whether the re-sult i.e. Arbitrage profit identified, was sig-nificantly different from zero (Null Hypoth-esis: Arbitrage profit is equal to zero)
Stage 5: Analysis of mispricing
Mispricing is defined as follows: (Vipul 2009)
Mispricing, whether positive or nega-tive, was potentially a source of arbitrage opportunity. Therefore, the absolute value of mispricing was considered. We statistically tested whether the mispricing identified was significantly different from zero. (Null Hy-pothesis: Mispricing is equal to zero)
Findings
The total number of Nifty Index call options in the time period between 1st
Janu-ary 2002 and 31st December 2005 was
795,137 and Number of Nifty Index put
op-tions was 634,419. In the first level of pair-ing, pairs of put and call options were made such that their strike prices and expiration dates matched and for optimal utilization of less numerous put transactions, put options were taken as the starting point for pairing. 42,014 pairs of put and call options were made in this stage. In the second stage of pairing, the objective was to identify two pairs (a quartet) of put and call options, such that their expiration dates match, but the strike prices differed. 1,358 box spreads were tified after this stage. The box-spreads iden-tified were statistically significant at 1
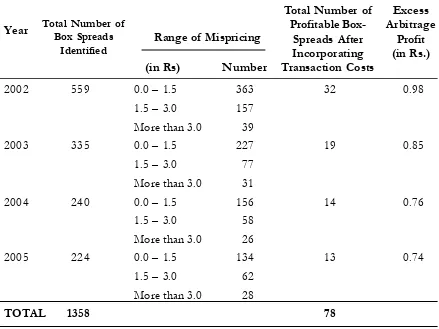
per-Table 5.Range of Mispricing and Excess Arbitrage Profit by using Box-Spread Arbi-trage Strategy for S&P CNX Nifty Index Options
Year
(in Rs) Number
2002 559 0.0 – 1.5 363 32 0.98
1.5 – 3.0 157
More than 3.0 39
2003 335 0.0 – 1.5 227 19 0.85
1.5 – 3.0 77
More than 3.0 31
2004 240 0.0 – 1.5 156 14 0.76
1.5 – 3.0 58
More than 3.0 26
2005 224 0.0 – 1.5 134 13 0.74
1.5 – 3.0 62
More than 3.0 28
TOTAL 1358 78
***Excess arbitrage profit after incorporating transaction costs was found to be statistically significant at 1 percent significance level rejecting the Null hypothesis that Excess Arbitrage Profit is equal to zero
Total Number of Box Spreads
Identified Range of Mispricing
Total Number of Profitable
Box-Spreads After Incorporating Transaction Costs
Excess Arbitrage
cent significance level and hence we reject the null hypothesis that arbitrage profit is equal to zero. The risk-free interest rates were sourced from the daily ‘Zero-coupon yield curve’ (ZCYC) database of NSE India. For the time period considered i.e. 1/1/2002 and 31/5/2005, the minimum, maximum and mean values of interest rates are 4.43 per-cent, 6.93 percent and 5.54 percent respec-tively. Out of 1,358 Box spreads identified for the time period considered, only 78 box spreads were actually profitable after incor-porating transaction costs i.e. 32 profitable box spreads were identified for the year 2002, 19 profitable box spreads were identified for the year 2003, 14 profitable box spreads were identified for the year 2004 and 13 profitable box spreads were identified for the year 2005. All the profitable box-spreads from 2002-05 after incorporating transaction costs were found to be statistically significant at 1 per-cent significance level.
In Vipul’s (2009) study, it was found that profit opportunities, after accounting and incorporating transaction costs, were quite frequent, but, they did not persist even for 2 minutes. The fact that the arbitrage opportu-nities did not persist even for two minutes, indicated that the arbitrageurs did not ignore the mispricing for a long time. The focus of Vipul’s study was to highlight all possible box spreads (which might or might not have been exercised) and its persistence. However, in this study, only those box spreads which could have been exercised by traders i.e. the first box spread that can be formed and exercised while using box spread strategy in real-time scenario has been highlighted. This is the rea-son why, only 78 profitable box spreads were found. This study unravels the true picture about the internal market efficiency of F&O segment of NSE India.
Conclusion
The main objective of this study was to examine the efficiency of European style S&P CNX Nifty Index options of NSE, In-dia, by making use of high-frequency data on put and call options written on Nifty (Time-stamped transactions data). For this study, the time period between 1st January 2002 and 31st
References
Ackert, L. F., and Tian, Y. S. 2001. Efficiency in index options markets and trading in stock baskets. Journal of Banking and Finance 25: 1607–1634.
Benzion, U., Danan, S., and Yagil, J. 2005. Box spread strategies and arbitrage opportunities. Journal of Derivatives 12: 47–62.
Bharadwaj, A., and Wiggins, J. B. 2001. Box spread and put call parity tests for the S&P 500 Index LEAPS Market. Journal of Derivatives 8: 62–71.
Billingsley, R. S., and Chance, D. M. 1985. Options market efficiency and the box spread strategy. Finan-cial Review 20: 287–301.
Blomeyer, E. C., and Boyd, J. C. 1995. Efficiency tests of options on Treasury bond futures contracts at the Chicago Board of Trade. International Review of Financial Analysis 4: 169–181.
Brunetti, M., and Torricelli, C. 2007. The internal and cross market efficiency in index option markets: an investigation of the Italian market. Applied Financial Economics 17: 25-33.
Capelle-Blancard G., and Chaudhury M. 2001. Efficiency tests of the French index (CAC 40) options market. Working paper. McGill Finance Research Center.
Cavallo L., and Mammola P. 2000. Empirical tests of efficiency of the Italian index options market. Journal of Empirical Finance 7: 173-193.
Evnine J., and Rudd A. 1985. Index options: the early evidence. Journal of Finance 40: 743-756. Fung, J. K. W., Mok, H. M. K., and Wong, K. C. K. 2004. Pricing efficiency in a thin market with
competitive market makers: Box spread strategies in the Hang Seng Index Options Market. Finan-cial Review 39: 435–454.
Hemler, M. L., and Miller, T. W. 1997. Box spread arbitrage profits following the 1987 market crash: Real or illusory? Journal of Financial and Quantitative Analysis 32: 71–90.
Kamara, A., and Miller, T.W. 1995. Daily and intra-daily tests of European put–call parity. Journal of Financial and Quantitative Analysis 30: 519–539.
Marchand, P. H., Lindley, J. T., and Followill, R. A. 1994. Further evidence on parity relationships in options on S&P 500 index futures. Journal of Futures Markets 14: 757–771.
Mittnik S., and Rieken S. 2000. Put-call parity and the informational efficiency of the German DAX-index options market. International Review of Financial Analysis 9: 259-279.
NSE Fact book. 2012. Futures and Options Segment of NSE India. 2012. (http://www.nseindia.com) Ofek, E., Richardson, M., and Whitelaw, R. F. 2004. Limited arbitrage and short sales restrictions:
Evi-dence from the options markets. Journal of Financial Economics 74: 305–342.
Ronn, A. G., and Ronn, E. I. 1989. The box spread arbitrage: Theory tests and investment strategies. Review of Financial Studies 2: 91–108.
Vipul. 2009. Box spread Arbitrage efficiency of Nifty Index Options: The Indian Evidence. The Journal of Futures Markets 29: 544–562.