Full Terms & Conditions of access and use can be found at
http://www.tandfonline.com/action/journalInformation?journalCode=vjeb20
Download by: [Universitas Maritim Raja Ali Haji] Date: 11 January 2016, At: 20:47
Journal of Education for Business
ISSN: 0883-2323 (Print) 1940-3356 (Online) Journal homepage: http://www.tandfonline.com/loi/vjeb20
As Compared to What? Characteristics of the
AACSB Institutions That Utilize the Major Field Test
in Business
Agnieszka Bielinska-Kwapisz & F. William Brown
To cite this article: Agnieszka Bielinska-Kwapisz & F. William Brown (2014) As Compared to What? Characteristics of the AACSB Institutions That Utilize the Major Field Test in Business, Journal of Education for Business, 89:7, 373-381, DOI: 10.1080/08832323.2014.916648
To link to this article: http://dx.doi.org/10.1080/08832323.2014.916648
Published online: 29 Sep 2014.
Submit your article to this journal
Article views: 38
View related articles
As Compared to What? Characteristics
of the AACSB Institutions That Utilize the Major
Field Test in Business
Agnieszka Bielinska-Kwapisz and F. William Brown
Montana State University, Bozeman, Montana, USA
The publishers of the Major Field Test in Business (MFT-B), an assessment of learning instrument, provide a list of institutions utilizing the instrument and a table that allows for comparison of local MFT-B mean scores to those of other institutions. The absence of information regarding the comparison group’s characteristics limits the validity of that comparison. This study provides a comparison of the institutions accredited by the Association to Advance Collegiate Schools of Business International, those that use the MFT-B and those accredited institutions that do not, and an estimation of the probability that a school will use the MFT-B for assessment purposes.
Keywords: accreditation, assessment, characteristics, comparison, Major Field Test in Business, MFT, prediction
The Major Field Test in Business (MFT-B) is a widely used assessment of learning (AOL) instrument intended for use in undergraduate business programs. The Educational Test-ing Service (ETS), publisher of the MFT-B, describes the instrument as going beyond an assessment of factual knowl-edge regarding business by evaluating senior students’ abil-ity to analyze and solve problems, understand relationships, and interpret material from their major field of study (ETS, 2013a). The 120 multiple-choice questions in the MFT-B cover topics in nine subject areas: accounting, economics, management, quantitative business analysis, finance, mar-keting, legal and social environment, information systems, and international issues. This value proposition has attracted considerable attention among undergraduate business insti-tutions in the United States. The ETS reports that from Sep-tember 2010 to June 2012, 585 institutions in the United States utilized the MFT-B in their assessment of their busi-ness students’ learning (ETS, 2013a).
Given its wide usage, it is not surprising that the MFT-B has attracted considerable attention from researchers. To date, almost all of that attention has been directed toward efforts to identify student performance determinants.
Standardized test scores (ACT/SAT), grade point averages (GPA), major field of study, and gender have been consis-tently cited as determinative covariates (e.g., Allen & Bycio, 1997; Bagamery, Lasik, & Nixon, 2005; Barboza & Pesek, 2012; Bean & Bernardi, 2002; Benham, Bielinska-Kwapisz, & Brown, 2012; Bielinska-Kwapisz, Brown, & Semenik, 2012a, 2012b; Black & Duhon, 2003; Bycio & Allen; 2007; Contreras, Badua, Chen, & Adrian, 2011; Gerlich & Sollosy, 2009; Mason, Coleman, Steagall, Gallo, & Fabritius, 2011; Mirchandani, Lynch, & Hamilton, 2001; Rook & Tanyel, 2009; Settlage & Settlage, 2011; Terry, Mills, Rosa, & Sol-losy, 2009; Zeis, Waronska, & Fuller, 2009). All of these studies use a specific institution’s data in order to gain insight into their students’ performance. While these efforts can be helpful in understanding local performance, Bielin-ska-Kwapisz et al. (2012a) and others (e.g., Black & Duhon, 2003; Bycio & Allen; 2007; Contreras et al., 2009; Green, Stone, & Zegeye, 2014) have pointed out that when inter-preting an MFT-B institutional mean, the referent institution’s characteristics need to be taken into account in order to make that interpretation meaningful.
Following administration of the MFT-B, the ETS gener-ates a local institutional mean total score and nine assess-ment indicators associated with each of the previously described topical areas. While comparisons to scores from previously administered exams may be of interest, prior research has consistently shown that the primary way Correspondence should be addressed to F. William Brown, Montana
State University, Jake Jabs College of Business and Entrepreneurship, P.O. Box 173040, Bozeman, MT 59717–3040, USA. E-mail: [email protected]
ISSN: 0883-2323 print / 1940-3356 online DOI: 10.1080/08832323.2014.916648
institutions interpret their performance is through a compar-ison of their institutional mean total score to national aver-ages (Bush, Duncan, Sexton, & West, 2008; McLaughlin & White, 2007; Wilson, 2008; Word & Rook, 2012). The ETS enables these comparisons by providing data tables that supply scaled scores and percentiles for institutional means drawn directly from all administrations of the MFT-B during a focal period (ETS, 2013b). These tables allow for the comparison of school performance with all other domestic schools administering the MFT-B during the same period. An examination of the table permits a deter-mination as to how many institutions in the data had mean scores lower than the local score. However, this comparison is not meaningful if AACSB schools that do use MFT-B are not a random sample of all AACSB schools. Therefore, the purpose of this study was to determine if there are signifi-cant differences between programs that do and do not use MFT-B for assessment purposes and what are the character-istics of schools that are most likely to adopt MFT-B. If sig-nificant differences between these programs exist, then any comparison of local MFT-B scores to the Institutional Means Score Distribution, which ETS provides, has signifi-cant limitations. Smith, Clements, and Olson (2010), describing advantages of the MFT-B test, stated, “the most frequently cited advantage is the ability to compare scores across national norms. . . . If a school’s percentile ratings
are good, recruiters and public relations personnel may use those results in promotional materials to substantiate the quality of the college” (p. 251). However, Green et al. (2014) had a very different view and opined that the unknown nature of the comparison group constituted a major drawback of the MFT-B assessment: “A student’s scaled score depends on his/her performance relative to that of all students who took the test. Who are these students?” (p. 22). They pointed out that “even choosing to compare an institution’s scores only against others accredited by or members of an accrediting agency is problematic as there are considerable quality differences across those institutions” (Green et al., 2014, p. 7). This general problem is recognized by ETS, which notes that MFT-B score distri-butions should be comparative rather than normative, “because the institutions included in the data do not repre-sent proportionally the various types of higher education institutions” (ETS, 2013a, p. 5).
Unlike widely taken individual aptitude tests (e.g., SAT, ACT, GRE, GMAT), there is no reason to believe, in the case of the MFT-B, that the comparison scores necessarily come from typical or similarly situated undergraduate busi-ness programs. At present, we know little about the schools that use MFT-B assessment and there has not been any sys-tematic examination to determine if the schools in the com-parison group are representative of undergraduate business schools in general, or the Association to Advance Colle-giate Schools of Business (AACSB) International accred-ited schools specifically. As is more completely explained
in the Data section, in 2011–2012 there were 477 AACSB-accredited undergraduate business programs in the United States. From September 2010 to June 2012, 585 institutions utilized the MFT-B but only 196 of these (34%) were AACSB-accredited. Institutions pointing to their MFT-B scores and percentile rankings as evidence that their pro-gram is fulfilling or making progress toward its stated mis-sion, or that its students have a particular rank in business knowledge as compared to all other undergraduates, are in fact utilizing a referent group in which a minority (one third) have AACSB accreditation status. Thus, they run the risk of over- or misstating the true nature of their rankings.
Our study seeks to begin closing this gap in the literature by providing the first systematic, detailed description of schools that use MFT-B assessment and comparing them to schools that do not use MFT-B. The MFT-B is often a cor-nerstone of institutional AOL programs and the results play an important role in curricular and accreditation decisions. A major part of our study’s analysis is a data-based descrip-tion of MFT-B utilizadescrip-tion by AACSB-accredited business schools and the characteristics of those schools. Our study also includes a probability estimate for whether or not a given school will use the MFT-B for assessment purposes. As of 2013, the base price for the online version of the exam was $25 per test ($24 for more than 100 tests) and the paper-based version price was $27 each ($26 for more than 100 tests; Educational Testing Service, 2013a). Our study’s results should be of value because the test is relatively expensive and utilized for a significant purpose, and appro-priate interpretation of scores is important.
RESEARCH QUESTIONS
The study is informed and inspired by the following factors:
the widespread use of the MFT-B,
the demonstrated interest of institutions utilizing the MFT-B to comparing their local scores to those of other institutions and national means,
the almost complete lack of any information regard-ing the MFT-B comparison group provided by the ETS, and
the critical importance of an understanding the char-acteristics of the referent group in order to make com-parisons to local scores useful and meaningful.
The following two research questions were used to guide this study:
Research Question 1(RQ1): Are AACSB-accredited insti-tutions using the MFT-B significantly different than the ones that do not use the MFT-B?
RQ2: What factors affect the probability that a school will adopt the MFT-B?
374 A. BIELINSKA-KWAPISZ AND F. W. BROWN
In order to compare schools that use and do not use MFT-B we use the following institutional variables: school general and scholarly orientation (as defined by the AACSB), Carnegie Class classification, public or private institution, enrollment, number of full time faculty, percent of full time faculty with doctoral degrees, number of full time equivalent faculty, student–faculty ratio, percent of participating faculty, geographical region, percent of other schools in the state that use the MFT-B test, types of degree offered, tuition, and budget data (see Table 1).
Answers to these questions will help institutions to better understand both the potential benefits and limita-tions associated with the comparison of their local scores to the ETS provided means. Results should also be help-ful to institutions contemplating use of the MFT-B as it will provide, for the first time, some systematic analysis to accompany heretofore entirely intuitive assumptions regarding the characteristics of referent institutions, par-ticularly those holding AACSB accreditation. Finally, the results of this study will provide the first empirical con-tributions to an emerging discussion regarding the valid-ity of using the MFT-B as an assessment tool. Green et al. (2014) opined that comparisons of MFTB
performances “across institutions are invalid because the test results are significantly driven by individual student characteristics of an unknown (and unknowable) group of students enrolled at diverse nonrandom business schools” (p. 24).
METHOD
Participants
We matched information regarding all the available charac-teristics of U.S. AACSB-accredited institutions (AACSB, 2013) with the ETS list of schools that use the MFT-B (2013b). The focus of our study is limited to data from insti-tutions that offer undergraduate business degrees.
Data
Previous studies utilized surveys to estimate the percentage of AACSB institutions utilizing the MFT-B. Martell (2007) estimated that 46% of AACSB-accredited schools used the MFT-B as an assessment method, while Pringle and Michel
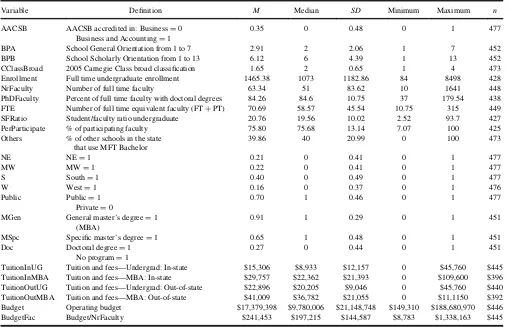
TABLE 1
Descriptive Statistics for Schools With Undergraduate Programs (Eliminates 15 Schools That Do Not Offer Undergraduate Education)
Variable Definition M Median SD Minimum Maximum n
AACSB AACSB accredited in: BusinessD0 Business and AccountingD1
0.35 0 0.48 0 1 477
BPA School General Orientation from 1 to 7 2.91 2 2.06 1 7 452 BPB School Scholarly Orientation from 1 to 13 6.12 6 4.39 1 13 452 CClassBroad 2005 Carnegie Class broad classification 1.65 2 0.65 1 4 473 Enrollment Full time undergraduate enrollment 1465.38 1073 1182.86 84 8498 428 NrFaculty Number of full time faculty 63.34 51 83.62 10 1641 448 PhDFaculty Percent of full time faculty with doctoral degrees 84.26 84.6 10.75 37 179.54 438 FTE Number of full time equivalent faculty (FTCPT) 70.69 58.57 45.54 10.75 315 449 SFRatio Student/faculty ratio undergraduate 20.76 19.56 10.02 2.52 93.7 427 PerParticipate % of participating faculty 75.80 75.68 13.14 7.07 100 425 Others % of other schools in the state
that use MFT Bachelor
39.86 40 20.99 0 100 473
NE NED1 0.21 0 0.41 0 1 477
MW MWD1 0.22 0 0.41 0 1 477
S SouthD1 0.40 0 0.49 0 1 477
W WestD1 0.16 0 0.37 0 1 476
Public PublicD1 PrivateD0
0.70 1 0.46 0 1 477
MGen General master’s degreeD1 (MBA)
0.91 1 0.29 0 1 451
MSpc Specific master’s degreeD1 0.65 1 0.48 0 1 451 Doc Doctoral degreeD1
No programD1
0.27 0 0.44 0 1 451
TuitionInUG Tuition and fees—Undergrad: In-state $15,306 $8,933 $12,157 0 $45,760 $445 TuitionInMBA Tuition and fees—MBA: In-state $29,757 $22,362 $21,393 0 $109,600 $396 TuitionOutUG Tuition and fees—Undergrad: Out-of-state $22,896 $20,205 $9,046 0 $45,760 $440 TuitionOutMBA Tuition and fees—MBA: Out-of-state $41,009 $36,782 $21,055 0 $11,1150 $392 Budget Operating budget $17,379,398 $9,780,006 $21,148,748 $149,310 $188,680,970 $446 BudgetFac Budget/NrFaculty $241,453 $197,215 $144,587 $8,783 $1,338,163 $445
(2006) estimated that 30% of AACSB-accredited business schools used the MFT-B. The AACSB reports that in 2011–2012 there were 477 U.S. AACSB-accredited schools offering undergraduate business degrees (65% of which were accredited in business and 35% in both business and accounting; AACSB, (2013). We summarize defini-tions and descriptive statistics regarding these institudefini-tions in Table 1. Of the 477 institutions that held an accreditation of their undergraduate business program during 2011– 2012, 41% (nD196) administered the MFT-B during the most recent reporting period.
Amongst the AACSB-accredited institutions 70% were public, 91% offered master’s general degrees, 65% offered master’s specific degrees, and 27% offered doc-toral degrees. The mean undergraduate in-state tuition was $15,306, with a median of $8,933. The mean out-of-state tuition was $22,897, with a median of $20,206. The mean institutional operating budget was $17,379,398 with a median of $9,780,006 and ranged from $149,310 to $188,680,970. The mean budget per faculty member was $241,453. The mean enrollment was 1,465 students, with 63 full time faculty members and 21:1 student-to-faculty ratio. On average, 84% of the full time faculty had a PhD and 76% were partici-pating faculty.
We divided the states in which the AACSB-accredited institutions were located into regions according to the U.S. Census Bureau classification. An examination of that distri-bution reveals that 40% of the schools were located in the South (S), 22% in the Midwest (MW), 21% in the Northeast (NE), and 16% in the West (W). The AACSB categorizes schools according to their general and scholarly orientation.1
The general orientation consists of seven categories (Business Priority Category A [BPA]-1–7) and lists schools with high, medium, and low emphasis in teach-ing, intellectual contributions, and service. Teaching was the high emphasis of almost half of the AACSB-accred-ited schools (46%), followed by institutions with an equal orientation toward teaching and intellectual contributions emphasis (32%). The scholarly orientation consists of 13 categories (BPB-1 to BPB-13) and lists schools as high, medium, and low emphasis in Discipline-based scholar-ship, contributions to practice and learning and pedagogi-cal research. Discipline-based Scholarship was high emphasis for 24% of the AACSB-accredited schools, fol-lowed by equal emphasis on discipline-based scholarship and contributions to practice (14%), equal emphasis on discipline-based scholarship and contributions to practice and learning, and pedagogical research (13%), and by contributions to practice (12.9%).
The Carnegie Foundation for the Advancement of Teaching provides a classification scheme of colleges and universities.2The largest percentage of AACSB-accredited institutions, 34%, were classified as master’s colleges and universities (larger programs), followed by research univer-sities (high research activity; 19%), and research universi-ties (very high research activity (15%). Aggregating to the broad categories, most of the focal schools were master’s colleges and universities (48%) or research universities and doctoral/research universities (43%).
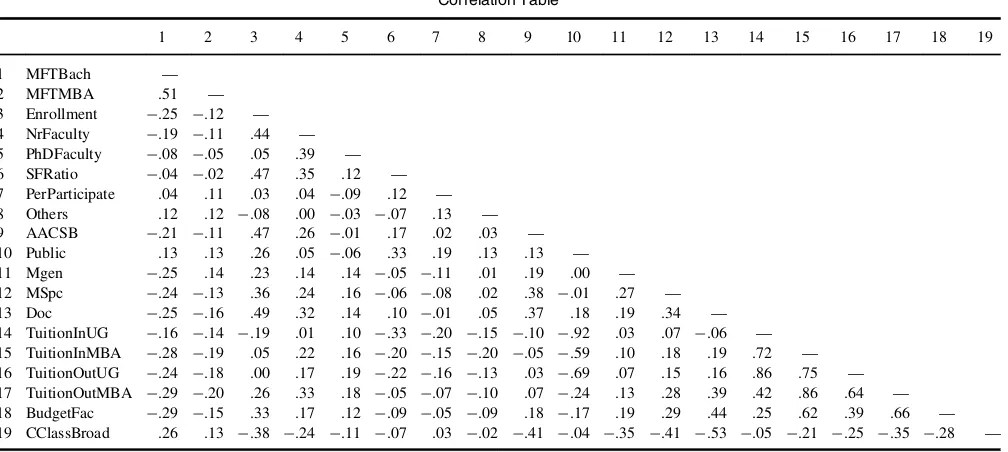
Table 2 shows correlations between all institutional vari-ables. As expected, private schools charge significantly higher tuition. Not surprisingly, operating budget per fac-ulty member was higher in schools that charge higher in-and out-of-state tuition.
TABLE 2 Correlation Table
1 2 3 4 5 6 7 8 9 10 11 12 13 14 15 16 17 18 19
1 MFTBach — 2 MFTMBA .51 — 3 Enrollment ¡.25 ¡.12 — 4 NrFaculty ¡.19 ¡.11 .44 — 5 PhDFaculty ¡.08 ¡.05 .05 .39 — 6 SFRatio ¡.04 ¡.02 .47 .35 .12 — 7 PerParticipate .04 .11 .03 .04 ¡.09 .12 — 8 Others .12 .12 ¡.08 .00 ¡.03 ¡.07 .13 — 9 AACSB ¡.21 ¡.11 .47 .26 ¡.01 .17 .02 .03 — 10 Public .13 .13 .26 .05 ¡.06 .33 .19 .13 .13 — 11 Mgen ¡.25 .14 .23 .14 .14 ¡.05 ¡.11 .01 .19 .00 — 12 MSpc ¡.24 ¡.13 .36 .24 .16 ¡.06 ¡.08 .02 .38 ¡.01 .27 — 13 Doc ¡.25 ¡.16 .49 .32 .14 .10 ¡.01 .05 .37 .18 .19 .34 — 14 TuitionInUG ¡.16 ¡.14 ¡.19 .01 .10 ¡.33 ¡.20 ¡.15 ¡.10 ¡.92 .03 .07 ¡.06 — 15 TuitionInMBA ¡.28 ¡.19 .05 .22 .16 ¡.20 ¡.15 ¡.20 ¡.05 ¡.59 .10 .18 .19 .72 — 16 TuitionOutUG ¡.24 ¡.18 .00 .17 .19 ¡.22 ¡.16 ¡.13 .03 ¡.69 .07 .15 .16 .86 .75 — 17 TuitionOutMBA ¡.29 ¡.20 .26 .33 .18 ¡.05 ¡.07 ¡.10 .07 ¡.24 .13 .28 .39 .42 .86 .64 — 18 BudgetFac ¡.29 ¡.15 .33 .17 .12 ¡.09 ¡.05 ¡.09 .18 ¡.17 .19 .29 .44 .25 .62 .39 .66 — 19 CClassBroad .26 .13 ¡.38 ¡.24 ¡.11 ¡.07 .03 ¡.02 ¡.41 ¡.04 ¡.35 ¡.41 ¡.53 ¡.05 ¡.21 ¡.25 ¡.35 ¡.28 — 376 A. BIELINSKA-KWAPISZ AND F. W. BROWN
RESULTS
Simple Comparisons
There are numerous significant differences between AACSB schools that use and do not use the MFT-B test for their assessment purposes. Institutions that do not utilize the MFT-B have significantly higher enrollment (1,717 vs. 1,105;t D 5.76; dfD 426), more faculty (76 vs. 45; t D
4.60;df D341), a slightly higher percent of faculty with PhDs (85% vs. 83%;tD1.65;df D418), higher all types of tuition (e.g., in-state undergraduate tuition $16,928 vs. $13,027; t D 3.48; df D 431), budgets ($22,829,361 vs. $9,690,531;t D7.67;df D382), and budgets per faculty members ($277,141 vs. $191,298; t D 7.22; df D 372). Most of the differences were highly significant suggesting that AACSB-accredited institutions using the MFT-B sig-nificantly differ from the ones that do not. We observed no significant differences between the student–faculty ratio (21 vs. 20;tD0.91;df D408) and percentage of partici-pating faculty (75% vs. 76%;tD0.73;df D366).
Our examination of the proportional measures confirmed and further illuminated these differences with significantly more public than private universities use the MFT-B (45% vs. 33%;x2D5.2;df D1) and significantly more schools
which are accredited only in business vs. business and accounting use the MFT-B (50 vs. 27%;x2D24.1;df D1). In addition, AACSB-accredited undergraduate institutions utilizing the MFT-B are more likely to offer only a general master’s degree (81% vs. 38%;x2D27.9;df D1) and not any specific master’s degrees (33% vs. 58%; x2 D 25.3; dfD1) or doctorates (21% vs. 49%;x2D29.2;df D1) than those institutions that do not utilize the MFT-B.
We found some significant differences between the four geographical regions with the MFT-B used the most in the South (48% of AACSB schools) and the least in the West (31%). The four-sample test for equality of proportions was rejected at the .05 significance level (x2D7.92; pD.048; df D3).
Most importantly, we found significant differences between schools’ general orientations with the highest pro-portion of AACSB schools that use the MFT-B having teaching as high emphasis: 58% of schools coded as BPA-1 and 56% of schools coded as BPA-6 using the MFT-B. Only 13% of AACSB-accredited undergraduate business institutions, with intellectual emphasis as a high emphasis used the MFT-B. There were no schools with a BPA-4 cate-gory and one with BPA-3. Therefore, we removed these categories from the sample due to not having enough obser-vations. The null hypothesis of no differences between the five BPA categories was rejected at 1% significance level using the 5-sample test for equality of proportions (x2D60.89,pD1.9e-12;df D4).
Similarly, we found significant differences while com-paring proportions of schools using the MFT-B with respect
to their scholarly orientation with schools coded as BPB-9 (equal emphasis on discipline-based scholarship and learn-ing & pedagogical research) uslearn-ing the MFT-B the most (75%) and BPB-5 (learning and pedagogical research) and BPB-1 (discipline-based scholarship) using the MFT-B the least (25% and 29%, respectively).
Using the broad Carnegie Class 2005 classification, 77% of baccalaureate colleges, 51% of master’s colleges and universities, and only 27% of research universities used the MFT-B test. The class 4 defined as other schools had only four observations and we removed it from the analysis. We rejected the null hypothesis of no differences between the three Carnegie categories at a 1% significance level using the 3-sample test for equality of proportions (x2D41.52, pD9.65e-10;df D9).
In summary, the previous analysis of the data associated with Research Question 1 indicates that AACSB-accredited undergraduate business programs that utilize the MFT-B tend to have the following characteristics as compared to AACSB-accredited undergraduate business programs that do not have the following:
lower enrollment,
less faculty,
a slightly lower percentage of PhD faculty,
charge lower tuition,
have lower operating budgets and lower budgets per faculty member,
are predominantly public institutions,
are less likely to have PhD- or master’s-specific programs,
are more likely to be AACSB-accredited in business. only (as opposed to business and accounting),
tend to have a general teaching orientation, and
tend to have Carnegie classification of baccalaureate.
Estimation: Factors Affecting Probability That a School Uses the MFT-B
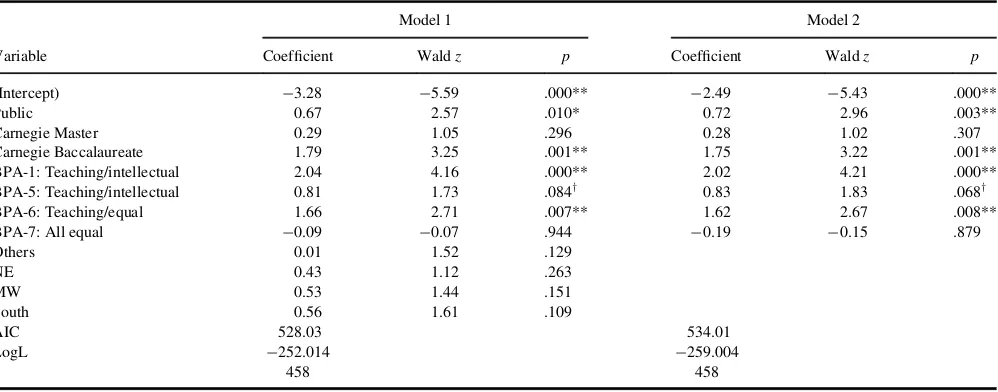
To address Research Question 2, we ran a logistic regres-sion to identify factors affecting the probability that an AACSB institution uses the MFT-B. We estimated the fol-lowing model:
Prob.MFT¡BD1/DF.Carnegie Classification; General Orientation;Public;Others;Region/: .1/
In the previous equation, the Carnegie Classification is a set of dummy variables for Master and Baccalaureate Carnegie Classifications. Institutions in the data set with a Carnegie Classification of Research Universities were used as a reference category (as before, Carnegie Other Category was omitted due to too small sample size). The General Orientation is a set of dummy variables for schools general
orientation. We chose General Orientation High Emphasis on Intellectual Contributions (BPA-2) as a reference cat-egory (as before, we omitted BPA-3 and BPA-4 due to too small sample size). In Equation 1, Public is a dummy variable that takes a value of one when an institution is public and zero when private and Others variable is a percentage of other schools in a given state that utilize the MFT-B (not including itself). Finally, Region is a set of dummy variables that control for schools’ geographi-cal location. For Region, West was chosen as a reference category.
Because Carnegie Classification and General Orientation correlate (Table 2) with many other characteristics (full-time enrollment, number of full-(full-time faculty, percent of full-time faculty with doctoral degrees, operating budget, and tuition), these variables were used to control for the type of the school. Because the dependent variable (use of MFT-B) was binary, we estimated the model using a logis-tic regression. We report results in Table 3. Two models are presented where Model 1 includes and Model 2 excludes regional dummies.
Study results indicate that schools with a Carnegie Classification of Baccalaureate are much more likely to adopt the MFT-B than research universities. Schools with high emphasis on teaching contributions (BPA-1, BPA-5, and BPA-6) are much more likely to use the MFT-B as compared to schools with high emphasis on intellectual contributions (BPA-2). Public schools were more likely to use the MFT-B than private institutions. Holding all other variables constant, the odds that a pub-lic university will use the MFT-B, over the odds that a private university would, is 1.95 (exp(0.67)). In other words, in terms of percentage change, the odds that a public institution with an AACSB-accredited
undergraduate business program would utilize the MFT-B are 95% higher than for an otherwise similarly situated private institution. We found no effect for regional differ-ences or the percentage of other schools using the MFT-B in the focal state.
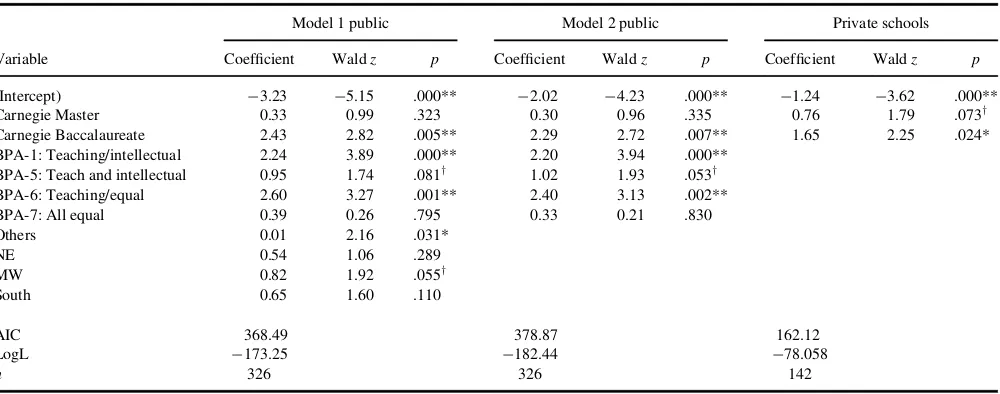
Due to the very substantial difference between the per-centages of public and private schools using the MFT-B, and because many other variables are heavily correlated with this type of school, we ran separate regressions for public and private schools. As before, we used logistic regression for the model estimates. We report the results in Table 4.
For public schools, most of the results are similar to the regression for all schools reported in Table 4. As before, Baccalaureate Carnegie Class classification public schools and schools with high emphasis on teaching contributions are much more likely to adopt the MFT-B. However, for public schools, it is more likely that a school would use the MFT-B if there were high percentages of other schools in the state using the MFT-B. Schools located in the Midwest are more likely to use the MFT-B than schools in the West. Holding all other variables constant, for every 1% increase in the number of other schools that use the MFT-B in a given state, the odds of the focal school using the MFT-B increases by a factor of 1.7 (exp(0.01)): there is a 7% increase in the probability of using the MFT-B for every 1% increase in other universities in the state using the MFT-B.
The full regression for private schools was not signifi-cant. Therefore, using backward elimination, we performed a limited regression. We report results in Table 4, indicat-ing that private baccalaureate and master’s Carnegie class classification schools are more likely to use MFT-B than research universities.
TABLE 3
Logistic Regression (All Undergraduate Schools)
Model 1 Model 2
Variable Coefficient Waldz p Coefficient Waldz p
(Intercept) ¡3.28 ¡5.59 .000** ¡2.49 ¡5.43 .000**
Public 0.67 2.57 .010* 0.72 2.96 .003**
Carnegie Master 0.29 1.05 .296 0.28 1.02 .307 Carnegie Baccalaureate 1.79 3.25 .001** 1.75 3.22 .001** BPA-1: Teaching/intellectual 2.04 4.16 .000** 2.02 4.21 .000** BPA-5: Teaching/intellectual 0.81 1.73 .084y 0.83 1.83 .068y
BPA-6: Teaching/equal 1.66 2.71 .007** 1.62 2.67 .008** BPA-7: All equal ¡0.09 ¡0.07 .944 ¡0.19 ¡0.15 .879
LogL ¡252.014 ¡259.004
n 458 458
y
p<.10. *p<.05. **p<.01.
378 A. BIELINSKA-KWAPISZ AND F. W. BROWN
Prediction
From the previous estimation, to find a probability,p, that a given AACSB institution would use the MFT-B, any school (public or private) can use the following model (from Table 3 results):
Ln.p=.1¡p//D ¡3:28C0:67PublicC0:29
CMasterC1:79CBacc
C2:04BPA1C0:81BPA5C1:66
BPA6¡0:09BPA7C0:01Others
C0:43NEC0:53MWC0:56S:.2/
For example, a probability that a public school with a research universities Carnegie Classification, BPA1 Gen-eral Orientation, in a Western state where all other AACSB-accredited universities in the state use the MFT-B would be 56%—the result obtained by solving for p in the following equation:
Ln.p=.1¡p//D ¡3:28C0:671C0:290
C1:790C2:041
C0:810C1:660¡0:090
C0:01100C0:430
C0:530C0:560D0:264: .3/
If this school had a Master’s Carnegie Classification instead, the probability would rise to 63%. If this school had Baccalaureate Carnegie Classification, the probability would be 89%. If those using this model desire not to include geographical information, they should apply coeffi-cients reported in Table 3, Model 2.
Estimation that is more precise can be derived from the specific model for private or public schools. Therefore, the following model can be used for public schools (Table 4, Model 1):
Ln.p=.1¡p//D ¡3:23C0:33CMasterC2:43
CBaccC2:24BPA1
C0:95BPA5C2:60BPA6
¡0:39BPA7C0:01Others
C0:54NEC0:82MWC0:65S:.4/
For the school described previously, this probability would be 59.5%, while the same school with a Master’s Carnegie Classification would be 67%, and Baccalaureate would be 94%.
Alternatively, the model without geographical location can be used (Table 4, Model 2):
Ln.p=.1¡p//D ¡2:02C0:30CMasterC2:29CBacc
C2:20BPA1C1:02BPA5
C2:40BPA6C0:33BPA7: .5/
Using this equation, the probability for the previous school is 54.6%, while the same school with Master’s Car-negie Classification would be 62%, and Baccalaureate 92%. For a private school, using the results reported in Table 4, the probability that a Research Carnegie Univer-sity uses the MFT-B would be 22%, Master’s 38%, and Baccalaureate 60%.
TABLE 4
Logistic Regression for Public and Private Schools
Model 1 public Model 2 public Private schools
Variable Coefficient Waldz p Coefficient Waldz p Coefficient Waldz p
(Intercept) ¡3.23 ¡5.15 .000** ¡2.02 ¡4.23 .000** ¡1.24 ¡3.62 .000** Carnegie Master 0.33 0.99 .323 0.30 0.96 .335 0.76 1.79 .073y Carnegie Baccalaureate 2.43 2.82 .005** 2.29 2.72 .007** 1.65 2.25 .024* BPA-1: Teaching/intellectual 2.24 3.89 .000** 2.20 3.94 .000**
BPA-5: Teach and intellectual 0.95 1.74 .081y 1.02 1.93 .053y
BPA-6: Teaching/equal 2.60 3.27 .001** 2.40 3.13 .002** BPA-7: All equal 0.39 0.26 .795 0.33 0.21 .830 Others 0.01 2.16 .031*
NE 0.54 1.06 .289
MW 0.82 1.92 .055y
South 0.65 1.60 .110
AIC 368.49 378.87 162.12
LogL ¡173.25 ¡182.44 ¡78.058
n 326 326 142
y
p<.10. *p<.05. **p<.01.
DISCUSSION
As a condition of gaining and sustaining external accredita-tion by the AACSB, business programs are currently required to provide a mission statement which specifies what goals the institution seeks to accomplish with their students and AOL assessments indicating the extent to which these goals were accomplished. As previously noted, 41% of AACSB-accredited undergraduate programs utilize the MFT-B as a part of their satisfaction of their AOL.
The ETS provides tables that can be used to compare a local institutional mean score to those of all other institu-tions also using the MFT-B. The meaningfulness and utility of this comparison may in fact be quite limited for two rea-sons (a) not all institutions with undergraduate business programs utilize the MFT-B and (b) there is no reason to believe that those schools that do utilize the MFT-B are rep-resentative of all undergraduate programs. Green et al. (2014) cited this lack of direct and meaningful comparabil-ity as a disadvantage associated with the use of the MFT-B. Our study provides an empirical measurement of the extent four-year undergraduate business programs accredited by the AACSB utilize the MFT-B, and a description of the characteristics of those programs.
Our analysis of the characteristics of the AACSB-accredited undergraduate institutions utilizing the MFT-B provides at least some illumination on the characteristics of the institutions that appear in the ETS comparative tables. First, we compared the characteristics of accredited pro-grams that use and do not use the MFT-B. Our results show that schools that are public, classified as Baccalaureate Car-negie Class Classification, and that put high emphasis on teaching contributions (BPA-1, BPA-5, and BPA-6) are much more likely to use the MFT-B than private universi-ties and research universiuniversi-ties with high emphasis on intel-lectual contributions (BPA-2).
Second, in response to Research Question 2 we provide a model that institutions could use to assist in determining how comparable the schools in the ETS comparison set are to their own institution, perhaps assisting in the decision of whether or not to utilize the MFT-B. The higher the proba-bility received from the model is, the more meaningful the comparison with other schools is. For example, for a public school with a research universities Carnegie Classification, BPA1 General Orientation, in a W state where all other AACSB-accredited universities in the state use the MFT-B, the probability that a similar school (same Carnegie Classi-fication and General Orientation) uses the MFT-B is 51%. Programs and institutions may also find it useful to compare their characteristics to other schools either using or not using the MFT-B.
Additional studies examining the extent of utilization and the characteristics of non–AACSB-accredited institu-tions utilizing the MFT-B could provide additional insights into comparability across programs. Presently the ETS
provides the opportunity for institutions utilizing the MFT-B to order a custom comparative data report that they can use to compare a local score to a reference group of 10 or more other selected institutions. Certainly, this provides institutions, if they have access to the necessary metrics, with at least a limited opportunity to create a more mean-ingful comparison than the use of the overall mean scores provided by ETS. ETS should be encouraged to provide the opportunity for MFT-B users to create more robust custom comparison sets through the inclusion of accreditation sta-tus and other publically available institutional characteris-tics such as those used in our study. To do so would make the MFT-B a more meaningful assessment of learning at the local level and eminently more attractive for use at the national level.
Allen, J. S., & Bycio, P. (1997). An evaluation of the Educational Testing Service Major Field Achievement Test in Business.Journal of
Account-ing Education,15, 503–514.
Association to Advance Collegiate Schools of Business (AACSB). (2013).
Global listing. Retrieved from http://www.aacsb.edu/accreditation/
accredited-members/global-listing.aspx
Bagamery, B. D., Lasik, J. J., & Nixon, D. R. (2005). Determinants of suc-cess on the ETS Business Major Field Exam for students in an under-graduate multisite regional university business program. Journal of
Education for Business,81, 55–63.
Barboza, G. A., & Pesek, J. (2012). Linking course-embedded assessment measures and performance on the Educational Testing Service Major Field Test in Business.Journal of Education for Business,87, 102–111. Bean, D. F., & Bernardi, R. A. (2002). Performance on the Major Field
Test in Business: The explanatory power of SAT scores and gender.
Journal of Private Enterprise,17, 172–178.
Benham, H. C., Bielinska-Kwapisz, A., & Brown, F. W. (2012). Software applications course as an early indicator of academic performance.
Research in Higher Education Journal,19, 1–16.
Bielinska-Kwapisz, A., & Brown, F. W. (2012). The impact of intellectual heterogeneity on academic performance in business education.Research
in Higher Education Journal,16, 1–15.
Bielinska-Kwapisz, A., & Brown, F. W. (2013). Differential gender perfor-mance on the Major Field Test–Business.Journal of Education for Busi-ness,88, 159–166.
Bielinska-Kwapisz, A., Brown, F. W., & Semenik, R. J. (2012a). Is higher better? Determinants and comparisons of performance on the Major Field Test–Business.Journal of Education for Business,87, 159–169. Bielinska-Kwapisz, A., Brown, F. W., & Semenik, R. J. (2012b).
Interpret-ing standardized assessment test scores and settInterpret-ing performance goals in the context of student characteristics: The case of the Major Field Test in Business.Journal of Education for Business,87, 7–13.
380 A. BIELINSKA-KWAPISZ AND F. W. BROWN
Black, H. T., & Duhon, D. L. (2003). Evaluating and improving student achievement in business programs: The effective use of standardized assessment tests.Journal of Education for Business,79, 90–98. Bush, H. F., Duncan, F. H., Sexton, E. A., & West, C. T. (2008).
Using the Major Field Test-Business as an assessment tool and impetus for program improvement: Fifteen years of experience at Virginia Military Institute.Journal of College Teaching and Learn-ing,5, 75–88.
Bycio, P., & Allen, J. S. (2007). Factors associated with performance on the Educational Testing Service (ETS) Major Field Achievement Test in Business (MFT-B). Journal of Education for Business, 82, 196–201.
Contreras, S., Badua, F., Chen, J. S., & Adrian, M. (2011). Documenting and explaining Major Field Test results among undergraduate students.
Journal of Education for Business,86, 64–70.
Educational Testing Service (ETS). (2013a).About ETS Major Field Test. Retrieved from http://www.ets.org/mft/about.
Educational Testing Service (ETS). (2013b).Comparative data reports.
Overview of the comparative data guide. Retrieved from http://www.ets.
org/mft/scores/compare_data.
Gerlich, R. N., & Sollosy, M. (2009). Evaluating the assessment outcomes in the principles of marketing course.Academy of Educational
Leader-ship Journal,13, 127–135.
Green, J. J., Stone, C. C., & Zegeye, A. (2014). The Major Field Test in Business: A solution to the problem of assurance of learning assess-ment?Journal of Education for Business,89, 20–26.
Martell, K. (2007). Assessing student learning: Are business schools mak-ing the grade?Journal of Education for Business,82, 189–195. Mason, P. M., Coleman, B. J., Steagall, J. W., Gallo, A. A., & Fabritius, M.
M. (2011). The use of the ETS Major Field Test for assurance of
business content learning: Assurance of waste?Journal of Education for
Business,86, 71–77.
McLaughlin, P., & White, J. T. (2007). Major Field Achievement Test in Business—Guidelines for improved outcome scores—Part I. College
Teaching Methods and Styles Journal,3(2), 11–20.
Mirchandani, D., Lynch, R., & Hamilton, D. (2001). Using the ETS Major Field Test in Business: Implications for assessment.Journal of
Educa-tion for Business,77, 51–55.
Pringle, C., & Michel, M. (2006). Assessment practices in AACSB-accred-ited business schools.Journal of Education for Business,82, 202–211. Rook, S. P., & Tanyel, F. I. (2009). Value-added assessment using the
Major Field Test in Business.Academy of Educational Leadership Jour-nal,13, 87–94.
Settlage, D. M., & Settlage, L. A. (2011). A statistical framework for assessment using the ETS Major Field Test in Business.Journal of
Edu-cation for Business,86, 274–278.
Smith, L. J., Clements, C., & Olson, J. E. (2010). Local versus standardized content assessment: Some management implications, or why bother?
Journal of Education for Business,85, 249–257.
Terry, N., Mills, L., Rosa, D., & Sollosy, M. (2009). Do online students make the grade on the Business Major Field ETS exam?Academy of
Educational Leadership Journal,13, 109–118.
Wilson, P. H. (2008). A protocol for analyzing the Major Field Test results.
Journal of Business and Behavioral Sciences,19, 33–45.
Word, W. R., & Rook, S. P. (2012). Analyzing Major Field Test in Busi-ness assessment results.Journal of Business Administration Online,12, 1–11.
Zeis, C., Waronska, A., & Fuller, R. (2009). Value-added program assess-ment using nationally standardized tests: Insights into internal validity issues.Journal of Academy of Business and Economics,9, 114–128.