A Note on ‘‘The Longitudinal
Charles (2003) examines the dynamic effects of disability, finding a small decline in earnings and hours following disability onset, even for those who have positive disability reports for each of the next ten years. These outcomes also rebound quickly after the onset of disability. In recent work, Meyer and Mok (2006), find a much larger loss in earnings and a greater decline in hours. Here we find large and persistent declines in earnings and hours, generally several times those reported in Charles (2003). The current findings were arrived at by two research teams working independently without sharing any computer code.
An earlier article (Charles 2003) examines the dynamic effects of disability on earn-ings. That article, unlike most of the previous literature, uses panel data and fixed effects methods to determine how the earnings of disabled workers differ from their expected levels over several years before and after the onset of their disabilities. The paper also examines how earnings losses from disability differ by worker character-istics, focusing on the differences by age of onset. Disabled men are found to expe-rience a small decline in earnings and hours following disability onset, even for those who have positive disability reports for each of the next ten years. These outcomes also rebound quickly after the onset of disability. The earnings losses are greater for those who are older at the onset of their disability. Subsequent work by Stephens
Wallace K. C. Mok is a graduate student in Economics at Northwestern University. Bruce D. Meyer is McCormick Tribune Professor, Harris School of Public Policy Studies, University of Chicago. Kerwin Kofi Charles is the Steans Family Professor in the Harris School of Public Policy Studies, University of Chicago, and a Coeditor of the Journal of Human Resources. Alexandra C. Achen is a graduate student in public policy and sociology at the University of Michigan. The data used in this article can be obtained beginning January 2009 through December 2012 from Bruce D. Meyer, 1155 E. 60thStreet,
Chicago, IL 60637 bdmeyer@uchicago.edu. ½Submitted January 2007; accepted June 2007
ISSN 022-166X E-ISSN 1548-8004Ó2008 by the Board of Regents of the University of Wisconsin System
(2001), Charles and Stephens (2006), and Meyer and Mok (2006) builds on this ear-lier work and uses similar data and methods.
In recent work, Meyer and Mok (2006) examine some of the same or similar out-comes as Charles (2003). This recent research finds a much larger loss in earnings and a greater decline in hours following disability. Since the qualitative features of this new research are sufficiently different from those reported in Charles (2003), they suggest a further examination of the original results. In this paper, we attempt to replicate some of the results in Charles (2003) and we report estimates from some closely related specifications. Here we find large and persistent declines in earnings and hours, generally several times those reported in Charles (2003). We believe the current findings because identical version of the full sample results below (Figures 2 and 4) were arrived at by two research teams (the first two authors as one team, the second two authors as the other) working independently without sharing any com-puter code.
Specifically, we attempt to reproduce the results from Charles (2003) for changes in log real earnings and annual hours worked. The sample is male household heads in the 1968–93 waves of the Panel Survey of Income Dynamics, though we also report estimates including data through 2003. The selection of the disabled sample is the same as that in Charles (2003) and Meyer and Mok (2006). Disability is determined by the response to the question ‘‘Do you have any physical or nervous condition that limits the type or amount of work you can do?’’ The grouping of the disabled here follows that in Charles (2003), rather than that in Meyer and Mok (2006). Charles (2003) divides the disabled into three groups based on their post onset disability his-tory. The three groups are those who report a limitation in all years following onset (that the individual is in the survey), those who never report a limitation again after onset, and those who do not belong to the two previous categories (all other disability histories). In addition, those who are disabled before 1967 are put in the residual group since we do not observe their histories until the first wave of the survey.
The initial model estimated is:
Whereyitis either log real earnings or annual hours for personiin yeart,Xitis a set of time-varying explanatory variables including marital status, state of residence, age and age-squared, and education,aiis an individual fixed effect,gtis an indicator var-iable for yeart.Ahkitis an indicator variable which equals one if in yeart, individuali belongs to disability grouphand he iskyears from the year in which he becomes disabled, and eitis a potentially serially correlated error term. As explained above, there are three disabled groups soh2 f1, 2, 3g. As in Charles (2003), we look at changes 10 years before and 10 years after the year of disability onset, thus k 2 f-10, -9,., 9, 10g. The coefficients on theA
h
With the change in log real earnings as the dependent variable, we delete, as in Charles (2003), those observations when an individual has zero earnings in the per-son-year format of the data. Although Charles (2003) also includes a selectivity cor-rection, we do not include it in our replication as Charles (2003) points out that the results of the various models are nearly identical to what is obtained when the Heck-man correction is not used.
Estimation of this model follows Jacobson, LaLonde, and Sullivan (1993):
(1) For each personi, we regress each variable (dependent variables, time dum-mies and the variables inX, and the time from onset dummies) on a constant and a variable which equals (year of the observation in the person/year format—1967), for all the data in the person/year format pertinent to this personi.
(2) Obtain the residuals from the above regression, giving us for each person, his detrended log earnings, hours, age, age-squared, and so on.
(3) We then regress the detrended dependent variables on the detrended explana-tory variables using OLS. For example, for the log earnings regression, we regress the log earnings residuals on the time dummy residuals, age residuals, age-squared residuals, marital status residuals, time from onset dummy residuals, and so on. We do not have a constant in the regression. Thus this ‘‘partialing out’’ removes thewitterm and the fixed effect term.
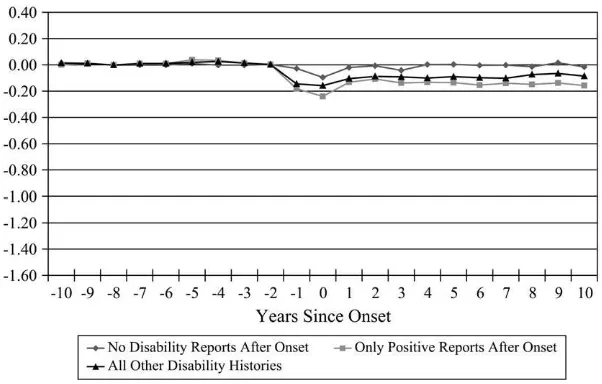
Figure 1 is a reproduction of Figure 1 for the change in log(annual earnings) for disabled men taken directly from Charles (2003). The numbers behind this figure are reported in Columns 1–3 of Table 1. The estimates indicate how earnings differ from
Figure 1
Change in Log(Annual Earnings) for Disabled Men, A Reproduction of Figure 1 in Charles (2003)
Table 1
Change in Log (Earnings) Before and After Disability, by Frequency of Positive Disability Reports After Onset
Years Since Onset
Charles (2003) With Individual Time Trends With Fixed Effects Sample Extended to 2003
None
-10 0.014 0.001 0.014 0.010 0.020 0.031 -0.008 -0.025 -0.002 -0.033 -0.029 -0.029
-9 0.010 0.012 0.011 0.035 -0.114 0.038 0.015 -0.146 -0.019 -0.042 -0.151 -0.017
-8 -0.001 -0.001 -0.001 -0.019 -0.022 0.050 -0.028 -0.065 -0.021 -0.075 -0.110 -0.022
-7 -0.001 0.010 0.010 -0.008 -0.022 0.048 -0.025 -0.091 -0.048 -0.044 -0.131 -0.044
-6 -0.001 0.010 0.010 0.037 -0.011 0.124 0.011 -0.141 0.005 -0.020 -0.173 -0.035
-5 0.010 0.038 0.019 0.107 0.046 0.169 0.070 -0.136 0.015 0.002 -0.165 -0.025
-4 -0.002 0.034 0.025 0.081 0.147 0.181 0.025 -0.073 -0.010 -0.018 -0.147 -0.036
-3 -0.002 0.013 0.014 0.079 0.039 0.208 -0.009 -0.181 -0.027 -0.076 -0.273 -0.040
-2 0.003 0.004 0.003 0.068 0.089 0.237 -0.030 -0.201 -0.021 -0.070 -0.281 -0.050
-1 -0.028 -0.182 -0.145 -0.022 -0.089 0.175 -0.129 -0.412 -0.120 -0.145 -0.493 -0.161
0 -0.095 -0.240 -0.158 -0.097 -0.260 0.128 -0.200 -0.600 -0.220 -0.222 -0.668 -0.234
1 -0.020 -0.132 -0.104 -0.009 -0.148 0.146 -0.112 -0.433 -0.238 -0.164 -0.556 -0.245
2 -0.007 -0.108 -0.088 0.009 -0.342 0.174 -0.083 -0.683 -0.236 -0.124 -0.709 -0.247
3 -0.042 -0.138 -0.092 -0.010 -0.360 0.185 -0.088 -0.696 -0.252 -0.131 -0.890 -0.256
4 0.003 -0.132 -0.100 -0.063 -0.619 0.219 -0.150 -0.987 -0.259 -0.131 -0.921 -0.261
5 0.004 -0.136 -0.090 0.018 -0.161 0.259 -0.072 -0.627 -0.259 -0.091 -0.781 -0.261
6 -0.004 -0.154 -0.098 0.081 -0.629 0.249 -0.045 -1.161 -0.267 -0.137 -1.050 -0.248
7 -0.002 -0.140 -0.102 0.105 -0.860 0.257 -0.032 -1.567 -0.310 -0.051 -1.289 -0.270
8 -0.014 -0.149 -0.074 0.099 -0.142 0.314 -0.037 -0.917 -0.249 -0.064 -0.961 -0.271
9 0.016 -0.138 -0.066 0.132 0.178 0.263 -0.055 -0.795 -0.330 -0.135 -0.954 -0.302
10 -0.015 -0.157 -0.085 0.051 0.128 0.245 -0.141 -0.887 -0.366 -0.130 -0.934 -0.309
Note: The numbers in the table show the estimated changes in log(Earnings) in the 10 years before and after disability. Source: Charles (2003) and authorsÕcalculations.
The
Journal
of
Human
those more than ten years prior to disability onset. Columns 4–6 of Table 1 report our attempted replication of these same numbers. These columns indicate a much larger fall in earnings in the years immediately after onset than indicated in Figure 1 for the most disabled group. There also is a surprising rise in post-disability earnings in the years 8–10 years after onset for this group. This pattern in the later years is likely due to the restriction of this most disabled group to only those that never have a positive post-onset limitation report (and have positive earnings). This restriction leads to a small sample size for this group; there are never more than 14 observations in any of the last three years. There also is an anomalous rise in earnings for the ‘‘all other disability histories’’ group. The estimation of the person specific time trends using very limited information seems to add to the sensitivity of these estimates. For this reason, we focus on the estimates with individual fixed effects, but without individual specific time trends below.
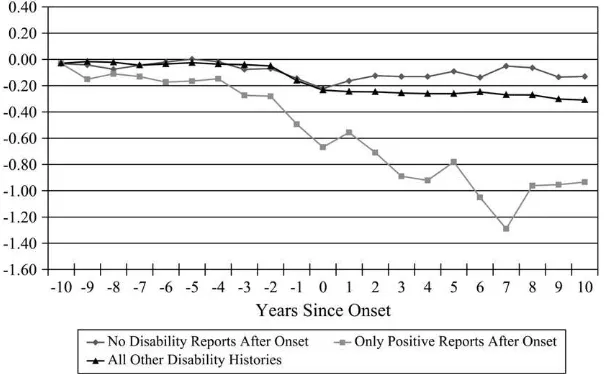
Table 1, Columns 7–9 report estimates from the same sample and specification as those in Columns 4–6, except individual specific fixed effects are included rather than individual specific time trends. These estimates indicate post onset losses that do not disappear for all three disability groups. For the most severely disabled group the loss in earnings are particularly severe, about a full log point. This is a sharply different pattern from that shown in Figure 1 where earnings losses are at most a bit over 0.2 log points and diminish after onset. The final set of estimates in the last three columns of Table 1 updated the sample to include data through 2003. The resulting pattern is also shown in Figure 2 to facilitate comparison with the original results. Our new results in Figure 2 show large earnings losses, while Figure 1 shows a very different pattern of small, hard to detect losses.
Figure 2
Change in Log(Annual Earnings) for Disabled Men, Specification with Individual Fixed Effects, Data through 2003
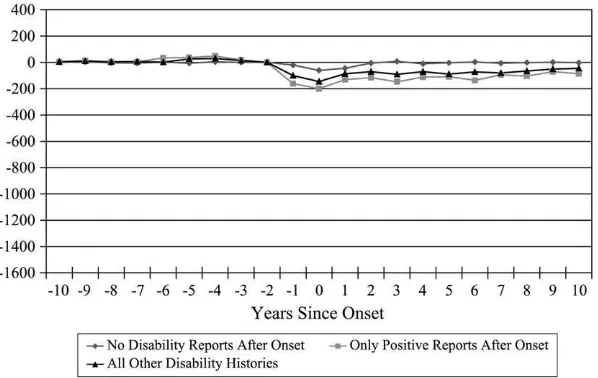
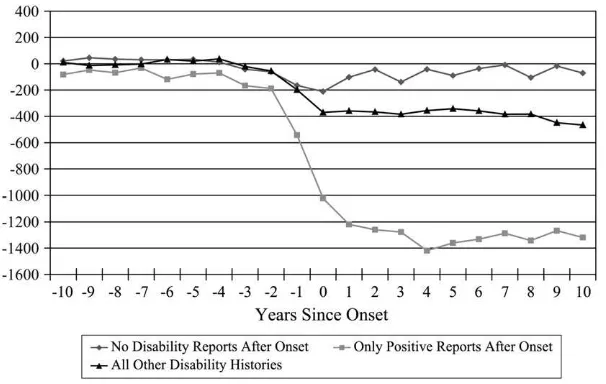
The second outcome that we examine is the change in hours worked surrounding disability onset. Figure 3 below is a reproduction of the original Figure 2 in Charles (2003). The numbers behind this figure are reported in Columns 1–3 of Table 2. Col-umns 4–6 report our attempted replication of these numbers. The pattern is very dif-ferent, with the most disabled group seeing an hours decline six times as large at its greatest point as that seen in the published estimates. A slight recovery occurs in hours by ten years after onset, but the drop in hours is still about eight times as large in our new figure. The third set of estimates in Columns 7–9 of Table 2 provides the hours pattern for the same sample and specification, but again we replace the indi-vidual specific time trends with indiindi-vidual specific fixed effects. The pattern is quite similar except there is less of a recovery of hours five to ten years after disability onset. The last three columns of Table 2 as well as Figure 4 report the same speci-fication using a sample extended through 2003. The augmented data suggest a some-what larger decline in hours than those in the shortened sample. The main pattern to these results is that the new estimates show a dramatically larger fall in hours for the disabled.
Overall, these new analyses indicate much larger losses from disability than those in the published Charles (2003) paper. This pattern is evident for both earnings and hours, and is especially pronounced for those with the most long-lasting disabilities. The economic losses associated with disability appear to be much greater than previously reported. We were unable to determine what specifically led to the earlier estimates being so far from what we now believe to be correct.
Figure 3
Table 2
Change in Annual Hours of Work Before and After Disability, by Frequency of Positive Disability Reports After Onset
Years Since Onset
Charles (2003) With Individual Time Trends With Fixed Effects Sample Extended to 2003
None
Note: The numbers in the table show the estimated changes in hours of work in the 10 years before and after disability. Source: Charles (2003) and authorsÕcalculations.
References
Charles, Kerwin K. 2003. ‘‘The Longitudinal Structure of Earnings Losses among Work-Limited Disabled Workers.’’Journal of Human Resources38(3):618–46.
Charles, Kerwin Kofi, and Melvin Stephens, Jr. 2004. ‘‘Job Displacement, Disability, and Divorce.’’Journal of Labor Economics.22(2):489–522.
Jacobson, Louis S., Robert J. LaLonde, and Daniel G. Sullivan. 1993. ‘‘Earnings Losses of Displaced Workers.’’American Economic Review83(4):685–709.
Meyer, Bruce D., and Wallace K. C. Mok. 2006. ‘‘Disability, Earnings, Income and Consumption’’ Working Paper, Harris School, University of Chicago.
Stephens, Melvin Jr. 2001. ‘‘The Long-Run Consumption Effects of Earnings Shocks.’’The Review of Economics and Statistics83(1):28–36.
Figure 4