April-June 2014 Page 1
Executive
Summary
COA - Vol. 13
GENERAL DIRECTORATE FOR STATE FINANCE NATIONAL DIRECTORATE OF ECONOMIC POLICY DILI - 2016
Quarterly Fiscal Bulletin
January - March 2016
Chart of Accounts (COA)
Executive Summary
Fiscal Bulletin COA Jan-Mar 2016 Page 1
1.
Overall Fiscal Position (Oil and Non-oil)
Table 1. Overall Fiscal Position1
*Use of Cash Balance refers to the Government Accounts only.
Total expenditures for the GGoTL and the PF reached $261.0 million at the end of the first quarter of 2016. $254.8 million was spent on recurrent expenditures, whilst $6.2 million was spent on capital expenditures.2
At the first quarter of 2016, total revenues amounted to $247.7million.From petroleum revenues, $210.1 million were recorded and $37.6 million were obtained from non-oil revenues. PF revenues include PF gross receipts (taxes, royalties and first tranche petroleum) and investment income (dividends, interests and trust income, but exclude fair value gains and losses on profit/loss).3
The total deficit stood at $13.4 million by 31st March 2016,which is calculated as total revenue minus total expenditure. This compares to a surplus of $169.3 million during the same period in 2015. This deficit is a result of declining oil revenues.
All data in this document refers to unaudited accounts and is thus subject to change.
2
This includes expenditure from loans under capital and development.
3
FISCAL BULLETIN TIMOR-LESTE
CHART OF ACCOUNTS
Fiscal Bulletin COA Jan-Mar 2016 Page 2
2.
Ge eral Gover
e t’s
Fiscal Position
Table 2. Non-Oil Fiscal Position
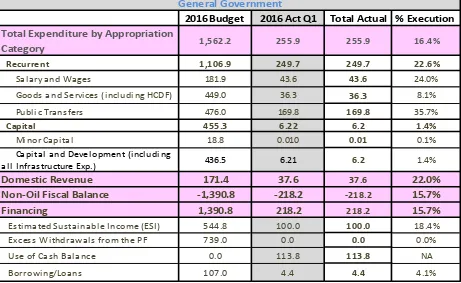
As seen in Table 2, by the 31st March 2016 the GGoTL, excluding the PF, had a non-oil deficit of $218.2 million. $100.0 million of this deficit was financed through the ESI, $4.4 million was financed through loans, and $113.8 million was used from the Cash Balance.
2.1
General Government Expenditures
At the first quarter of 2016, expenditures amounted to $255.9 million, which represented 16.4% of total budgeted expenditures for the year.
2.1.1. Expenditure by Appropriation Category
Total expenditures are divided into recurrent and capital expenditures. Recurrent expenditures totalled $249.7 million at the first quarter of 2016, which was an execution rate of 22.6%. In comparison, capital expenditures reached $6.2million by the 31th March 2016, which meant an execution rate of 1.4%.
2016 Budget 2016 Act Q1 Total Actual % Execution
Total Expenditure by Appropriation
Category 1,562.2 255.9 255.9 16.4%
Recurrent 1,106.9 249.7 249.7 22.6%
Sa l a ry a nd Wa ges 181.9 43.6 43.6 24.0%
Estimated Sustainable Income (ESI) 544.8 100.0 100.0 18.4%
Excess Withdrawals from the PF 739.0 0.0 0.0 0.0%
Use of Cash Balance 0.0 113.8 113.8 NA
Borrowing/Loans 107.0 4.4 4.4 4.1%
Fiscal Bulletin COA Jan-Mar 2016 Page 3 Recurrent expenditures are divided into:
Salary and Wages totalled $43.6 million at the first quarter of 2016, reaching an execution rate of 24.0%.This is 4.1% higher than the $41.9 million incurred in the same period of 2015.
Goods and Services reached $36.3 million by the 31st March 2016 with an execution rate of 8.1%. Expenditures to date in 2016 representeda decrease of 19.3% compared to the $45.0 million spent in the same period of 2015. Expenditures on human capital through the HCDF reached $3.8 million, 2.9% more than those recorded in 2015.
Public Transfers totalled $169.8 million by the first quarter of 2016 and was therefore the largest category of recurrent expenditures. This expenditure was 38.0%higher than the $123.0 million recorded by the 31st March 2015. Thisincrease was mostly due to a rise in public grants, which reached $147.8 million by the first quarter of 2016.
Capital expenditures are composed of:
Minor Capitaltotalled $0.01 million by the first quarter of 2016,which represented an execution rate of 0.1%. Total minor capitalexpenditure by the end of first quarter of 2016 were 98.8% lower than those recorded by the same date of 2015.
FISCAL BULLETIN TIMOR-LESTE
CHART OF ACCOUNTS
Fiscal Bulletin COA Jan-Mar 2016 Page 4
2.2 Non-oil Revenues
Table 3. Non-oil Revenues
The Government has increased non-oil revenue in recent years and is planning further reforms to increase non-oil revenue collections going forward. Total domestic non-oil revenues were $37.6 million bythe first quarter of 2016, which represented 22.0%of the total revenue budgeted for the year. This was divided into:
Tax Revenue, which was the largest category and can be divided into:
Taxes on commodities was the largest tax category, reaching$16.9 million at the first quarter of 2016 (35% higher than the $12.5 million collected in the same period in 2015). Within taxes on commodities, excise tax increased the most by 49%.
Taxes on incometotalled $9.9 million at the first quarter of 2016,2.0% lower than the $10.1 million collected in the 2015.
Service tax totalled $0.8 million by the end of the first quarter of 2016, an increase of 9.4%over the $0.7 million collected by the first quarter 2015.
Non-tax revenue totalled $9.9million by the first quarter of 2016,21.3% of the total forecasted for the year.
Revenue Retention Agencies recorded no revenues in the first quarter of 2016. This is due to an administrative change in the way revenues are transferred to the individual agencies. It is expected that revenue from revenue retention agencies will be reported in the next quarterly bulletin.
2016 Budget 2016 Act Q1 Total Actual % Execution
Total Domestic Non-oil Revenues
171.4
37.6
37.6
22.0%
Tax Revenue
116.4
27.7
27.7
23.8%
Taxes on commodities
61.1
16.9
16.9
27.6%
Taxes on income
52.3
9.9
9.9
19.0%
Service tax
2.8
0.8
0.8
27.0%
Other tax revenues
0.2
0.17
0.2
84.0%
Non tax Revenue (non-oil)
46.4
9.9
9.9
21.3%
Revenue Retention Agencies
8.6
0.0
0.0
0.0%
Fiscal Bulletin COA Jan-Mar 2016 Page 5