This ar t icle was dow nloaded by: [ Univer sit as Dian Nuswant or o] , [ Rir ih Dian Prat iw i SE Msi] On: 29 Sept em ber 2013, At : 20: 19
Publisher : Rout ledge
I nfor m a Lt d Regist er ed in England and Wales Regist er ed Num ber : 1072954 Regist er ed office: Mor t im er House, 37- 41 Mor t im er St r eet , London W1T 3JH, UK
Accounting and Business Research
Publ icat ion det ail s, incl uding inst ruct ions f or aut hors and subscript ion inf ormat ion: ht t p: / / www. t andf onl ine. com/ l oi/ rabr20
The effects of voluntary disclosure and dividend
propensity on prices leading earnings
Khal ed Hussainey a & Mart in Wal ker b a
Division of Account ing and Finance, St irl ing Management School , Universit y of St irl ing, St irl ing, FK9 4LA, UK E-mail :
b
Manchest er Universit y Publ ished onl ine: 04 Jan 2011.
To cite this article: Khal ed Hussainey & Mart in Wal ker (2009) The ef f ect s of vol unt ary discl osure and dividend propensit y on prices l eading earnings, Account ing and Business Research, 39: 1, 37-55, DOI: 10. 1080/ 00014788. 2009. 9663348
To link to this article: ht t p: / / dx. doi. org/ 10. 1080/ 00014788. 2009. 9663348
PLEASE SCROLL DOWN FOR ARTI CLE
Taylor & Francis m akes ever y effor t t o ensur e t he accuracy of all t he infor m at ion ( t he “ Cont ent ” ) cont ained in t he publicat ions on our plat for m . How ever, Taylor & Francis, our agent s, and our licensor s m ake no
r epr esent at ions or war rant ies w hat soever as t o t he accuracy, com plet eness, or suit abilit y for any pur pose of t he Cont ent . Any opinions and view s expr essed in t his publicat ion ar e t he opinions and view s of t he aut hor s, and ar e not t he view s of or endor sed by Taylor & Francis. The accuracy of t he Cont ent should not be r elied upon and should be independent ly ver ified w it h pr im ar y sour ces of infor m at ion. Taylor and Francis shall not be liable for any losses, act ions, claim s, pr oceedings, dem ands, cost s, expenses, dam ages, and ot her liabilit ies w hat soever or how soever caused ar ising dir ect ly or indir ect ly in connect ion w it h, in r elat ion t o or ar ising out of t he use of t he Cont ent .
This ar t icle m ay be used for r esear ch, t eaching, and pr ivat e st udy pur poses. Any subst ant ial or syst em at ic r epr oduct ion, r edist r ibut ion, r eselling, loan, sub- licensing, syst em at ic supply, or dist r ibut ion in any
1. Introduction
Considerable attention has been given to examin-ing the association between corporate disclosure and share price anticipation of earnings (e.g. Schleicher and Walker, 1999; Lundholm and Myers, 2002; Gelb and Zarowin, 2002; Hussainey et al., 2003 and Schleicher et al., 2007). These pa-pers find that the stock market’s ability to antici-pate future earnings changes is significantly improved when firms voluntarily provide higher levels of disclosure. However, these studies do not take into account the possibility that dividend pol-icy may provide an alternative device for convey-ing value-relevant information to the stock market that might act as a substitute or complement for narrative disclosure in the financial communica-tion process.
Hanlon et al. (2007) examine the impact of div-idend propensity (i.e. whether a firm pays cash dividends) on the stock market’s ability to antici-pate future earnings. They modify and use the
re-turns-earnings regression model introduced by Collins et al. (1994) to compare the association be-tween current-year stock returns and future earn-ings for firms that pay dividends in the current year as compared with non-dividend-paying firms. They find that US dividend-paying firms exhibit significantly higher levels of share price anticipa-tion of earnings than non-dividend-paying firms. In addition, Hanlon et al. (2007) control for dis-closure quality, as measured by AIMR-FAF scores, and they find that the significance of the dividend policy for anticipating future earnings is reduced. This suggests that dividends and disclosure might be substitute forms of financial communication. However, it is possible that the relative informa-tion content of dividends and voluntary disclosure could be different in the US than in the UK as the proportion of UK dividend-paying firms is greater than US dividend-paying firms in the period of 1996–2002 (73% in the UK compared with 23% in the US; see Denis and Osobov, 2008 for more de-tails).1
The present paper examines the joint effects of
The effects of voluntary disclosure and
dividend propensity on prices leading
earnings
Khaled Hussainey and Martin Walker*
Abstract—We investigate the joint effects of dividend propensity (i.e. whether a firm pays cash dividends) and vol-untary disclosure on the relationship between current stock returns and future earnings. We examine whether divi-dend propensity and voluntary disclosure act as substitutes or complements in the financial communication process. We also examine whether the effects of dividend propensity and voluntary disclosure vary between high- and low-growth firms.
Consistent with prior studies, we find that share price anticipation of earnings improves with increasing levels of annual report narrative disclosure, and that firms that pay dividends exhibit higher levels of share price anticipation of earnings than non-dividend-paying firms.
The paper adds to the literature on share price anticipation of earnings in two crucial respects. First we show that the associations of voluntary disclosure and dividend propensity with share price anticipation of earnings are sta-tistically significant for high-growth firms and insignificant for low-growth firms. Second we show that the signif-icant effects we find for dividend propensity and voluntary disclosure in high-growth firms are not perfectly additive.
Keywords: annual report narratives; dividend propensity; firm growth characteristics; returns-earnings relation-ship; content analysis
* Khaled Hussainey is based at Stirling University; Martin Walker is based at Manchester University. They have received helpful comments from David Stopforth, Thomas Schleicher, participants at the 2006 EAA and the 2006 BAA conferences and seminar participants at Glasgow and Hull Universities. They are grateful to the editor and two anonymous referees for helpful comments and appreciate financial support from the ESRC (Grant Number RES–000–23–0962). Correspondence should be addressed to Dr. Khaled Hussainey, Division of Accounting and Finance, Stirling Management School, University of Stirling, Stirling FK9 4LA, UK. E-mail: [email protected].
This paper was accepted for publication in September 2008.
1One possible reason for this is the difference between the
treatments of dividend income in the two countries (Morgan and Thomas, 1998). In particular, the UK imputation system up to 5 April 1997 significantly favoured dividend payments compared to the US for both individuals and pension funds and thereafter still favoured dividend payments to individuals. The abolition of advance corporation tax in April 1999 did not offer this (Bank et al., 2006). Oswald and Young (2008: 51–52) provide detailed information on dividends and relevant UK tax legislation.
dividend propensity and voluntary disclosure on share price anticipation of earnings.
In undertaking this task, we argue that it is vital to take into account the growth characteristics of firms. There are strong theoretical and empirical grounds for expecting this to be the case. Several researchers (see, for example, Brown et al., 1999; Francis and Schipper, 1999 and Lev, 1989) have identified a number of problems with the financial reporting process, instances of accounting ‘fail-ure’. Particular attention has been paid to the in-ability of the financial reporting system to capture the value-relevance of intangible investments on a timely basis (see, for example, Amir and Lev, 1996; Lev, 2001 and Lev and Sougiannis, 1996). High growth and intangible asset intensity are fac-tors that tend to reduce the predictive value of cur-rent earnings for future earnings. Investors of high-growth firms are aware that current earnings provide a poor guide to the future financial per-formance of the firm. Thus, when valuing these firms, investors tend to seek other, more timely, predictors of future earnings beyond current earn-ings.
In this paper we use the future earnings response model of Collins et al. (1994) to measure the de-gree of share price anticipation of earnings. We test whether the level of share price anticipation of earnings varies with dividend propensity and with the level of voluntary disclosure. We also test whether the associations between dividend propensity or voluntary disclosure and share price anticipation of earnings differ between high- and low-growth firms.
Our results show that both narrative disclosure level and dividend propensity are associated with significantly improved share price anticipation of earnings for high-growth firms. Moreover, for high-growth firms, narrative disclosure and divi-dend propensity appear, to some extent, to be sub-stitute forms of financial communication. In contrast we find that neither narrative disclosure level nor dividend propensity exhibit significant association with share price anticipation of earn-ings for low-growth firms.
Thus the paper makes an important and novel contribution to the literature on corporate financial communication. So far as we are aware, it is the only paper to examine the joint role of narrative disclosure and dividend propensity on prices lead-ing earnlead-ings. Moreover, it is the first paper to show that the predictive value of dividend propensity and narrative disclosure is sensitive to the growth characteristics of the firm.
The paper proceeds as follows. Section 2 re-views the prior literature and develops our hy-potheses. In Section 3, we describe the generation of our disclosures scores. Our measure of share price anticipation of earnings is discussed in
Section 4. Section 5 describes the data and we present our main regression results in Section 6. Section 7 presents our specification check and Section 8 concludes and suggests areas for future research.
2. Prior research and hypotheses
development
2.1. Disclosure and prices leading earnings
There is a growing body of literature which ex-amines how corporate disclosures affect the stock market’s ability to anticipate future earnings changes. Hussainey et al. (2003) examine the in-formation content of annual report narrative sec-tions for anticipating future earnings for UK firms. Their work builds on the earlier work of Schleicher and Walker (1999) but, by adopting the augmented returns-earnings regression model of Collins et al. (1994), uses a research design closer to those used in Gelb and Zarowin (2002) and Lundholm and Myers (2002).
Hussainey et al. (2003) and Schleicher and Walker (1999) find that improved levels of annual report disclosures tend to lead to higher levels of share price anticipation of earnings. In particular, Hussainey et al. (2003) find that forward-looking earnings statements in the annual report narratives increase the market’s ability to anticipate future earnings change. However, they do not find signif-icant results when using a disclosure metric based on all types of forward-looking statements. Gelb and Zarowin (2002) and Lundholm and Myers (2002) find that the quality of corporate disclosure, as measured by AIMR-FAF analysts’ rankings of disclosure, is positively associated with the mar-ket’s ability to anticipate future earnings changes. Schleicher et al. (2007) find that the association between levels of annual report disclosures and share price anticipation of earnings is not the same for profitable and unprofitable firms. They find that the ability of stock returns to anticipate next period’s earnings change is significantly greater for unprofitable firms that provide higher levels of earnings predictions in their annual report narra-tives. They did not find such results for profitable firms.
None of the above papers makes any distinction between high-growth firms and low-growth firms. However all of these studies make use of the rela-tionship between current and future earnings and stock returns to assess the information content of corporate disclosures. Moreover, it is well known that differences in growth rates cause the associa-tion between stock returns and contemporaneous earnings changes to vary between firms (Collins and Kothari, 1989 and Rayburn, 1986). High-growth firms tend to have higher levels of intangi-ble assets (Thornhill and Gellatly, 2005). Such
intangible assets tend to reduce the value-rele-vance of current earnings for overall firm value. If the benefits from these assets are uncertain, in-vestors will find it more difficult to appraise firm value (Kothari et al., 2002). Additionally, Lee et al. (2005) argue that increasing uncertainty about fu-ture benefits will lead to more information asym-metry between investors and managers and may introduce noise in the estimation of firm value in high-tech in comparison with low-tech firms.2 Firms can reduce such information asymmetry by providing additional voluntary information (Ertimur, 2004). In this paper, we ask whether in-creasing the level of annual report forward-look-ing disclosures improves the stock market’s ability to anticipate future earnings changes, especially for high-growth firms.
While no papers have examined the effect of firm-specific growth characteristics on the associ-ation between disclosure and the stock market’s ability to anticipate future earnings changes, possi-bly the most closely related paper to ours is Kwon (2002). Kwon (2002) compares analysts’ forecast accuracy and dispersion between high-tech and low-tech firms. He finds that high-tech firms have lower error and dispersion of analyst earnings forecasts than low-tech firms. In addition, he finds that high-tech firms have higher analyst forecast accuracy than low-tech firms. He attributes this finding to differences in the level of voluntary dis-closure provided by these firms. In particular, he states that high-tech firms increase their levels of voluntary disclosure to attract more analysts. Increasing disclosure leads to higher levels of ana-lyst forecast accuracy and lower levels of forecast dispersion. The finding of Kwon’s paper is impor-tant in relation to ours as it indicates that firm char-acteristics such as growth prospects can condition the forecasting practices of stock market partici-pants.
Considerable attention has been paid to the in-ability of financial performance measures to cap-ture the value relevance of intangible investments on a timely basis (see Abdolmohammadi et al., 2006; Lee et al, 2005; Lev, 2001; Lev and Zarowin, 1999). As a consequence, the predictive value of current earnings for future earnings is lower for intangibles-rich high-growth firms than for low-growth firms.
Given the limited usefulness of their current earnings for predicting future earnings, one possi-ble response for firms with significant unrecog-nised intangible assets or high-growth prospects is to make voluntary disclosure in order to convey
value-relevant information in a more timely way (Gelb, 2002; Hyytinen and Pajarinen, 2005 and Khurana et al., 2006). Moreover, since current earnings provide a better basis for predicting fu-ture earnings for low-growth firms, we expect the influence of disclosure on the relationship between current returns and future earnings to be stronger for high-growth firms than low-growth firms.
The following hypotheses focus on how volun-tary disclosure affects the stock market’s ability to anticipate future earnings:
H1 The degree of share price anticipation of earnings is positively related to the level of voluntary disclosure.
H2 The degree of share price anticipation of earnings is positively related to the level of voluntary disclosure for high-growth firms.
H3 The degree of share price anticipation of earnings is positively related to the level of voluntary disclosure for low-growth firms.
We also compare the effect of voluntary disclo-sure between high- and low-growth firms. Thus, the fourth hypothesis states:
H4 The strength of the degree of association be-tween share price anticipation of earnings and voluntary disclosure is greater for high-growth firms than for low-high-growth firms.
2.2. Dividends and prices leading earnings
Apart from the audited financial statements, vol-untary disclosure is one of two main ways that firms can communicate information about future earnings to the stock market. The other way is through some types of financial policy choices.
There is a vast literature that explores the possi-bility that financial policy choices may serve to convey information to the market. One such line of argument focuses on financial signalling as a solu-tion to the adverse selecsolu-tion problem. In this paper we focus on one particular form of financial sig-nalling, cash dividends. There is a substantial amount of literature on dividend signalling in its various forms. This literature has produced a com-plex set of models that can be used to rationalise alternative types of dividend signalling behaviour, that can represent different forms of dividend pol-icy, and that generate different models of the rela-tionship between company cash flows, dividends, and share prices (see Allen and Michaely, 2003; Benartzi et al., 1997; Eades, 1982; and Grullon et al., 2003 for surveys).
Another line of argument focuses on financial policy choices as a part of the solution to in-vestor/manager agency conflicts. For example, Jensen (1986) points to the potential agency costs of firms having very high free cash flows, and the need to set limits to the discretionary investment
2High-tech firms invest more in unrecognised intangible
assets (Kwon, 2002). As a consequence, our high-growth sam-ple contains a much larger proportion of high-tech firms than the low-growth sample.
choices of company managers. Under this line of reasoning, the payment of dividends is potentially informative about the quality of external investor protection in the firm. Note that under this line of reasoning, the communication of information is in-cidental to the governance role of dividends.
Some recent studies explore the nature of the in-formation revealed by dividends (i.e. Grullon et al., 2002 and Nam et al., 2008). These studies sug-gest that dividends changes are associated with changes in firm risk. In particular, Nam et al. (2008) show that firms that initiate dividend pay-ment experience a reduction in risk, and Grullon et al. (2002) show that firms that increase their pay-out ratios experience reduced risk.
A number of papers have studied the empirical links between earnings quality (in particular earn-ings persistence) and dividend payouts. The recent papers of Garcia-Borbolla et al. (2004) and Skinner (2004) identify subtle and complex inter-actions between dividend propensity and the qual-ity of earnings. Moreover, these studies reveal significant differences between US and European firms. Skinner’s study suggests that dividends are more likely to be paid by the larger, more stable US firms. Such firms tend to have more pre-dictable earnings streams. Thus his work suggests that the predictability of earnings from current earnings and the payment of dividends are mutual-ly related through the undermutual-lying stability of the firm. On the other hand, the study by Garcia-Borbolla et al. (2004) of European firms concludes that dividends are more useful for predicting future earnings where the quality of earnings is low.
This paper makes no attempt to identify the spe-cific types of information that dividend payments convey to investors. As in Hanlon et al. (2007) we simply start from the observation that not all firms pay dividends. Firms that do not pay dividends, by definition, cannot be using dividends to communi-cate value-relevant information. On the other hand, the payment of dividends may change the ability of the market to anticipate future earnings changes.
Relative to Hanlon et al. we make three contri-butions. First we present results for the UK econo-my for a period in which the propensity to pay dividends was much higher than in the US. The average dividend propensity for the firms in our sample is 84%, considerably higher than the corre-sponding propensity for US firms. For example, Skinner (2008) reports an average dividend propensity of 28% for US listed firms for the years 1995–2004. Second, we jointly model the effects of voluntary disclosure and dividend propensity on share price anticipation of earnings. Third, we model the extent to which the effects of dividend propensity and voluntary disclosure on share price anticipation of earnings are linked to the growth
characteristics of firms.
Hanlon et al. (2007) make no distinction be-tween high- and low-growth firms. However it can be argued that the importance of other information for predicting future earnings could differ between high- and low-growth situations. High-growth firms typically exhibit higher levels of information asymmetry than low-growth firms, and high-growth firms are more likely to need to raise ex-ternal capital in order to finance their dividend payments whilst maintaining high levels of invest-ments. Thus there are good reasons to expect the effects of voluntary disclosure and dividend propensity to vary between high- and low-growth firms.
Thus we state the following hypotheses:
H5 The degree of share price anticipation of earnings is greater for dividend-paying firms than for non-dividend-paying firms.
H6 The degree of share price anticipation of earnings is greater for dividend-paying growth firms than non-dividend-paying high-growth firms.
H7 The degree of share price anticipation of earnings is greater for dividend-paying growth firms than non-dividend-paying low-growth firms.
H8 The strength of the degree of association be-tween share price anticipation of earnings and dividend propensity is greater for high-growth firms than low-high-growth firms.
2.3. The joint effect of disclosure and dividends on prices leading earnings
Having introduced the main hypotheses relating to share price anticipation of earnings and the two forms of financial communication we now consid-er how to test whethconsid-er the two forms of communi-cation act as complements or substitutes. There are four logical possibilities:
First, if voluntary disclosure and dividend pay-ments are different ways of conveying the same in-formation, then firms that have high levels of disclosure but pay no dividends, should exhibit roughly the same degree of share price anticipation of earnings as firms with high levels of disclosure that pay dividends. Similarly firms that pay divi-dends should have roughly the same level of share price anticipation of earnings irrespective of their level of disclosure.
Second, if dividend payments and voluntary dis-closure convey unrelated types of information, then the level of share price anticipation of earn-ings for firms that have high levels of disclosure and pay dividends should be stronger than the level of share price anticipation of earnings for firms that have high levels of disclosure but do not
pay dividends. Similarly, the level of share price anticipation of earnings should be stronger when both types of communication are present than when only the payment of dividends is present.
Third, if the combination of dividend payments and voluntary disclosure produces related infor-mation that is ‘reinforcing’ (i.e. if there is a multi-plicative effect) then share price anticipation of earnings will be the greatest for firms that have high disclosure and also pay dividends.
Finally, if dividend payments and voluntary dis-closure convey related information, but some of the information is common to both, i.e. ‘partially additive’, then the level of share price anticipation of earnings for firms that have high levels of dis-closure and pay dividends should be higher than the level of share price anticipation of earnings when firms have high levels of disclosure but do not pay dividends or the level of share price antic-ipation of earnings should be higher when both types of communications are present than when only the payment of dividends is present. We test to see which of these four possibilities is present in the data by allowing for an interactive effect in our model. Thus we state the following hypotheses:
H9 The effects of voluntary disclosure and divi-dend propensity on the degree of share price anticipation of earnings are additive.
H10 The effects of voluntary disclosure and divi-dend propensity on the degree of share price anticipation of earnings for high-growth firms are additive.
H11 The effects of voluntary disclosure and divi-dend propensity on the degree of share price anticipation of earnings for low-growth firms are additive.
H12 The strength of the joint effect of disclosure and dividend propensity on share price antic-ipation of earnings is the same for high- and low-growth firms.
To test the above hypotheses, we follow the ap-proach of Hussainey et al. (2003) to automate the generation of forward-looking earnings disclosure scores. Section 3 provides further details. We use the modified regression model of Collins et al. (1994) to measure the influence of voluntary dis-closure and dividend propensity on share price an-ticipation of earnings. This model is discussed in Section 4.
3. Disclosure scores
We adopt the scoring methodology developed in Hussainey et al. (2003). They automate the gener-ation of disclosure scores for large samples of UK firms through the use of QSR N6, a text analysis software package.3We focus on annual report
nar-ratives because they are more likely to contain vol-untary forward-looking earnings predictions than other sections of the annual report. We choose nar-rative sections with at least one of the following headings: Financial Highlights, Summary Results, Chairman’s Statement, Chief Executive Officer’s Review, Operating and Financial Review, Financial Review, Financial Director’s Report, Finance Review, Business Review, and Operating Review. All other sections of the annual report are exclud-ed from our analysis (for more details, see Hussainey et al., 2003).
To measure the informativeness of a firm’s nar-rative disclosures, we identify the forward-looking earnings sentences that are most likely to be useful for predicting a firm’s future earnings changes. Our measure of disclosure quality is the number of forward-looking sentences in the annual report narratives that contain earnings indicators. We focus on earnings indicators because Hussainey et al. (2003) and Schleicher et al. (2007) find that these indicators improve the stock market’s ability to anticipate future earnings change one year ahead.
We calculate our disclosure scores in three steps. The first step requires the identification of all sen-tences that are associated with forward-looking statements in annual report narratives. In this step, we text-search the narrative sections of annual re-ports using the list of forward-looking key words adopted in Hussainey et al. (2003: 277). This list includes the following 35 keywords: accelerate, anticipate, await, coming (financial) year(s), com-ing months, confidence (or confident), convince, (current) financial year, envisage, estimate, even-tual, expect, forecast, forthcoming, hope, intend (or intention), likely (or unlikely), look forward (or look ahead), next, novel, optimistic, outlook, planned (or planning), predict, prospect, remain, renew, scope for (or scope to), shall, shortly, should, soon, will, well placed (or well posi-tioned), year(s) ahead. Similar to Hussainey et al. (2003) we also include future year numbers in the list of forward-looking keywords.
The next step in the generation of earnings dis-closure scores is the identification of information items that are relevant to the capital market in as-sessing the firm’s future earnings. Since the capi-tal market’s information set is unobservable, Hussainey et al. (2003) examine the contents of sell-side analysts’ reports as a proxy for the mar-ket’s view about the firm’s disclosure quality. For each forward-looking statement in analysts’ re-ports, they identify the key noun of that statement. For the purpose of the current paper, we use the
3In the current paper, we use QSR N6 to further facilitate
the automation of text searches. Further information about QSR N6 is available online at http://www.qsrinternational.com.
same list adopted in Hussainey et al. (2003: 280) that is related to earnings indicators. The list con-tains the following 12 keywords: benefit, break even, budget, contribution, earnings, EPS, loss, margin, profit, profitability, return and trading.
Finally, we use QSR N6 to count the number of sentences that include both at least one forward-looking keyword and at least one earnings indica-tor. This is done by finding the intersection of the keyword search and the topic search.
4. A measure of prices leading earnings
Our measure of prices leading earnings is based on Collins et al. (1994). They use the future earnings response coefficient (FERC) as a proxy for the stock market’s ability to anticipate future earnings. FERC is estimated by regressing current-year stock returns on current and future annual earnings and returns plus control variables. The regression model of Collins et al. (1994) has been applied in a large number of recent papers, e.g. Banghøj and Plenborg, 2008; Dhiensiri et al., 2005; Ettredge et al., 2005; Gelb and Zarowin, 2002; Hanlon et al., 2007; Hussainey et al., 2003; Lee et al., 2007; Lundholm and Myers, 2002; Orpurt and Zang, 2006; Oswald and Zarowin, 2007; Schleicher et al., 2007 and Tucker and Zarowin, 2006. In effect the regression model of Collins et al. (1994) has become the standard technique for measuring prices leading earnings.Collins et al. (1994) start by highlighting the poor empirical performance of the basic contem-poraneous returns earnings regression.
Rt= b0+b1Xt+ ut (1)
Where Rtis the stock return for year t. Xtis de-fined as earnings change deflated by price at t–1. Under ideal conditions4 equation (1) will yield a perfect fit, and the earnings response coefficient (ERC) will be equal to –––1 + r
r , where r is the required rate of return on equity (Walker, 2004). Numerous attempts to estimate equation (1) on annual data have revealed a very poor statistical fit (an R2 of 10% or less) and an ERC between 1 and 3, i.e. much lower than the value implied by a typical cost of equity capital.
Collins et al. (1994) argue that current returns re-flect information about both current and future earnings. Therefore any attempt to explain current
stock return in terms of earnings changes, should control for information about future earnings re-ceived in the current period. In the light of this ar-gument, they include three future earnings growth variables (N=3 and k=1, 2, 3) and make a number of adjustments to equation (1) to arrive at the fol-lowing regression model:5
(2)
where:
Rtis the stock return for year t.
Rt+1, Rt+2and Rt+3are the stock returns of years
t+1, t+2 and t+3 respectively.
Xt, Xt+1, Xt+2 and Xt+3 are defined as earnings change deflated by lagged earnings at t–1.
EPt–1is earnings of period t–1 over price starting four months after the financial year-end of peri-od t–1.
AGtis the growth rate of total book value of as-sets for period t.
Equation (2) shows that a number of forward-dated variables are introduced in order to measure the level of prices leading earnings. Specifically, the model includes future earnings changes as proxies for the information received by the market in period t about earnings growth in years t+1 and beyond. The inclusion of forward returns in the model, Rt+1, Rt+2and Rt+3, controls for news about earnings growth in period t+1, t+2 and t+3 re-ceived in period t+1, t+2 and t+3 respectively. Because the forward returns variables control for news received in the future about future earnings, the forward earnings variables Xt+1, Xt+2 and Xt+3
proxy for news about future earnings received in the current period, t. This model includes the con-temporaneous asset growth rate, AGtto control for the possibility that firms may invest in advance of future earnings. It also includes the earnings-price ratio, EPt–1, to control for the possibility that the earnings of period t–1 are not a good proxy for the market’s expectations (at time t–1) of the earnings for period t and beyond.
For the ease of exposition we following the idea of Lundholm and Myers (2002) and Oswald and Zarowin (2007) in aggregating future earnings over three years into one future variable, Xt3 and future returns over three years into one future vari-able, Rt3.
6 Such aggregations produce the
follow-ing regression model:
Rt= b0+ b1Xt+ b2Xt3+ b3Rt3 (3)
+ b4AGt+ b5Et–1+ et
4Walker (2004) argues that ideal conditions require
semi-strong market efficiency. In such a market, earnings follow a random walk and earnings at time t capture all value-relevant information available at time t.
5Note that Collins et al. (1994) find that the association
be-tween current stock returns and future earnings is not signifi-cant beyond three years ahead.
6Lundholm and Myers (2002) show that their results are
unchanged whether the three future years are aggregated or separated.
To test our main hypotheses, we use the modi-fied version of Collins et al. (1994), equation (3). However, similar to Hussainey et al. (2003) and Schleicher et al. (2007), in defining the earnings growth variable, we deflate earnings change by the share price at the start of the current year and not by lagged earnings. This is due to the fact that it is difficult to define earnings growth when lagged earnings are negative or zero. As a result, a price deflator is used instead of the earnings deflator.
As argued earlier, current earnings numbers are likely to be less useful for predicting earnings for high-growth firms. So we predict that these firms will use other indicators such as voluntary disclo-sure or dividend decisions to convey value-rele-vant information in addition to current earnings. Such information should enable the market to bet-ter anticipate a firm’s future earnings. This should lead to high voluntary disclosure firms or divi-dend-paying firms having a stronger relationship between current returns and future earnings changes than low-disclosure firms or non-divi-dend-paying firms. Therefore, we predict higher FERCs for high-disclosure firms or dividend-pay-ing firms.
To test this prediction we interact all independ-ent variables in equation (3) with a dummy vari-able, D, defined to be one for high-disclosure firms and zero otherwise. We do not use the actual dis-closure scores. Instead we define D to be 1 for firms in the top two quartiles of the distribution of disclosure scores and 0 otherwise.7We also inter-act all independent variables with a dummy vari-able, Div, defined to be one for firms that pay a dividend in the current year and zero otherwise. Finally we extend the model to test for the interac-tion between Dand Div. Interacting all explanato-ry variables in (3) with D, Div, and D*Divyields
The coefficient on Xtis hypothesised to be posi-tive. The coefficient on Xt3 measures three years ahead share price anticipation of earnings for non-dividend-paying firms with low disclosure scores. This is the base case in the model. All independent variables are interacted with both of the two dummy variables D and Div. The coefficient on
D*Xt3measures the extent to which share price an-ticipation of earnings is greater for high-disclosure
non-dividend-paying firms compared to the base case (i.e. it measures the pure disclosure effect). The coefficient on Div*Xt3 measures the extent to which share price anticipation of earnings is greater for low-disclosure dividend-paying firms compared to the base case.
We expect the regression coefficients associated with D*Xt3 and Div*Xt3 to be significantly positive for high-growth firms. In addition we expect these coefficients to be smaller for low-growth firms than for high-growth firms.
The variable D*Div*Xt3 measures the incremen-tal effect of both high disclosure and dividend propensity. There are four logical possibilities:8
First, both disclosure and dividends provide the same information. In this case, the coefficient on
D*Xt3 will be equal to the coefficient on Div*Xt3 . In addition, the coefficient on D*Div*Xt3 should be negative and equal in absolute value to the coeffi-cients on D*Xt3 or Div*Xt3 . As a result, the total impact of both disclosure and dividends should be calculated as follows:
D*Xt3+ Div*Xt3+ D*Div*Xt3= D*Xt3
(or = Div*Xt3, since D*Xt3= Div*Xt3).
Second, both types of communication provide (‘additive’) unrelated information. In this case, we predict the coefficient on D*Div*Xt3should not be significantly different from zero. As a result, the total impact of both disclosure and dividends should be calculated as follows:
D*Xt3+ Div*Xt3– D*Div*Xt3= D*Xt3+ Div*Xt3
Third, both types of communication provide related information that is ‘reinforcing’ or ‘multi-plicative’. In this case, the coefficient on
D*Div*Xt3 should be significantly greater than
zero. In other words, the sum of the coefficients on
D*Xt3, Div*Xt3 and D*Div*Xt3 should be
signifi-cantly greater than the sum of the coefficients on
D*Xt3 and Div*Xt3. In this case, the inference is that both dividend propensity and voluntary dis-closure are strictly complementary.
Finally, both types of communication provide related information, but some of the information is common to both, i.e. ‘partially additive’.
7In Hussainey et al. (2003) and Gelb and Zarowin (2002),
the authors drop observations with disclosure scores in the second and third quartiles. However, we use the full sample without dropping observations in the middle quartiles to main-tain a usable sample size for the regression analyses. As we will discuss later, Table 1, Panel C shows that the number of usable non-dividend-paying firms is 551. This number com-prises 297 high-growth years and 254 low-growth firm-years. Deleting firms in the middle quartiles will significantly reduce the usable number of observations in each growth cat-egory (e.g. the number will be 142 for high-growth firms and 111 for low-growth firms).
8The authors thank an anonymous referee for the suggestion.
Therefore, we predict that the coefficient on
D*Div*Xt3 should be significantly lesser than zero.
In other words, the sum of the coefficients on
D*Xt3, Div*Xt3 and D*Div*Xt3 should be
signifi-cantly less than the sum of the coefficients on
D*Xt3 and Div*Xt3. In this case, the inference is that both dividend propensity and voluntary dis-closure are partial substitutes.
We treat the issue of which of these four logical possibilities is true as a purely empirical question and offer no prior theoretical predictions as to which of these outcomes is the most likely.
5. Data
To perform our analyses, annual reports in an elec-tronic format are required in order to use QSR N6 software as a text analysis tool. Therefore, our ini-tial sample is limited to all UK non-financial firms on the Dialogdatabase that have at least one an-nual report. Dialogcovers large cross-sections of electronic non-financial UK annual reports for the years 1996–2002. So, we limit our study to that sample period.9We use book-to-market value as a measure of growth. We measure growth on a year-ly basis. This allows us to examine the effect of disclosure and dividends on share price anticipa-tion of earnings when firms are classified as high-growth or low-high-growth in a particular time period. We identify high-growth firms as those having below median levels of book-to-market value and low-growth firms as those having above median levels of book-to-market value.
The total number of annual reports on Dialogfor non-financial firms for the sample period is 8,098. Of those, 7,977 firm-years have matching records
in Datastream. We delete 1,312 firm-years
obser-vations because of changing year-ends. This leaves 6,665 firm-years. We also delete 2,958 firm-years missing observations. This leaves 3,707 firm-year observations. Finally, we delete outliers defined as observations falling into the top or bottom 1% of the distribution of any of the regression variables. Following Schleicher et al. (2007), we treat the ob-servations of high- and low-growth firms as sepa-rate distributions. Otherwise, an unreasonably large number of high-growth firms’ observations will fall into the top and bottom 1%. Deletion of inappro-priate observations and observations with missing data reduces the sample to 3,503 firm-years obser-vations. Of those, 1,770 firm-years are high-growth firms and 1,733 firm-years are low-growth firms.
Earnings per share data is calculated by dividing operating income before all exceptional items
(Worldscopeitem 01250) by the outstanding
num-ber of shares. Xt, Xt+1, Xt+2and Xt+3are then defined as the earnings change for the periods t, t+1, t+2 and t+3 deflated by the share price. Both current and future earnings changes are deflated by the share price at the start of the return window for
pe-riod t. Xt3 is calculated as the aggregated future earnings over the following three years relative to the financial year-end. We collect returns data from
Datastream. Rt, Rt+1, Rt+2and Rt+3are measured as
buy-and-hold returns starting from eight months before the financial year-end to four months after the financial year-end in year t. In the return meas-ures, similar to Hussainey et al. (2003), we incor-porate a four-month lag to ensure that annual reports have been released. Rt3is calculated as the aggregated future returns over the following three years relative to the financial year-end. Earnings yield, EPt–1, is defined as period t–1’s earnings over price four months after the financial year-end of pe-riod t–1. AGtis the growth rate of total book value of assets for period t(Datastreamitem 392).
We collect dividends per share from Worldscope
(item 05101).10 The dividends dummy variable,
Div, is set equal to one if firms pay dividends in year t and zero otherwise. In addition to the above variables, we use a disclosure dummy variable to examine the effect of disclosure on the returns-earnings association. The disclosure dummy, D, is set equal to one for firms in the top two quartiles of the distributions of disclosure scores and zero otherwise. As mentioned earlier, we identify high-(low-) growth firms as those having below (above) median levels of BTMV. BTMVratio is calculated as the inverse of the market to book value of equi-ty ratio (Datastreamitem: MTBV).
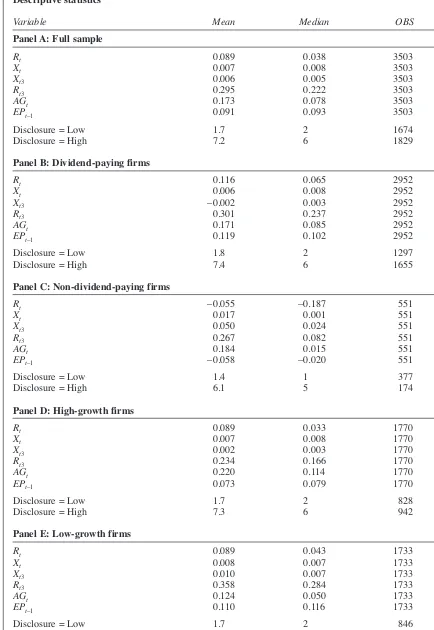
Table 1 presents descriptive statistics for our re-gression variables. Panel A reports the descriptive analysis for the full sample. Panel B (C) reports the descriptive analysis for dividend (non-divi-dend) paying firms. Panel D (E) reports the de-scriptive analysis for high- (low-) growth firms.
Table 1 shows that dividends were paid in 84% (=2952/3503) of the firm years in our sample.11
9Dividends are usually tested over longer sample periods.
However, we restrict our analyses to the years in which large
numbers of annual reports are available on Dialog. This
en-ables us to test the joint effect of disclosure and dividends on prices leading earnings.
10Worldscopedefines dividends per share (item 05101) as
‘the total dividends per share declared during the calendar year for U.S. corporations and fiscal year for Non-US corpo-rations. It includes extra dividends declared during the year. Dividends per share are based on the ‘gross’ dividend of a se-curity, before normal withholding tax is deducted at a coun-try’s basic rate, but excluding the special tax credit available in some countries’.
11The proportion of dividend-paying firms for the overall
population of UK firms is 69%. This number is calculated by dividing the total number of dividend-paying firms by the total number of firms in the period of 1996–2002. This number is consistent with a recent study by Denis and Osobov (2008) which find that 73% of UK firms pay dividends in the sample period 1996–2002. However, in our sample, the proportion of dividend-paying firms is much higher than the overall popula-tion of dividend-paying firms. This is due to the delepopula-tion of in-appropriate observations and observations with missing data in the sample period of 1996–2002.
Table 1
Descriptive statistics
Variable Mean Median OBS
Panel A: Full sample
Rt 0.089 0.038 3503
Xt 0.007 0.008 3503
Xt3 0.006 0.005 3503
Rt3 0.295 0.222 3503
AGt 0.173 0.078 3503
EPt–1 0.091 0.093 3503
Disclosure = Low 1.7 2 1674
Disclosure = High 7.2 6 1829
Panel B: Dividend-paying firms
Rt 0.116 0.065 2952
Xt 0.006 0.008 2952
Xt3 –0.002 0.003 2952
Rt3 0.301 0.237 2952
AGt 0.171 0.085 2952
EPt–1 0.119 0.102 2952
Disclosure = Low 1.8 2 1297
Disclosure = High 7.4 6 1655
Panel C: Non-dividend-paying firms
Rt –0.055 –0.187 551
Xt 0.017 0.001 551
Xt3 0.050 0.024 551
Rt3 0.267 0.082 551
AGt 0.184 0.015 551
EPt–1 –0.058 –0.020 551
Disclosure = Low 1.4 1 377
Disclosure = High 6.1 5 174
Panel D: High-growth firms
Rt 0.089 0.033 1770
Xt 0.007 0.008 1770
Xt3 0.002 0.003 1770
Rt3 0.234 0.166 1770
AGt 0.220 0.114 1770
EPt–1 0.073 0.079 1770
Disclosure = Low 1.7 2 828
Disclosure = High 7.3 6 942
Panel E: Low-growth firms
Rt 0.089 0.043 1733
Xt 0.008 0.007 1733
Xt3 0.010 0.007 1733
Rt3 0.358 0.284 1733
AGt 0.124 0.050 1733
EPt–1 0.110 0.116 1733
Disclosure = Low 1.7 2 846
Disclosure = High 7.1 6 887
Table 1
Descriptive statistics(continued)
Table 1 presents descriptive statistics. Panel A reports the descriptive analysis for the full sample. Panel B (C) reports the descriptive analysis for dividend (non-dividend) paying firms. Panel D (E) reports the descriptive analysis for high- (low-) growth firms. Returns, Rt, is calculated as buy-and-hold returns from eight months
be-fore the financial year-end to four months after the financial year-end. Rt3is the aggregated three years future
returns. The earnings variable, Xt, is defined as earnings change per share deflated by the share price four
months after the end of the financial year t–1. Xt3is the aggregated three years future earnings change. Earnings
measure is the Worldscopeitem 01250 which is operating income before all exceptional items. EPt–1is defined
as period t–1’s earnings over price four months after the financial year-end of period t–1. AGtis the growth rate
of total book value of assets for period t(Datastreamitem 392). Firm-years with a disclosure score on top (bot-tom) 50% of the distribution of disclosure scores are defined as high- (low-) disclosure firm-year. Dividend (non-dividend) paying firms are those paying (not paying) dividends at the current year. Dividends measure is dividends per share, Worldscopeitem 05101. High-growth firms are defined as those having below median lev-els of BTMV, while low-growth firms are defined as those having above median levlev-els of BTMV. BTMVratio is calculated as the inverse of the market-to-book value of equity ratio (Datastreamitem MTBV).
Panels B and C of Table 1 show that the median re-turn in period t is positive for dividend-paying firms, whilst it is negative for non-dividend-pay-ing firms. The median current and future earnnon-dividend-pay-ings change is positive for both dividend-paying and non-dividend-paying firms.
Panels B and C of Table 1 also show that divi-dend-paying firms, on average, have slightly higher mean and median levels of voluntary dis-closure than non-dividend-paying firms. 56% of dividend-paying firms are in the category of high-disclosure firms compared to 32% of non-divi-dend-paying firms.12 The table shows a material difference in the disclosure scores between firms in high- and low-disclosure categories for both dividend and non-dividend-paying firms. The mean disclosure score ranges from 6.1 to 7.4 for-ward-looking earnings sentences for firms in the high-disclosure category; whilst the mean disclo-sure score ranges from 1.4 to 1.8 forward-looking earnings sentences for firms in the low-disclosure category. The differences in means between high-and low-disclosure scores are statistically signifi-cant at the 1% level (not reported in Table 1).
Panels D and E of Table 1 show that the median disclosure scores for the high- and low-disclosure groups is quite similar across high- and low-growth firms. The median disclosure score is six
forward-looking earnings sentences for firms in the high-disclosure category; whilst it is two for-ward-looking earnings sentences for firms in the low-disclosure category. In addition, the differ-ences in means between high- and low-disclosure scores are statistically significant at the 1% level (not reported in Table 1). Panels D and E also show that the median return in period t for high-growth firms (3.3%) is slightly lower than that for low-growth firms (4.3%). The median current and future earnings change is positive for both high-and low-growth firms. Finally, the median future earnings changes of low-growth firms are higher than those of high-growth firms.
6. Main empirical results
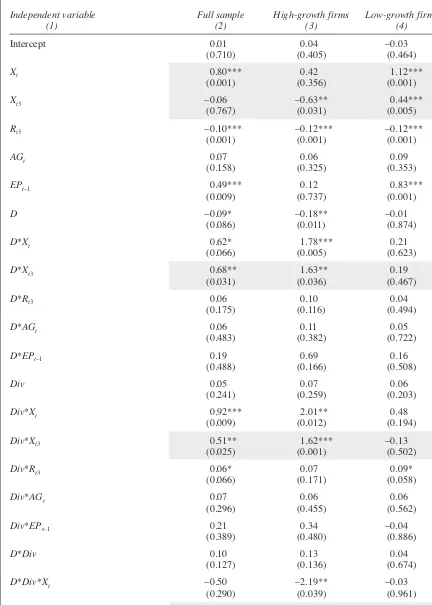
Our main empirical results are based on pooled re-gressions for the sample period 1996–2002.13 Table 2 reports these results. Column 2 reports the results for the full sample. Column 3 (4) reports the results for firms in the high- (low-) growth firms. Heteroscedasticity-consistent p-values are given in parentheses.
6.1. Disclosure and prices leading earnings
Table 2, column 2 presents the results of esti-mating equation (4) for the full sample. As expect-ed, the coefficient associated with Xt is positive and significant. The coefficient for Xtis 0.80 with a p-value of 0.001. However, the coefficient for Xt3 is –0.06 with a p-value of 0.767. This suggests that current stock price is positively associated with current earnings changes, but not with future earn-ings change. So there is no evidence that prices lead earnings for low-disclosure firms that pay no dividends.
The incremental predictive value of high for-ward-looking earnings disclosures for anticipat-ing future earnanticipat-ings is given by the coefficient on
12The percentages are calculated as 56% = 1655/2952 and
32% = 174/551.
13Hanlon et al. (2007: 16) argue that ‘future earnings
re-sponse regressions are likely to suffer from both cross-sec-tional correlation (correlation across firms within a year) and time series correlation (over time within the same firm)’. We follow the method recommended by Petersen (2008) and used in Hanlon et al. (2007) by including year dummies to control for the time series correlation and by allowing for error clus-tering within firms (Rogers standard errors) to control for the cross-sectional correlation.
Table 2
Regression results: the effect of disclosure and dividend propensity on prices leading earnings
Independent variable Full sample High-growth firms Low-growth firms
(1) (2) (3) (4)
Intercept 0.01 0.04 –0.03
(0.710) (0.405) (0.464)
Xt 0.80*** 0.42 1.12***
(0.001) (0.356) (0.001)
Xt3 –0.06 –0.63** 0.44***
(0.767) (0.031) (0.005)
Rt3 –0.10*** –0.12*** –0.12***
(0.001) (0.001) (0.001)
AGt 0.07 0.06 0.09
(0.158) (0.325) (0.353)
EPt–1 0.49*** 0.12 0.83***
(0.009) (0.737) (0.001)
D –0.09* –0.18** –0.01
(0.086) (0.011) (0.874)
D*Xt 0.62* 1.78*** 0.21
(0.066) (0.005) (0.623)
D*Xt3 0.68** 1.63** 0.19
(0.031) (0.036) (0.467)
D*Rt3 0.06 0.10 0.04
(0.175) (0.116) (0.494)
D*AGt 0.06 0.11 0.05
(0.483) (0.382) (0.722)
D*EPt–1 0.19 0.69 0.16
(0.488) (0.166) (0.508)
Div 0.05 0.07 0.06
(0.241) (0.259) (0.203)
Div*Xt 0.92*** 2.01** 0.48
(0.009) (0.012) (0.194)
Div*Xt3 0.51** 1.62*** –0.13
(0.025) (0.001) (0.502)
Div*Rt3 0.06* 0.07 0.09*
(0.066) (0.171) (0.058)
Div*AGt 0.07 0.06 0.06
(0.296) (0.455) (0.562)
Div*EPt–1 0.21 0.34 –0.04
(0.389) (0.480) (0.886)
D*Div 0.10 0.13 0.04
(0.127) (0.136) (0.674)
D*Div*Xt –0.50 –2.19** –0.03
(0.290) (0.039) (0.961)
D*Div*Xt3 –0.44 –1.68* 0.07
(0.220) (0.064) (0.845)
D*Xt3. The coefficient on D*Xt3 is 0.68 with a p-value of 0.031. The significantly positive coef-ficient suggests that high-disclosure firms that pay no dividends exhibit higher levels of share price anticipation of earnings three years ahead than low-disclosure firms that pay no dividends. Thus the effect of disclosure on prices leading earnings is in line with the prior findings of Lundholm and Myers (2002) and Gelb and Zarowin (2002). Based on these findings, we ac-cept hypothesis 1.
Table 2, columns 3 and 4 reveal a number of sig-nificant differences between high- and low-growth firms. The current earnings variable exhibits a higher ERC for low-growth firms than high-growth firms. The coefficient on Xtis 1.12 with a p-value of 0.001 for low-growth firms, while it is positive (0.42), but insignificant, for high-growth firms. The difference between the two coefficients is statistically significant at the 1% level.
We find no evidence of share price anticipation of earnings for high-growth firms that pay no div-idends and that provide low voluntary disclosure. For these firms, we obtain a statistically significant
negative coefficient on Xt3. This indicates that the
market is unable to anticipate future earnings
changes for high-growth firms that provide low voluntary disclosure in their annual report discus-sion sections and that do not pay dividends in the current year. In contrast there is strong evidence that low-growth low-disclosure firms that do not pay dividends do exhibit share price anticipation of earnings for three years ahead. The coefficient on Xt3is positive and significant at the 1% level.
Looking at the effect of disclosure on prices leading earnings, we find that the coefficient on
D*Xt3for high-growth firms is 1.63 with a p-value of 0.036. This coefficient indicates that narrative forward-looking earnings disclosures in high-growth firms’ annual reports improve the market’s ability to anticipate future earnings change three years ahead. Based on this result we accept hy-pothesis 2.
In contrast, there appears to be no significant ef-fect of disclosure on share price anticipation of earnings for low-growth firms that do not pay div-idends. The coefficient on D*Xt3, for high-disclo-sure low-growth firms is 0.19 with a p-value of 0.467. Thus, the voluntary disclosures of low-growth firms do not appear to improve the stock market’s ability to anticipate future earnings changes. This leads us to reject hypothesis 3.
Table 2
Regression results: the effect of disclosure and dividend propensity on prices leading earnings(continued)
Independent variable Full sample High-growth firms Low-growth firms
(1) (2) (3) (4)
D*Div*Rt3 –0.05 –0.08 –0.03
(0.357) (0.293) (0.664)
D*Div*AGt –0.11 –0.10 –0.13
(0.288) (0.461) (0.397)
D*Div*EPt–1 –0.48 –0.66 –0.56*
(0.158) (0.316) (0.098)
Observations 3,503 1,770 1,733
R2 0.157 0.176 0.183
Table 2 reports regression results. The results for firms in high- and low-growth firms are reported in columns (3) and (4), respectively. The ‘Full Sample’ results in column (2) combine both types of firms in a single panel. P-values are reported in parentheses. Returns, Rt, is calculated as buy-and-hold returns from eight months
be-fore the financial year-end to four months after the financial year-end. Rt3is the aggregated three years’ future
returns. The earnings variable, Xt, is defined as earnings change per share deflated by the share price four
months after the end of the financial year t–1. Xt3 is the aggregated three years’ future earnings change.
Earnings measure is the Worldscopeitem 01250 which is operating income before all exceptional items. EPt–1
is defined as period t–1’s earnings over price four months after the financial year-end of period t–1. AGtis the
growth rate of total book value of assets for period t(Datastreamitem 392). Firms with a disclosure score in the top (bottom) 50% of the distribution of disclosure scores are defined as high- (low-) disclosure firms. The dummy variable, D, is set equal to 1 (0) for high- (low-) disclosure firms. Dividends measure is dividends per share, Worldscopeitem 05101. The dummy variable, Div, is set equal to 1 (0) for firms paying (not paying) dividends at the current year. High-growth firms are defined as those having below median levels of BTMV, while low-growth firms are defined as those having above median levels of BTMV. BTMVratio is calculated as the inverse of the market-to-book value of equity ratio (Datastreamitem MTBV). The significance levels (two-tail test) are: * = 10%, ** = 5%, *** = 1%.
Overall our evidence for low-growth firms sug-gests that the market is able to forecast future earn-ings changes, but this ability is neither linked to nor improved by forward-looking earnings state-ments in annual report narrative sections. The evi-dence for high-growth firms supports the view that the market has particular difficulties in forecasting firms’ future earnings changes. However, this dif-ficulty is partially overcome by increasing the number of forward-looking earnings information in annual report narrative sections.
We also test for differences between high-growth firms and low-high-growth firms. We test the extent to which the association between share price anticipation of earnings and disclosure is sig-nificantly stronger for high-growth firms than for low-growth firms. We perform this test by includ-ing all high- and low-growth firms in one dataset. Then, before running our analyses, we create a dummy variable to equal 1 for high-growth firms and zero otherwise. Finally, we interact the high-growth dummy variable throughout the model. We find a positive and significant coefficient on
Growth*D*Xt3of 0.50 with a p-value of 0.020 (not
reported in Table 2). This suggests that that the strength of the degree of association between share price anticipation of earnings and voluntary dis-closure is stronger for high-growth firms than for low-growth firms. This leads us to accept hypoth-esis 4.
6.2. Dividends and prices leading earnings
As discussed earlier, voluntary disclosure is one of the ways that firms provide information about future earnings to the market. Another way that firms can provide information is through dividend policy. Here we examine the extent to which divi-dend propensity improves the stock market’s abil-ity to anticipate future earnings changes. The incremental predictive effect of dividend propensi-ty on share price anticipation of earnings is given by the coefficient on Div*Xt3.
Column 2, Table 2 shows that the coefficient on
Div*Xt3is positive and significant. This coefficient is 0.51 with a p-value of 0.025. This indicates that paying dividends improves the market’s ability to anticipate future earning changes. The significant positive coefficient indicates that low-disclosure firms that pay dividends exhibit higher levels of share price anticipation of earnings than low-dis-closure firms that pay no dividends. The signifi-cant effect of dividend propensity on prices leading earnings is in line with the findings of Hanlon et al. (2007). Based on these findings, we accept hypothesis 5.
Table 2, column 3 shows that the coefficient on
Div*Xt3 for high-growth firms is 1.62 with a p-value of 0.001. This coefficient demonstrates that high-growth dividend-paying firms exhibit
signif-icantly higher levels of share price anticipation of earnings than high-growth non-dividend-paying firms. Based on this result we accept hypothesis 6. In contrast, Table 2, column 4 shows that the co-efficient on Div*Xt3for low-growth firms is nega-tive and insignificant. Thus, there is no evidence that the dividend propensity of low-growth firms is associated with an improvement in the market’s ability to anticipate future earnings changes. Based on this result we reject hypothesis 7.
Overall our evidence indicates that there is a ma-terial difference between high- and low-growth firms in the association between dividend propen-sity and share price anticipation of earnings. For high-growth firms we find that the ability of the market to anticipate future earnings changes is sig-nificantly greater when the firm pays dividends in the current year. We find no such evidence for low-growth firms.
We test for a difference between high-growth and low-growth firms by interacting a dummy variable for high growth throughout the model. We find a positive and significant coefficient on
Growth*Div*Xt3 of 1.41 with a p-value of 0.001
(not reported in Table 2). This suggests that the strength of the degree of association between share price anticipation of earnings and dividend propensity is stronger for high-growth firms than for low-growth firms. This leads us to accept hy-pothesis 8.
Summarising the results for the above hypothe-ses (H1–H8), we find that both dividend propensi-ty and high disclosure are positively associated with share price anticipation of earnings for high-growth firms. However, there is no evidence of similar effects for low-growth firms.
6.3. The joint effect of disclosure and dividends on prices leading earnings
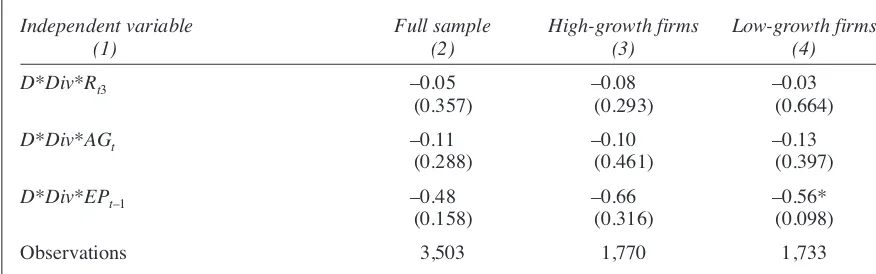
We now turn to the hypotheses which are con-cerned with the joint effects of high disclosure and dividend propensity on prices leading earn-ings. The incremental predictive value of both high disclosure and dividend propensity for an-ticipating future earnings is given by the coeffi-cient on D*Div*Xt3. Column 2, Table 2 shows some evidence of a substitution effect. The coef-ficient on the interaction variable D*Div*Xt3 is negative (–0.44) and statistically insignificant at an accepted level. This indicates that both disclo-sure and dividends provide related information, but some of the information is common to both, i.e. the effects are ‘partially additive’. Our best estimate for the combined effect of disclosure and dividend is 0.75 (i.e. 0.68 + 0.51– 0.44] which is smaller than the sum of the coefficients on D*Xt3and Div*Xt3[1.19 = 0.68 + 0.51] with a p-value of 0.001 (not reported in Table 2). However, because of the insignificant coefficient
on D*Div*Xt3, it is not safe to assume that the combined effect of disclosure and dividends is additive. Therefore, we reject hypothesis 9.
For high-growth firms, we also find some evi-dence of a substitution effect. The coefficient on the interaction variable D*Div*Xt3 is negative (–1.68) and significantly significant at the 10% level. This indicates that disclosure and dividends provide related information, but some of the infor-mation is common to both. Thus, it is not safe to assume that the combined effect of high disclosure and dividend propensity is perfectly additive. Our best estimate is that the combined effect of divi-dend propensity and high disclosure is 1.57 (i.e. 1.63 + 1.62 – 1.68) with a p-value of 0.001 (not re-ported in Table 2), which is below the first order effect for high disclosure and below the first order effect of dividend propensity. In this case, the in-ference is that both dividend propensity and vol-untary disclosure are strict substitutes for high-growth firms. Based on these findings we re-ject hypothesis 10.
As the results for the low-growth firms indicate that there is no first order effects either for divi-dend propensity or voluntary disclosure, we find that the coefficient on D*Div*Xt3is positive (close to zero) and statistically insignificant at an accept-ed level. Basaccept-ed on these findings we reject hy-pothesis 11.
Finally, we test for differences between high-growth and low-high-growth firms by including an ad-ditional dummy variable for high-growth firms. We test the extent to which the association be-tween the joint effect of voluntary disclosure and the payments of dividends on prices leading earn-ings are significantly stronger for high-growth firms than for low-growth firms. The analysis shows a negative significant coefficient on
Growth*D*Div*Xt3 of –1.83 with a p-value of
0.067 (not reported in Table 2). This significantly negative coefficient indicates that dividend propensity and high voluntary disclosure are strict substitutes for high-growth firms. We do not find such evidence for low-growth firms. This leads us to reject hypothesis 12.
7. Robustness analysis
In this section we examine the sensitivity of our re-sults to the determinants of the earnings response coefficients. Lundholm and Myers (2002) examine a number of determinants of currentearnings re-sponse coefficient when exploring the association between share price anticipation of earnings and corporate disclosure. These determinants include loss status, growth, beta, earnings persistence, size and the sign of the current return. Hanlon et al. (2007) examine a similar set of determinants when exploring the association between share price an-ticipation of earnings and dividend propensity. The
results of both studies (after the inclusion of con-trol variables) remain consistent with the original findings indicating that these control variables do not drive the association between disclosure (and dividends) and share price anticipation of earn-ings.
Schleicher et al. (2007) provide evidence that the association between annual report narratives and share price anticipation of earnings is not the same for profitable and unprofitable firms. They find that the ability of stock returns to anticipate the next year’s earnings change is significantly stronger for high-disclosure unprofitable firms. They do not find the same result for profitable firms. Therefore, based on the results in Schleicher et al. (2007), we examine the sensitivity of our results to firm profitability status. Similar to Schleicher et al. (2007) we define a loss (profit) as negative (positive) operating income before all (operating and non-operating) exceptional items
(Worldscopeitem 01250).
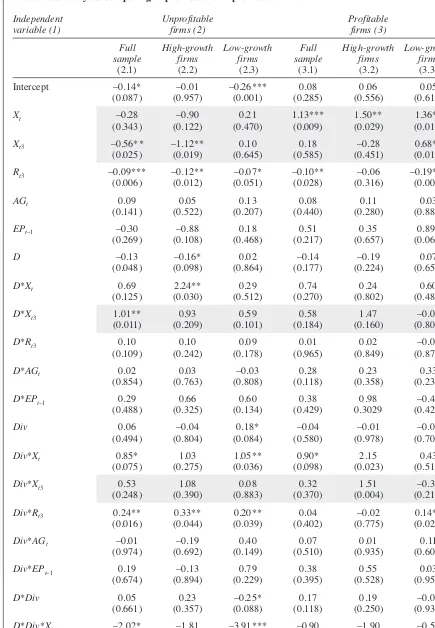
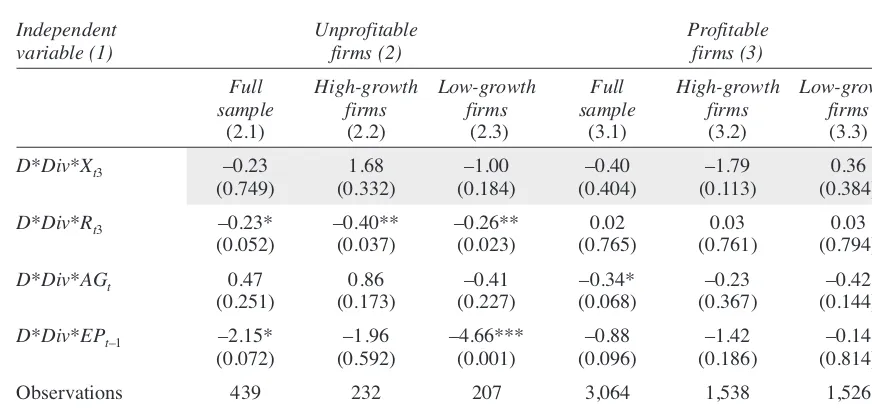
To examine the effect of losses on the association between disclosure, dividends and prices leading earnings, we divide our sample into two categories; unprofitable firms and profitable firms. Then, we run our regression model (equation 4) for each cat-egory. The results are reported in Table 3.
Consistent with Schleicher et al. (2007), columns 2.1 and 3.1 of Table 3 show that high dis-closure increases the market’s ability to anticipate future earnings changes for unprofitable firms – but not for profitable firms. The coefficient on
D*Xt3is positive (1.01) and statistically significant at the 5% level for unprofitable firms, whilst it is smaller and insignificant for profitable firms.
Table 3 shows that several of our previous find-ings still hold after separating our sample into un-profitable firms and un-profitable firms. In particular, column 3.3 shows that the market is able to antic-ipate future earnings changes for low-growth prof-itable firms (the coefficient on Xt3 is significantly positive at the 5% level). This ability is neither linked to nor improved by high disclosure or divi-dend propensity. In addition, columns 2.2 and 3.2 show that the market has particular difficulties in anticipating future earnings changes for high-growth profitable and unprofitable firms. The co-efficient on Xt3for these firms is negative.
Consistent with results in Table 2, we find that the effect of high disclosure on prices leading earnings is positive for high-growth firms regard-less of their profitability status. The coefficient on
DXt3 is 0.93 with a p-value of 0.209 for high-growth unprofitable firms and 1.47 with a p-value of 0.160 for high-growth profitable firms. Table 3 also shows that the effect of disclosure on prices leading earnings for high-growth firms is greater than the effect for low-growth firms regardless of the profitability of the firms. In particular, the