1
Abstrak: Paper ini bertujuan untuk menguji hubungan antara pertumbuhan bank dengan
efisiensi bank yang bersangkutan dengan mengaplikasikan pengujian hipotesis efficient structure sebagaimana yang diusulkan oleh Homma, Tsutsui, and Uchida (2012).
Analisis dilakukan dalam dua tahap. Tahap pertama adalah pengukuran efisiensi masing-masing bank Syariah, dan tahap kedua adalah untuk menguji pengaruh efisiensi tersebut terhadap pertumbuhan bank Syariah. Dalam penelitian ini efisiensi diukur dengan mengadopsi pendekatan berbasis akuntansi yaitu cost-to-income ratio (BOPO). Sedangkan untuk proksi pertumbuhan bank Syariah digunakan total aset, total pembiayaan, total dana pihak ketiga, dan total ekuitas bank yang bersangkutan. Pengujian dilakukan dengan meregresi langsung skor efisiensi terhadap proksi pertumbuhan bank Syariah. Untuk melengkapi penelitian ini, pada saat bersamaan juga dilakukan pengujian pengaruh konsentrasi pasar terhadap efisiensi bank Syariah, yang dikenal sebagai hipotesis quiet-life.
Pengamatan terhadap BOPO bank Syariah Indonesia memperlihatkan
kecenderungan terjadinya penurunan efisiensi dalam beberapa tahun terakhir. Perbandingan efisiensi di antara bank Syariah menunjukkan bahwa bank yang memiliki aset dan modal yang lebih banyak, serta bank yang telah beroperasi lebih lama cenderung lebih efisien. Penelitian ini juga menunjukkan bahwa satu-satunya bank Syariah asing yaitu Maybank Syariah merupakan bank yang paling efisien, ditunjukkan oleh rata-rata BOPO yang paling rendah selama periode pengamatan. Hasil pengujian memperlihatkan dukungan terhadap hipotesis efficient structure, yang mengindikasikan bahwa pertumbuhan bank Syariah di Indonesia dipengaruhi oleh efisiensi bank tersebut. Hasil pengujian juga menemukan bahwa konsentrasi pasar menurunkan efisiensi bank Syariah, yang konsisten dengan hipotesis quiet-life. Temuan ini mengimplikasikasikan bahwa terdapat intrik dalam dinamika hubungan pertumbuhan-efisiensi bank Syariah di Indonesia.
Hasil penelitian ini memberikan dukungan terhadap upaya para praktisi dan pemerintah Indonesia untuk meningkatkan efisiensi sehingga akan meningkatkan pertumbuhan dan kemampuan bersaing bank Syariah Indonesia dalam menghadapi kesempatan sekaligus tantangan pada Masyarakat Ekonomi ASEAN.
2 1. Introduction
This research is aimed to examine whether the efficiency contributes to bank’s growth., and
see whether the efficient-structure hypothesis (ES hypothesis) holds true for Indonesian Islamic
banks. In doing so, a new test of ES hypothesis proposed by Homma, Tsutsui, and Uchida (2012) will
be applied in this research. The test focuses on a core proposition of the hypothesis, that is : efficient
firms win the competition and grow.
Indonesian Islamic banking has been growing in a remarkable pace over the last two decades.
According to Moody's Investors Service report, since the end of 2005, Islamic banking assets in
Indonesia have expanded at a 33% compound annual growth rate, outpacing growth in the
conventional banking sector. Despite this strong growth, Islamic banks assets comprised only 5%
share of the Indonesian banking system.
Globally, although Indonesia have the largest Muslim population in the world, and it’s
forming a dynamic emerging economy, but in the global Islamic banking industry Indonesia still plays
a minor role. Indonesia's Islamic finance industry lag far behind Islamic finance industries in other
countries that contain a big Islamic community, only has 2.5% share of global Islamic finance
industry. Furhermore, in the World Islamic Banking Competitiveness Report 2016 by Ernst and
Young, none of Indonesian Islamic banks is in the list of top 20 Islamic banks in the world.
In recent years, there is a slowdown in asset growth of the Indonesian Islamic banking
industry. With total assets in the end of 2014 reached more than Rp270 trillion, it was down compared
to three years ago when the growth of Islamic banking assets reached 49%, but in 2014 it only
reached 12.4%.
At the same time, there is also a concern about the banks efficiency. The issue of efficiency is
a contentious one as Indonesia has one of the highest ratios of operational costs to revenue (BOPO)
among the ASEAN’s 5 largest economies (Global Business Guide Indonesia, 2012).
Efficiency is an important factor for banks to remain competitive. Islamic banks are no
exception, with increased competition from conventional banks, and foreign Islamic banks that seek
3 The issue of how efficiency in banking can be enhanced is important at the micro and
macroeconomic levels since efficiency has important policy implications. At bank management level,
financial institutions used to enjoy local oligopolies and therefore make rewarding profits, but such
advantages are shrinking due to growth in competition. At the macroeconomic level, bank efficiency
is a socially optimal target since it reduces the average cost of financial transactions and therefore
enhances the society’s welfare (Hussein 2002 : 5).
Efficiency is also highly recognized in Islam which needs to be discussed to analyze
efficiency concept from the Sharia point of view. Every Muslim businessman should have a strong
desire to increase efficiency (reduce cost) to benefit consumers (Affandi, 2002) by realizing the
‘maqasid’ (the goal of Islam). Incorporated in maqasid is everything that is considered necessary to
preserve and enrich faith, life, intellect, posterity, and wealth.
Given the circumstances evolve in Indonesian Islamic banks industry as explained above, this
research is aimed to investigate the relationship between growth and efficiency as a performance
measure of Indonesian Islamic banks, by testing the efficient-structure hypothesis as proposed by
Homma, Tsutsui, and Uchida (2012). The test is claimed to be more direct, and thus more
fundamental, than existing tests of the ES hypothesis. In addition to a regression testing the ES
hypothesis, this research will also take into account the determination of firm efficiency by
simultaneously estimating an equation with the efficiency measure as the dependent variable. The
direct merit of this simultaneous estimation is an increase in the efficiency of estimation, but this also
allows us to test the so-called quiet-life hypothesis. The quiet-life hypothesis suggests that in a
concentrated market firms do not minimize costs, because of insufficient managerial effort, lack of
profit-maximizing behavior, wasteful expenditures to obtain and maintain monopoly power, and/or
survival of inefficient managers (Berger and Hannan, 1998). Therefore, this research will examine in
the efficiency regression whether firms in a more concentrated market are more inefficient.
The rest of the paper is organized as follows: Section 2 provides a brief review of the relevant
literature, that is, the theory of firm efficiency and efficient structure (ES) hypothesis. Section 3
presents data and methodology. In section 4, provides the findings of the study. Section 5 concludes
4 2. Literature Review
For Islamic banks, measuring the performance is necessary to be able to detect problems and
settle concerns about the safety and soundness of investments for depositors, managers, and regulators
alike. It is highly important for managers to determine the financial position of their institution
compared to their competition or industry benchmarks, as well as evaluating how effective previously
taken decisions affected the bank. Islamic bank performance measurements also help Sharia
Supervisory Boards and other regulators to understand the performance of banks and to ensure only
transparent and clear information is available and used. Finally it helps investors to identify chances
and investment opportunity and ensure that the best decision regarding use of funding is being taken
(CIBAFI, 2006: 4).
The issue of how efficiency in banking can be enhanced is important at the micro and
macroeconomic levels since efficiency has important policy implications. At bank management level,
financial institutions used to enjoy local oligopolies and therefore make rewarding profits, but such
advantages are shrinking due to growth in competition. At the macroeconomic level, bank efficiency
is a socially optimal target since it reduces the average cost of financial transactions and therefore
enhances the society’s welfare (Hussein 2002 : 2).
Efficiency is also highly recognized in Islam which needs to be discussed to analyze
efficiency concept from the Sharia point of view. Every Muslim businessman should have a strong
desire to increase efficiency (reduce cost) to benefit consumers (Affandi, 2002) by realizing the
‘maqasid’ (the goal of Islam). Incorporated in maqasid is everything that is considered necessary to
preserve and enrich faith, life, intellect, posterity, and wealth.
Measuring bank performance has been a crucial issue in banking research for decades. There
are two mainstream approaches in assessing the performance of banks, namely the financial ratios
approach or accounting ratio approach, and the frontier approach. The financial ratios approach
explores the financial condition of each bank in terms of liquidity, profitability, leverage, and activity
ratios and compares the ratios with the average industry ratios as the benchmarks. Meanwhile, the
5 a best practice frontier. This study will employ the accounting ratio approach cost-to income ratio
(BOPO) as a measure of banks efficiency.
Cost-to-Income ratio is an important indicator for bank managers regarding the financial
strength of their banks. It has never been more important than now for banks to achieve operational
excellence given the range of headwinds they face, ranging from the challenge of regulatory
requirements to the imperative of managing volatility in global financial markets.
The efficient-structure hypothesis emerges from criticism of the
structure-conduct-performance hypothesis (Homma et al, 2012). The efficiency hypothesis postulates that the
relationship between market structure and performance of any firm is defined by the efficiency of the
firm. Firms with superior management or production technologies have lower costs and therefore
higher profits (Al-Muharrami and Matthews, 2009).
This research is going to examine whether the efficiency contributes to bank’s growth., and
see whether the efficient-structure hypothesis (ES hypothesis) holds true for Indonesian Islamic
banks. In doing so, a new test of ES hypothesis proposed by Homma, Tsutsui, and Uchida (2012) will
be applied in this research. The test focuses on a core proposition of the hypothesis, that is : efficient
firms win the competition and grow. In this research the test will be done by directly regress a
measure of firm growth on a measure of bank efficiency.
The quiet-life hypothesis is closely related to the structure-conduct-performance (SCP)
hypothesis. Similar to the ES hypothesis, the SCP hypothesis also predicts a positive relation between
concentration and profits, but through a completely different mechanism. That is why in many studies,
the ES and SCP hypothesis are tested as alternatives to each other, but in theory they might be
compatible, at least in the short-run.
Although the ES hypothesis and the quiet-life hypothesis also have conflicting implications,
like those with the SCP hypothesis, in the short-run their effects might co-exist. So far, the finding
that both the ES hypothesis and the quiet-life hypothesis are supported had only appeared in the
research by Homma et al (2012) who tested these hypotheses to banks in Japan.
The two hypotheses, efficient structure hypothesis and quiet-life hypothesis will be tested by
6 Indonesian Islamic bank efficiency performance, this study employs a frontier approach beside the
accounting based cost-to-income ratio (BOPO) that was mentioned earlier.
3. Methodology
This study uses an unbalanced panel data of Indonesian Islamic banks. The data are obtained
from banks’ annual financial reports, and world banks’ metadata. There are 11 full-fledge Sharia
banks operated in the period of 2003-2014, and the whole population is included.
The analysis presented in this research takes a two-step approach. The first step is to estimate
the efficiency of banks, and the second is to examine how it affects the subsequent growth of the
banks.
3.1 Banks Efficiency Measurement
This research use the cost-to-income ratio (BOPO), as a proxy of operational efficiency.
BOPO ratio reflects the lack of suppress the ability of banks in operational costs which can cause
losses as the bank is less efficient in managing its business. (Bank Indonesia, 2008). Bank Indonesia
confirmed that BOPO ratio above 96% is categorized as inefficient in running its operations. The ratio
is used to measure ability of bank management in controlling operating costs of operating income.
Operating costs are costs incurred by banks in connection with their activities, while operating income
is all forms of income derived from activities of the bank. The smaller BOPO ratio means more
efficient in running their operations, which implies better the condition of a bank, increases investor
confidence in the banking company and will have an effect on their valuation process.
BOPO is calculated using the formula:
BOPO = (Operating expenses / Operating income) annualized.
3.2 Test of the Efficient Structure Hypothesis
This research directly investigates the effect of firm efficiency on firm growth. The main
regression takes the following form :
, = + , + , + , (1)
where the indices i and t respectively represent the firm and the time. The dependent variable is a
7 funds, and equity are used as the firm growth proxy. The term , is the measure for firm
efficiency. This specification assumes that the effect of efficiency is realized with a one-year lag. A
vector of independent variables , consists of control variables such as economic conditions and/or
firm heterogeneity. The final term , is an ordinary error term. We test the ES hypothesis by
examining whether the coefficient for , ( )is positive and significant, because the hypothesis
predicts that efficient firms grow.
For the ES hypothesis, specifications for equation is described below :
ln , = + . , + . ln + . !" + #. $% , + &. ' ( + )*,
(2)
The variable , is the amount of banks This study use four banks performance as
proxies for banks growth. The key independent variable , is a measure of banks’ efficiency. In
this study, the ES hypothesis is supported if is found positive.
Turning now to other explanatory variables used, based on the dependent variable, it is
necessary to control for banks supply and demand. , is real GDP, as a measure of demand. For
supply variables, +, is used, the call rate, which is BI Rate for the most representative interbank
market in Sharia bank Indonesia, and $% , , the capital-asset ratio. Finally, is ' ( , the inflation
rate defined as the rate of change of the GDP deflator. This variable might capture a demand as well
as a supply factor.
3.3 Test of the Quiet-Life Hypothesis
To increase the efficiency of the estimation and to test the quiet-life hypothesis, this study run
a regression with firm efficiency on the left-hand side :
, = - + - $ '$ + - ., + )/, (3)
The dependent variable is the measure of firm efficiency, ., is a vector of control variables,
and )/, is an ordinary error term. The main independent variable is $ '$ , a measure for market
8 The quiet-life hypothesis predicts that there is a positive relationship between market
concentration and firm inefficiency, because of insufficient managerial effort, lack of
profit-maximization behavior, wasteful expenditures to obtain and maintain monopoly power, and/or
survival of inefficient managers, in a more concentrated market (Berger and Hannan, 1998). In this
test, a negative and significant coefficient for - is consistent with this hypothesis.
For equation (3), the QL hypothesis equation, this study use the following specifications :
, = - . + - . 01 + - . %, + -#∙ %, + -&∙ 1 % + )/3, (4)
In these equations, the dependent variable is the measure of bank efficiency , . The key
independent variable is , the market Hirfindahl representing market concentration, which is
calculated using each bank’s nominal amount of financing outstanding. This equation is
simultaneously estimated with equation (2). The quiet-life hypothesis predicts a negative coefficient
for - . To distinguish between market structure and market share, variable Market Share (01) is
employed.
Then, some financial variables also included. Two financial ratios are used to capture the
difference in efficiency levels due to banks’ varying dependence on traditional deposit-to-financing
business models: %, is the ratio of total financing to total assets, and %, is the ratio of total
deposits to total assets. To control for bank risk, we use 1 % , the standard deviation of ROA over
the sample period.
This study simultaneously estimate the regressions (2) and (4). From an econometric
viewpoint, this has the benefit of increasing the efficiency of estimation. However, the simultaneous
estimation has also gives us important economic insight. Most of the existing empirical studies
presume that the ES hypothesis and the SCP hypothesis are alternatives. In actuality, however, both
mechanisms might work simultaneously, at least in the short-run. This approach allows for the two
hypotheses to be supported at the same time, which is the case when we find to be positive and
-to be negative.
9
Table 1 : Descriptive Statistics for Simultaneous Estimation
Variables Definition Source Mean Std Dev Min Max
Efficiency Hypothesis
ᵞ
i.tAsset (in billion) a 12,871 16,700 642 66,942
Financing (in billion) a 9,688 12,642 214 50,460
TPF (in billion) a 10,691 14,334 350 59,821
Equity (in billion) a 1,070 1,102 67 4,937
Efi.t-1 BOPO a 0.874 0.232 0.347 2.156
GDPt Real GDP b 6,027 2,840 2,296 10,543
regression
BIRatet Call rate / BI rate a 0.080 0.020 0.058 0.128
CARi.t capital ratio a 0.167 0.066 0.114 0.315
INFt Inflation rate b 9.555 4.448 4.351 18.150
Quiet-life hypothesis
HIt-1 Hirfindahl index c 0.390 0.094 0.243 0.509
MSi.t Market Share c 0.175 0.188 0.006 0.569
regression
FAi.t Financing / assets c 0.742 0.049 0.647 0.828
DAi.t Deposits / assets c 0.804 0.047 0.728 0.866
SDROAi Std. deviation of ROA c 0.007 0.009 0.000 0.041
Sources : a. Banks annual reports ; b. World bank data ; c data processed.
4. Empirical Results
The analysis presented in this research takes a two-step approach. The first step is to estimate
the efficiency of banks, and the second is to examine how it affects the subsequent growth of the
banks.
4.1. Sharia Bank Efficiency Measurement
Efficiency measurement in this research used data of the period 2003-2013 from 11 Islamic
banks in Indonesia. The number of Islamic banks grows from just two banks in 2003 to eleven banks
at the beginning of 2010. Therefore, this research employed an unbalanced panel data. Unbalanced
10 All data for the study was collected from the end-of-year balance sheets and income
statements for the individual years 2003 to 2013, which are made available on the website of the
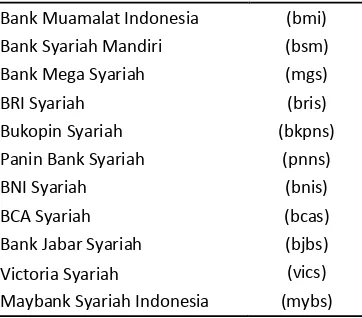
banks. Table 2 shows the list of the banks.
Table 2 : List of Indonesian Islamic Banks
Bank Muamalat Indonesia (bmi) Bank Syariah Mandiri (bsm) Bank Mega Syariah (mgs)
BRI Syariah (bris)
Bukopin Syariah (bkpns) Panin Bank Syariah (pnns)
BNI Syariah (bnis)
BCA Syariah (bcas)
Bank Jabar Syariah (bjbs) Victoria Syariah (vics) Maybank Syariah Indonesia (mybs)
Source : Bank Indonesia
In this research, the accounting-based cost-to-income ratio (BOPO) is used to estimate banks
operational efficiency. The specification in this efficient-structure hypothesis regression form assumes
that the effect of efficiency is realized with a one-year lag.
Bank Indonesia use the cost-to-income ratio (BOPO) as a measurement for banks operational
efficiency. The ratio is used to measure ability of bank management in controlling operating costs of
operating income. The smaller BOPO ratio means more efficient in running their operations, which
implies better the condition of a bank, increases investor confidence in the banking company and will
have an effect on their valuation process.
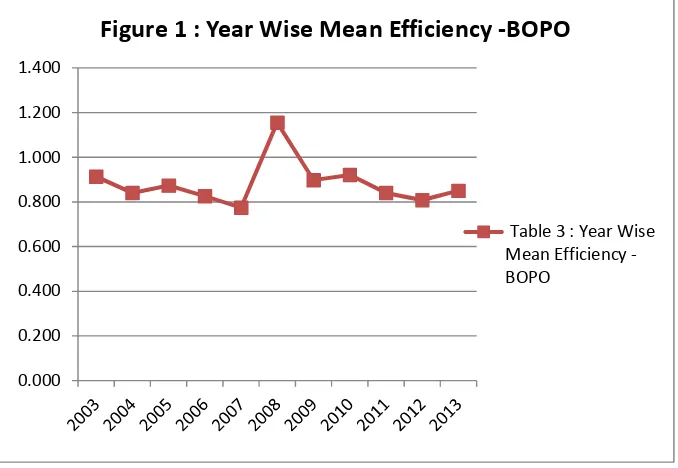
Before turning to the analysis of individual efficiency scores, in this subsection this study
consider the development of the mean efficiency score over the period 2003-2013. The year-wise
11 Table 3 : Year Wise Mean Efficiency - BOPO
Year Mean
BOPO ratio of Indonesia Islamic banks during 2003-2012 shifts fluctuatively. Before 2008,
mean operational efficiency had shown increasing trend, reaching the highest level of efficiency in
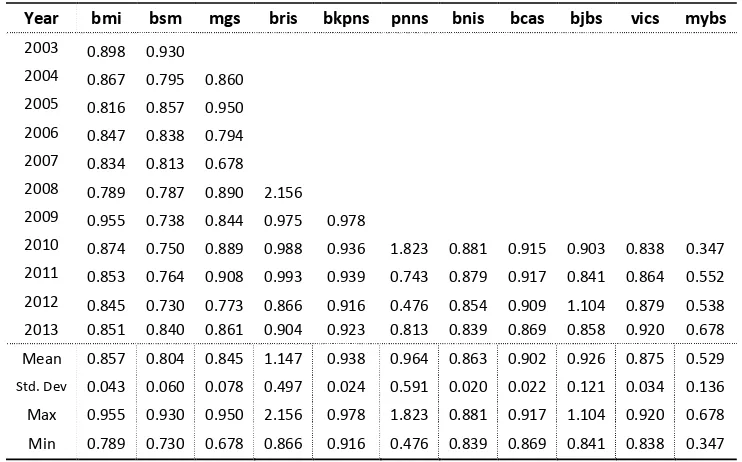
12 The year-wise bank-level operational efficiency (BOPO) of 11 Islamic banks is presented in
Table 4.16 and Figure 4.2.
Table 4 : Year Wise Bank Level Mean Efficiency - BOPO
Year bmi bsm mgs bris bkpns pnns bnis bcas bjbs vics mybs
2003 0.898 0.930
2004 0.867 0.795 0.860
2005 0.816 0.857 0.950
2006 0.847 0.838 0.794
2007 0.834 0.813 0.678
2008 0.789 0.787 0.890 2.156
2009 0.955 0.738 0.844 0.975 0.978
2010 0.874 0.750 0.889 0.988 0.936 1.823 0.881 0.915 0.903 0.838 0.347
2011 0.853 0.764 0.908 0.993 0.939 0.743 0.879 0.917 0.841 0.864 0.552
2012 0.845 0.730 0.773 0.866 0.916 0.476 0.854 0.909 1.104 0.879 0.538
2013 0.851 0.840 0.861 0.904 0.923 0.813 0.839 0.869 0.858 0.920 0.678
Mean 0.857 0.804 0.845 1.147 0.938 0.964 0.863 0.902 0.926 0.875 0.529
Std. Dev 0.043 0.060 0.078 0.497 0.024 0.591 0.020 0.022 0.121 0.034 0.136
Max 0.955 0.930 0.950 2.156 0.978 1.823 0.881 0.917 1.104 0.920 0.678
Min 0.789 0.730 0.678 0.866 0.916 0.476 0.839 0.869 0.841 0.838 0.347
Source : BI-Islamic Banking Statistics
The average BOPO ratio of Indonesian Islamic banks ranges from 119,5%, to 47,9% with a
variation of 0,4% to 71,3% in standard deviation. It is also revealed that based on BOPO ratio,
Maybank Syariah is the most efficient bank, while BRI Syariah is the most in-efficient bank.
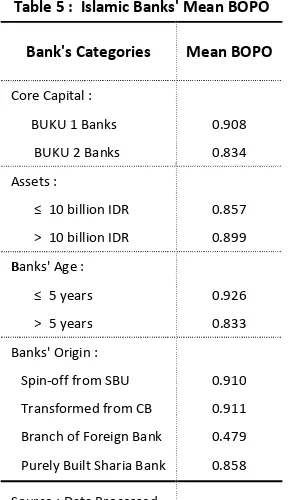
13 Table 5 : Islamic Banks' Mean BOPO
Bank's Categories Mean BOPO
Core Capital :
BUKU 1 Banks 0.908
BUKU 2 Banks 0.834
Assets :
≤ 10 billion IDR 0.857
˃ 10 billion IDR 0.899
Banks' Age :
≤ 5 years 0.926
> 5 years 0.833
Banks' Origin :
Spin-off from SBU 0.910
Transformed from CB 0.911
Branch of Foreign Bank 0.479
Purely Built Sharia Bank 0.858
Source : Data Processed
Bank’s Core Capital
To improve banks efficiency, Bank Indonesia has held benchmark BOPO ratio for
commercial banks business groups : BUKU 1 at maximum of 85%, BUKU 2 in the range of 78% -
80%, BUKU 3 70% - 75%, and BUKU 4 60% - 65% (IFSA, 2013). Currently, according to BAON
Regulation, there are 8 Islamic banks in BUKU 1 category : Bank Mega Syariah, BRI Syariah,
Bukopin Syariah, Panin Syariah, BCA Syariah, bjb Syariah, Victoria Syariah, and maybank
Syariah. Only 3 Indonesian Islamic banks that are in BUKU 2 category : Bank Muamalat Indonesia
(BMI), Bank Syariah Mandiri (BSM), and BNI Syariah. Bank Indonesia also confirmed that BOPO
ratio above 96% is categorized as inefficient in running its operations.
Empirical results resume in table 5 show that BUKU 2 Islamic banks are more efficient
than Islamic banks in BUKU 1 category..
Bank’s Assets
In this study, bank’s assets is used as a proxy of bank’s size. academic research by
Hughes and Mester (2011) has found evidence of scale economies in banking, a large bank could
14 Referring to table 5, average BOPO ratio of larger banks are slightly higher than average
BOPO ratio of smaller banks, or equivalently, lower efficiency. This result might be explained by
referring to the fact that larger Islamic banks have been doing aggressive investments in recent
years, which also increase the non-interest expenses. Kovner et al. (2014) found an inverse
relationship between bank’s size and interest expense ratio for the main components of
non-interest expense : employee compensation, premises and fixed-assets expenses, and other nonnon-interest
expense, but they also found that larger banks spend proportionately moreon consulting and advisory
services than smaller firms, relative to revenue or assets, and incur proportionately higher expenses
related to amortization and impairment of goodwill and other intangible assets.
Bank’s Age
Bank Age is assessed by the number of years the bank has been in operation. Mester (1996)
stated that, according to learning by doing hypothesis, the older the bank, the more experience they
have, therefore the bank could better manage their operations and might become more efficient. A
positive relationship with efficiency might also suggest that more efficient banks are more likely to
survive.
As shown in table 7, on average, Islamic banks that have been in operation more than five
years were found to be more efficient than the Islamic banks with the age of five years or less. The
results confirmed Mester (1996) which found that inefficient banks tend to be younger in her study of
214 third district banks. On the other hand, Isik and Hassan (2003) found insignificant negative
relationship between the bank’s age and efficiency.
Bank’s Origin
Indonesian Islamic banks were formed from different kinds of origin. The only Islamic banks
that was built as Islamic banks from the beginning is Bank Muamalat Indonesia (bmi). Seven of the
Islamic banks were originally conventional banks that were transformed into Islamic banks by the
parent company, Bank Syariah Mandiri (bsm), Mega Syariah Bank (mgs), BRI Syariah (bris),
Bukopin Syariah (bkpns), Panin Syariah (pnns), BCA Syariah (bcas), and Victoria Syariah (vics).
15 conventional banks that were spun off to be full-fledge Islamic banks. Maybank Syariah is considered
foreign banks since its home base is located in Malaysia.
As table 7 suggested, based on average BOPO ratio, foreign Islamic bank had the lowest
score which mean it’s the most operationally efficient Islamic bank. While the Islamic banks that
were transformed from conventional banks (CB) had the highest average BOPO ratio, meaning the
least operationally efficient.
From the efficiency estimation results, this study conclude that banks with more capital,
larger-sized banks, and the older banks are tend to be more efficient than their counterparts which
have fewer capital, smaller in assets size, and the newer banks. This study also found that the only
foreign Islamic bank in this study is the most efficient bank .While the purely built Islamic bank was
founded to be the most cost efficient bank. Islamic banks that were transformed from conventional
banks had the lowest operational efficiency score.
4.2.2 Test of the Efficient Structure Hypothesis
Before proceeding to an OLS regression, it was necessary to undertake a series of tests for the
acceptance or rejection of some hypotheses which would allow the application of such a technique.
For multicollinearity test, in a panel data, it is assumed that there is no multicollinearity problem. The
logic is that since multicollinearity is only about independent variable there is no need to control for
individual effects using panel methods (Rfan, 2013).
According to Ul-Haq (researchgate.net, 2012), the problem of heteroskedasticity is not a
problem when work with panel data, because panel data is it self a solution of heteroskedasticity. If
researchers want to overcame or doubt about heteroskedasticity, they can take log of all the data set
and verify the results. It can be seen that the results with and without logarithm of data set will very
close to each other.
The autocorrelation of errors is also assessed. In the case of a presence of error
autocorrelation, the OLS estimator is not skewed but it is not efficient. Correction of this type of
problem is done through a GLS estimator. It is the application of the Durbin-Watson test which would
16 problem does not exist, however, for a value close to zero or 4, autocorrelation is respectively positive
or negative.
The regressions were done through Eviews 7 software.
At first, the appropriate model of panel data analysis should be chosen whether it is Pooled
Least Square model, Fixed Effect model or Random Effect model. Table 6 show that Likelihood-Test
and Haussman-Test of all regression that applying different eficiency measurement gave the same
indication that Fixed Effect model should be used to analyze the data.
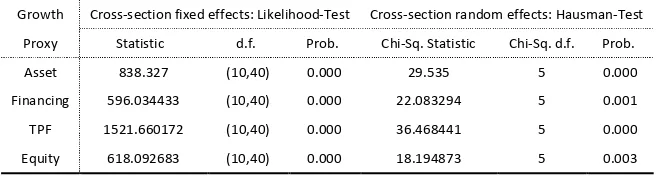
Tabel 6 Fixed / Random Effects Testing ES Hypothesis Regression
Growth Cross-section fixed effects: Likelihood-Test Cross-section random effects: Hausman-Test
Proxy Statistic d.f. Prob. Chi-Sq. Statistic Chi-Sq. d.f. Prob.
Asset 838.327 (10,40) 0.000 29.535 5 0.000
Financing 596.034433 (10,40) 0.000 22.083294 5 0.001
TPF 1521.660172 (10,40) 0.000 36.468441 5 0.000
Equity 618.092683 (10,40) 0.000 18.194873 5 0.003
Source : Data Observed
The Likelihood-Test for all regressions show clearly rejection of the null hypothesis (p-value
< 0.05), suggested that the Fixed Effects model is a better choice than the Pooled Least Square
model. To decide between fixed or random effects, Hausman-tests were employed, where the null
hypothesis is that the preferred model is random effects vs. the alternative the fixed effects (Greene,
2008). As suggested in Table 4.36, the null hypothesis were rejected (p-value < 0.05) in favor of the
Fixed Effects model.
The estimation results where banks efficiency‘s tested to each proxy of growth which were
used in this study. are shown in Table 7. The ES hypothesis regression with BOPO ratio as the main
independent variable, significant and negative γ₁ is expected. The estimatios in done through GLS
estimation in order to deal with heteroskedasticity and autocorrelation problem.
This test directly investigates the effect of firm efficiency on firm growth In the first
regression to test the ES hypothesis, total asset is used as a proxy for banks growth.
45 67,8= 9: + 9; . <=7,8 ;+ 9>. 45 6?@8+ 9A. BCDE8F8+ 9G. HIJ7,8+ 9K. CL=M8+ N7,8M
The variable 67,8 is the growth proxy of the Islamic banks. The key independent variable
17 The explanatory variables used in this study are the real GDP, BI rate, individual bank’s CAR, and
inflation rate, defined as the rate of change of the GDP deflator.
Table 7 : ES Hypothesis Regression Result
Parameters Dependent Variable
Log (Assets) Log (Financing) Log (TPF) Log (Equity)
Intercept -11,079 *** -11,423 *** -11.605 *** -13,266 ***
(-18,7405) (-18,99484) (-26.16278) (-19,16432)
γ₁ -0,523 *** -0,358 *** -0.651 *** -0,366 ***
(-7,006633) (-3,864995) (-11.7078) (-11,12347)
γ₂ 1,549 *** 1,547 *** 1.592 *** 1,461 ***
(24,80136) (23,95384) (31.96436) (19,07320)
γ₃ 1,919 * 2,795 *** 2.853 *** 3,489 **
(2,32243) (4,007595) (7.437112) (3,194502)
γ₄ -0,438 * -1,170 *** -0.804 *** 1,979 ***
(-2,431096) (-5,65254) (-6.321765) (12,02941)
γ₅ -0,030 *** -0,034 *** -0.030 *** -0,033 ***
(-5,897052) (-7,585741) (-14.80836) (-4,589386)
Signif. codes: 0 ‘***’ 0.001 ‘**’ 0.01 ‘*’ 0.05 ‘.’ 0.1 ‘ ’ 1
t-Statistic in parenthesis
As indicated in table 7, all the parameters in the ES Hypothesis equation are significant. The
result showed that BOPO ratio have negatively significant influence on all proxies of banks growth. It
means that efficient banks become larger. This finding clearly lends support to the ES hypothesis.
The result suggested that the operational efficiency of the Islamic banks in Indonesia
significantly affects the subsequent growth of the banks. Therefore, it is crucial for the Islamic banks
to improve the efficiency in order to be more resilient and achieve sustainable growth.
4.2.3 Test of the Quiet-Life Hypothesis
Next this study will make further analysis on the impact of market concentration on Sharia
banks efficiency. Berger and Hannan (1997) suggested that efficiency will get worse since the
company in a high concentrated industry enjoy its market power to gain supernormal profit. This is
known as quiet life condition, where there is no more incentive for company to minimize cost since
they are in a kind of comfort zone where supernormal profit is the main objective of the banks.
For the quiet-life hypothesis equation, following specification is used :
18 In the equations, the dependent variable is the measure of efficiency , , (BOPO). The key
independent variable is , the market Hirfindahl representing market concentration. 01.
represents market share, %, is the ratio of total financing to total assets, and %, is the ratio of
total third party funds to total assets. To control for bank risk, 1 % is used, the standard deviation
of ROA over the sample period.
The quiet-life hypothesis predicts positive and significant - for BOPO ratio measurement.
Table 8 presents the Likelihood-Test and Haussman-Test to determine approriate model for
the quiet-life hypothesis test.
Tabel 8 : Fixed / Random Effects Testing - Quiet Life Hypothesis
Cross-section fixed effects: Likelihood-Test Cross-section random effects: Hausman-Test
Statistic d.f. Prob. Chi-Sq.
Statistic Chi-Sq. d.f. Prob.
2.714182 (10,40) 0.0121 27.876697 5 0.000
Source : Data Observed
The Likelihood-test for all regressions show clearly rejection of the null hypothesis (p-value <
0.05), suggested that the Fixed Effects model is a better choice than the Pooled Least Square model.
And the Hausman-tests also rejected the null hypothesis (p-value < 0.05) in favor of the Fixed Effects
model. Table 9 presents the regression result of the quiet-life hypothesis.
Table 9 : QL Hypothesis Regression Result
19 As shown in table 9, all the parameters in the equation are significant. The result showed that
market concentration have positively significant influence on the BOPO ratio. It means that the
increase in market concentration, will decrease the banks efficiency. This finding lends support to the
quiet-life hypothesis.
5. Conclusions, Implication and Limitation
5.1 Conclusions
The results support both the efficient-structure hypothesis and the quiet-life hypothesis. As
stated by Homma et al (2012), these findings are intriguing from an economic point of view. The
finding for the ES hypothesis implies that efficient banks grow more. However, if the Islamic banking
market becomes more concentrated, the finding for the quiet-life hypothesis then implies that the
banks will lose efficiency. As the banks become more inefficient, then the banks grow less.
5.2 Implications
Findings in this study showed that banks with larger size and have more core capital are more
efficient. Referring to the ES hypothesis, efficient firm will grow and win the competition. Based on
that, it’s necessary for Indonesian Islamic banking industry to develop larger and stronger Islamic
bank in order to boost the banks competitivenes in facing the upcoming competition from the the
establishment and implementation of the ASEAN Economic Community (AEC).
The Indonesian Islamic banks will certainly be influenced by the AEC. There is a big concern
that Indonesian Islamic banking industry would not be able to compete with other ASEAN countries
by the time the AEC is launched. It comes from the fact that Indonesian Islamic banks have smaller
capitals and lower competitiveness compared to a number of banks in neighboring countries in
Southeast Asia.
The Financial Services Authority (OJK) expects to see the establishment of a state Sharia
bank by 2017 at the latest, as revealed in its Sharia banking road map. In the road map, launched on
June 13, 2015 , the OJK has established a timeline that runs from 2015 until 2017 for the creation of
20 So far, the Indonesian government had come with several options to strengthen domestic
Islamic banks capital and improve its efficiency.
The first option is to to convert a state-owned bank from a conventional bank to an Islamic
bank. This option was suggested by the National Syariah Council, Bank Indonesia and a number of
economists (ANTARA News, 4/2/2013). The choice for the conversion can fall on the state-owned
Bank BRI or Bank BTN so that it would later 100 percent become an Islamic bank, no longer a
conventional bank. The conversion of a conventional state-owned bank into a state-owned Islamic
baks will have significant impact on the domestic Islamic market..
The second option, as mentioned by OJK chairman Muliaman D. Hadad (The Jakarta Post,
6/15/2015), is to spin off existing Islamic lenders from the (state banks) parent companies and to
merge them into one. The state lenders will have stakes in the new entity and it is also expected that
the government will place a certain amount of funds as capital due to the entity’s status of a state
bank.
The OJK also encourages Sharia banks in Indonesia, particularly Sharia-compliant units of
regional development banks, to consolidate, while it is also preparing to revitalize these regional
development banks in an effort to create a huge Islamic bank.
Such a merger among existing Islamic banks would reduce operating costs and make it
possible to offer more competitive rates. Other options include the strengthening of capital of both
state-controlled and private Islamic banks (Indonesia-Investment News, 3/19/2015).
5.3 Limitations
This study is limited on the relationship between efficiency and growth of Indonesian Islamic
21 References
Affandi, N.M (2002), Islam and Business, Subang Jaya : Pelanduk Publications (M) Sdn. Bhd.
Alamsyah, Halim (2012), ), Perkembangan dan Prospek Perbankan Syariah Indonesia: Tantangan Dalam Menyongsong MEA 2015, Disampaikan dalam Ceramah Ilmiah Ikatan Ahli Ekonomi Islam (IAEI), Milad ke-8 IAEI, 13 April 2012.
Al-Muharrami, Saeed., and Kent Matthews (2009), Market Power versus
Efficient-Structure in Arab GCC Banking, Cardiff Economics Working Papers, Cardiff
University, United Kingdom.
Berger, A. N., and T. H. Hannan (1998), The Efficiency Cost of Market Power in Banking Industry: A Test of the "Quiet Life" and Related Hypothesis, Review of Economics and Statistics, pp454-465.
General Council for Islamic Banks and Financial Institutions (CIBAFI) (2006), CIBAFI
Performance Indicators, Retrieved on April 1st 2009 from http:
//www.cibafi.org/engcorporat/CouncilAchive.aspx?Page=2.
Global Business Guide Indonesia (2012), Making the Banks Work for the Real Economy, Available at www.gbgindonesia.com(accessed on March 21, 2014).
Homma, Tetsushi., Tsutsui Yoshiro, and Uchida Hirofumi (2012), Firm Growth and Efficiency In Banking Industry A New Test of The Efficient Structure Hypothesis, RIETI Discussion Paper Series 12-E-060, The Research Institute of Economy, Trade and Industry, http://www.rieti.go.jp/en/(accessed on October 5, 2013).
Hughes, Joseph P., and Loretta J. Mester (2011), Who Said Large Banks Don’t Experience Scale Economies? Evidence from a Risk-Return-Driven Cost Function, Paper, Finance Department, The Wharton School, University of Pennsylvania.
Hussein, Khaled. A (2002), Operational Efficiency in Islamic Banking : The Sudanese Experience, Islamic Research and Training Institute, Islamic Development Bank, available at http://citeseerx.ist.psu.edu (accessed on October 12, 2015).
Indonesian Financial Services Association (2013), Pursue Efficiency, BI BOPO Limit Maximum 85%, available at http://www.ifsa.or.id/posting/detail_en/430 (accessed on December 3, 2014).
Isik, I., and Hassan, M. Kabir (2002), Technical, Scale and Allocative Efficiencies of
Turkish Banking Industry, Journal of Banking and Finance26, 719-66.
Kovner, Anna., James Vickery, and Lily Zhou (2014), Do Big Banks Have Lower
Operating Costs?, Blog, Liberty Street Economics, Federal Reserve Bank of New
York.
Mester, L. J. (1996), A Study of Bank Efficiency Taking into Account Risk-Preferences, Journal of Banking and Finance, 20, 1025-1045.