Full Terms & Conditions of access and use can be found at
http://www.tandfonline.com/action/journalInformation?journalCode=cbie20
Bulletin of Indonesian Economic Studies
ISSN: 0007-4918 (Print) 1472-7234 (Online) Journal homepage: http://www.tandfonline.com/loi/cbie20
Survey of Recent Developments
Yose R. Damuri & Creina Day
To cite this article: Yose R. Damuri & Creina Day (2015) Survey of Recent Developments, Bulletin of Indonesian Economic Studies, 51:1, 3-27, DOI: 10.1080/00074918.2015.1016565
To link to this article: http://dx.doi.org/10.1080/00074918.2015.1016565
Published online: 30 Mar 2015.
Submit your article to this journal
Article views: 327
View related articles
ISSN 0007-4918 print/ISSN 1472-7234 online/15/0003-25 © 2015 Indonesia Project ANU http://dx.doi.org/10.1080/00074918.2015.1016565
* We thank interviewees in Jakarta for their generous insights and time, and members of the Indonesia Study Group at The Australian National University, in Canberra, for their help-ful comments. All interviews were conducted in conidentiality, unless otherwise speciied.
SURVEY OF RECENT DEVELOPMENTS
Yose R. Damuri* Creina Day*
Centre for Strategic and International Studies, The Australian National University Jakarta
SUMMARY
Amid global economic uncertainty and tumbling world oil prices, Indonesia’s economy faces pressure on its external balance and a continued growth slowdown. The government of President Joko Widodo (widely known as Jokowi) has set an agenda of reform, includ-ing simpler, faster investment licensinclud-ing, historic cuts to fuel subsidies to generate iscal savings, and increased spending on infrastructure. On the political side, Jokowi has had to deal with several political issues coming not only from parties in opposition but also from parties supporting his government, including during the formation of the new cabinet. We examine the consequences so far of the government’s policy initiatives and of the policy-making process. While some initiatives have been implemented with success, some seem to have been launched without enough preparation, consultation, or empirical evidence, and many have been poorly communicated. Although inlation accelerated after the November fuel-price rise, efforts have been made to contain inlationary expectations and to mitigate the effects on poverty through social-assistance programs. The government took steps to cushion the impending impacts of higher fuel prices on vulnerable households by giving cash handouts of Rp 200,000 per month to 15.5 million disadvantaged families who receive the lowest level of welfare, and by promoting publicly funded education and health care. The partial removal of gasoline subsidies and the introduction of a ixed-subsidy policy for diesel in the revised 2015 budget reduce uncertainty about the iscal position, although increases in government spending in infrastructure development were announced at the same time. The revised budget for 2015 increases spending on infrastructure development by 63% from the 2014 budget, mostly on projects to improve connectivity on land and at sea—such as the development of toll roads, railways, and ports—and to increase the performance of the agricultural sector. However, the recent drop in international oil prices forced the government to increase its target for tax revenue by 30% on last year’s target, raising concerns about the effect of falling oil prices on the economy. Trade and investment policy reform is important in unlocking Indonesia’s growth potential and improving the country’s current external balance. Jokowi’s administration, however, has been sending mixed signals about its position towards more open policies. The country has yet to recom-mence several trade negotiations that were postponed in 2014 and is still struggling to meet its commitments under the ASEAN Economic Community. Although improvement in investment procedures and licensing is currently underway, Indonesia needs to adopt a more positive attitude if it is to attract more investment.
4 Yose R. Damuri and Creina Day
POLITICAL DEVELOPMENTS
During the irst 100 days of Joko Widodo’s (Jokowi’s) presidency, he faced two sources of political pressure. The irst came from his own supporting-party coali-tion and was obvious during the formacoali-tion of the cabinet. Selecting cabinet mem-bers took more than a week and suffered several postponements: the president had invited the Corruption Eradication Commission (Komisi Pemberantasan Korupsi [KPK]) and the Financial Transaction Reports and Analysis Center (Pusat Pelaporan dan Analisis Transaksi Keuangan) to assess whether the candidates had records of corruption or had made irregular inancial transactions. On the basis of information from the two agencies, eight candidates had to be reconsid-ered; they had been lagged red or yellow, depending on their perceived level of corruption risk (Jakarta Post, 24 Oct. 2014). It is unclear who those eight individu-als were, or whether any of them are part of the new cabinet. However, the KPK said that none of the current cabinet members are involved in corrupt activities or vulnerable to graft investigations (Jakarta Post, 27 Oct. 2014).
The involvement of anti-corruption agencies in the formation of the cabinet fuelled speculation about intense political-party engagement within the new president’s coalition. In order to handle the internal pressure, Jokowi listened to suggestions from those agencies and eliminated problematic candidates. Internal pressure was again assumed to be behind the appointment of H. M. Prasetyo, a supporting-party cadre, as attorney general and the nomination of General Budi Gunawan, a former Megawati aide, as chief of police. Gunawan’s nomination was controversial, owing to his being named as a bribery suspect by the KPK a couple of days after his name was given to parliament. Jokowi later postponed, and then cancelled, Gunawan’s appointment, presumably giving in both to public demand and to pressure from his supporting parties (Wall Street Journal, 18 Feb. 2015). These decisions raised concerns about the president’s ability to handle internal conlict and to be independent of the inluence of his supporting parties when making deci-sions, including on economic issues. Such internal political tension may also dis-tract the government from implementing its economic program and other reforms. The second source of political pressure on Jokowi was his government’s rela-tionship with parliament. As a result of the 2014 legislative elections, no one party occupies a majority of the seats; a number of factions are potentially not aligned with the Great Indonesia Coalition (Koalisi Indonesia Hebat), the group of parties supporting Jokowi. Around 63% of legislative seats are occupied by opposition parties, which formed the Red-and-White Coalition (Koalisi Merah Putih [KMP]).1 The KMP’s majority is likely to pose signiicant challenges for the new adminis-tration in carrying out its intended programs and reforms. The KMP also secured all the leadership positions in the Indonesian People’s Representative Council (Dewan Perwakilan Rakyat) and the People’s Consultative Assembly (Majelis Per-musyawaratan Rakyat), leaving no positions on the board for members of Jokowi’s
camp. These results have put the Jokowi administration in a precarious position, as legislative decisions in parliament could potentially disrupt government actions.
However, recent developments suggest that Jokowi may be able to contain con-lict with parliament. First, some KMP member parties are due to elect new lead-ers and change their political direction. Some have already done so. In late 2014, Golkar and the United Development Party (Partai Persatuan Pembangunan) each held their national congress to elect new leaders. Both congresses caused party splits. Two factions of Golkar, one led by the incumbent chair, Aburizal Bakrie, and the other by the deputy chair, Agung Laksono, who wants Golkar to leave the KMP, declared themselves to have legal authority in the party. At the time of writ-ing, the battle continues. Jokowi and his coalition could potentially beneit from this situation by diverting KMP members from policy-making.
Second, these coalitions might not be as solid as predicted, especially the KMP. The Democratic Party, led by former president Yudhoyono, was the irst coalition member to declare a different political direction from that of the KMP, by sup-porting the presidential decree on direct regional elections.2 Members of the KMP had initially objected to this decree and had planned to reject direct elections. But, one by one, coalition members changed their political direction and supported the regulation. This suggests that coalition members may be willing to support the government’s program if their political interests can be accommodated. In another example, members of the KMP unanimously endorsed the president’s proposal to appoint General Gunawan as chief of police. This raises the suspicion that the appointment might have beneited opposition parties, whether by weak-ening anti-corruption efforts or by simply disrupting the government’s activities and the president’s relationship with his supporting parties.
Jokowi’s irst 100 days also saw many of his cabinet members take controver-sial actions. The minister of maritime affairs and isheries, Susi Pudjiastuti, domi-nated the media by deciding to sink several vessels from neighbouring countries after they were seized for ishing illegally in Indonesian waters. She also intro-duced a ban on catching young crustaceans, while on another occasion released a policy prohibiting the transfer of ish from smaller to larger vessels at sea, to curb illegal ishing (Jakarta Post, 27 Jan. 2015). Her hard-line stance has met with oppo-sition, and not only from neighbouring countries; many at home see these policies hurting the country’s ishing industry and possibly reducing isheries production. Other controversial policies came from the minister of transportation, who set minimum prices for airline tickets and disallowed low-cost carriers from issuing discounted, promotional airfares, and from the minister of trade, whose ban on selling light alcoholic beverages, such as beer, in convenience stores throughout Indonesia drew protests (especially from the tourism industry).
Most of these policies and regulations were not communicated well to the pub-lic, involved no consultation with stakeholders, and had no empirical evidence
6 Yose R. Damuri and Creina Day
to support them. This seems to be quite common in the Jokowi administration, including in speeches from the president himself. On many occasions, such as during the East Asia Summit, Jokowi has explained his vision for Indonesia as a ‘global maritime axis’ and emphasised the importance of the maritime sector to the country (Jakarta Post, 13 Nov. 2015). However, except for several references to the development and rehabilitation of 24 ports across Indonesia (Jakarta Post, 30 Oct. 2015), there is no comprehensive plan for how Indonesia will build its mari-time strength. Nor is there empirical support to explain how this marimari-time policy will beneit Indonesia’s economic development.
Jokowi’s plan to speed up infrastructure development (Jakarta Post, 23 Feb. 2015) has similar shortcomings. While the plan has been described in some detail in the National Medium-Term Development Plan (Rencana Pembangunan Jangka Menengah Nasional) 2015–2019, there is no visible strategy for tackling the two most pressing issues of infrastructure development: land acquisition and inanc-ing (see, for example, World Bank 2014b, 81–95). Indonesia has a legal frame-work for acquiring land for public infrastructure—for example, Law 2/2012 on the Acquisition of Land for Development in the Public Interest, and its related implementing regulations—but it needs signiicant improvement. Jokowi, in the APEC CEO Summit, cited an example from when he was the governor of Jakarta: the construction of a section of the Jakarta toll road had been halted for eight years owing to the government’s inability to acquire the land; construction continued after Jokowi met with the 143 families who had refused to accept compensation (Jakarta Post, 11 Nov. 2014). This approach may not be as effective at the national level, considering that it will be dificult for the president to personally solve all land-acquisition problems blocking infrastructure development.
Infrastructure development during 2015–19 will require Rp 5,500 trillion, only part of which will come from the government budget (Rakyat Merdeka, 11 Feb. 2015; see ‘Revised Budget for 2015’, below). The gap is expected to be illed by the private sector through public–private partnerships. The legal and institutional framework for such partnerships has been established, but their implementation is still constrained by various problems—including the lack of capacity of govern-ment agencies to prepare and assess projects, and the degree to which private part-ners are able to set the prices of related services (cf. Armstrong and Rahardja 2014, 23–24). The government is currently reviewing Presidential Regulation 67/2005 on Private Sector Participation in Infrastructure Provision, which will supposedly provide more certainty for the private sector. However, the head of Bappenas, the National Development Planning Agency, worried that the revised regulation may create a public–private partnerships scheme that weakens the state’s control over infrastructure (Antara News, 12 Feb. 2015). This raises questions about the serious-ness of the government in attracting greater involvement from the private sector and is another example of the mixed signals that the Jokowi administration has delivered in various economic policies and programs.
MACROECONOMIC DEVELOPMENTS Economic Growth
of 2014; in December, the rupiah reached its lowest level against the dollar in 16 years. International prices of key export commodities continued to soften, ham-pering Indonesia’s export performance. The prices of these commodities declined again towards the end of 2014, falling further from their highs of early 2011. Between the third and fourth quarters, in US-dollar terms, the price of rubber fell by 11.9%, coal by 8.5%, Indonesian natural gas in Japan by 7.3%, crude palm oil by 6.1%, and copper by 5.2% (IMF 2015). Crude-oil prices fell steeply between June and December to six-year lows, providing welcome support for Indonesia’s terms of trade as a net oil importer, but the beneit was partially offset by the falls in the export values of other commodities (and falling oil prices may have negative consequences for oil and gas exports and related revenues).
The government implemented structural reforms, reducing gasoline subsidies in November 2014 and moving to scheduled monthly gasoline price adjustments in January 2015. Both reforms seek to free funds for more productive spending. Bank Indonesia (BI), the central bank, has maintained a higher benchmark inter-est rate since November, in an effort to contain inlationary expectations stem-ming from the November fuel-price rise and to safeguard inancial stability at the expense of higher economic growth in the short term.
GDP grew by 5.0% in 2014, down noticeably from 5.6% in 2013 and below the government’s target of 5.5%.3 In the third and fourth quarters of 2014, GDP grew (year on year) by 4.9% and 5.0%, respectively, a decline from 5.5% and 5.6% in the same quarters in 2013 (table 1). The continued slowdown in GDP growth in the last two quarters relects modest growth in investment and limited government consumption due to tighter iscal policy.
Economic growth in the fourth quarter was supported by solid growth in pri-vate consumption. Growth in real pripri-vate consumption in the third and fourth quarters held up at 5.1% and 5.0%, respectively. The November 2014 increase in subsidised fuel prices was quickly reversed in January 2015 (see ‘Fuel-Subsidy Reform’, below) and was expected to have only a limited negative effect on pri-vate consumption in the fourth quarter.
Although consumption is holding up, price pressures may have contributed to a slight slowdown in the fourth quarter. Following the November fuel-price rise, BI’s consumer conidence index fell by 3.6 points between November and December, to 116.5 (BI 2014a). However, the drop in consumer conidence was smaller than that witnessed during the previous fuel-price rise, in June 2013.4 Moreover, the index rebounded by 3.7 points in January 2015, to 120.2. Consumer perception of overall economic conditions may have remained positive owing to expectations that price pressures would subside and to appreciation for the fact that the new fuel-subsidy scheme facilitates increased spending on infrastructure development, for example. Retail sales in December 2014 grew by 4.3% year on year, compared with 28.2% year on year in December 2013. The slowdown in
3. In February 2015, Badan Pusat Statistik (BPS), Indonesia’s central statistics agency, of-icially launched a new base year for measuring GDP, changing from 2000 to 2010 (see Sienaert 2015). Table 1 presents GDP growth measured against the new 2010 base year, which is likely to report rates 0.2–0.3 percentage points lower than those that use 2000 as the base year (see Allford and Soejachmoen 2013, box 1). BPS also uses different sectoral classiications for the new series.
8 Yose R. Damuri and Creina Day
retail sales growth relected softening consumer demand and the dificulty of dis-tributing goods during the monsoon season (BI 2014b).
Growth in government consumption, which in principle excludes transfers and government investment, is typically strongest in the third and fourth quarters (see, for example, Armstrong and Rahardja 2014, table 1), owing to higher budget exe-cution rates in the second half of each year. However, government consumption in the fourth quarter of 2014 was weak, as budget cuts took effect (see ‘Fiscal Policy’, below).
TABLE 1 Components of GDP Growth, 2013–14 (2010 prices; % year on year)
2013 2014
Q1 Q2 Q3 Q4 Q1 Q2 Q3 Q4
GDP 5.6 5.6 5.5 5.6 5.1 5.0 4.9 5.0
By expenditure
Private consumption 5.5 5.2 5.4 5.4 5.4 5.1 5.1 5.0
Government consumption 3.0 3.2 12.4 7.9 6.1 –1.5 1.3 2.8
Investment 7.9 5.5 6.0 2.1 4.7 3.7 3.9 4.3
Structures 8.0 8.0 7.2 4.0 5.5 4.9 4.5 7.1
Machinery & equipment 3.9 –1.6 –2.4 1.8 –2.7 –0.8 –5.7 –9.1
Vehicles 1.8 –0.1 –2.9 –19.2 –6.3 –10.7 –10.0 –7.4
Other 13.5 2.1 11.7 5.0 12.6 9.7 15.9 6.6
Exports 3.5 2.1 1.3 9.4 3.2 1.4 4.9 –4.5
Imports 2.9 0.9 4.9 –0.9 5.0 0.4 0.3 3.2
By sector
Tradables 3.7 4.1 3.4 4.0 3.3 4.1 3.7 3.4
Agriculture, livestock, forestry, &
isheries 4.2 4.6 3.5 4.6 5.3 5.0 3.6 2.8
Mining & quarrying 0.9 0.7 2.7 2.7 –2.0 1.1 0.8 2.2
Manufacturing 4.7 5.4 3.7 4.2 4.5 4.8 5.0 4.2
Excluding oil & gas 6.1 6.5 4.5 4.8 5.5 5.6 5.7 5.6
Non–tradables 6.4 6.1 6.7 6.5 6.4 5.9 5.9 6.6
Electricity, gas, & water supply 9.3 4.6 2.6 4.4 3.3 6.2 5.7 6.2
Construction 5.4 6.3 6.5 6.2 7.2 6.5 6.5 7.7
Trade, hotels, & restaurants 3.7 5.2 5.2 6.1 6.2 5.3 5.0 3.7 Transport & storage 7.4 8.9 8.3 8.9 8.4 8.5 8.0 7.1 Communication 10.6 11.4 10.1 9.5 9.8 10.5 9.8 10.0 Financial, rental, & business services 10.6 9.1 7.6 4.6 5.0 5.9 4.2 8.3
Other services 6.1 1.7 7.3 7.2 5.1 3.3 6.1 7.1
Source: CEIC Asia Database.
Note: In February 2015, BPS changed to a base year of 2010 for measuring GDP in constant prices, and did so retrospectively to 2010. It also changed the methodologies for calculating GDP, to make them
Growth in gross ixed capital formation (GFCF) continued to moderate throughout 2014 into the fourth quarter, consistent with a downward trend in ixed investment growth over the last two years. Investment growth, in 2010 prices, slowed to 4.0% in 2014 and 5.0% in 2013, compared with 9.0% in 2011 and 2012. GFCF grew by 4.3% year on year in the fourth quarter. Investment in structures remains the main driver of ixed investment growth. Higher interest rates (see ‘Inlation, Interest Rates, and the Exchange Rate’, below) may have also weighed down investment growth in the fourth quarter. There is cautious optimism that GDP growth will pick up gradually as investment growth recov-ers (see box 1, for example).
The contribution of net exports to GDP growth was negative, but negligible, in the fourth quarter. Exports declined by 4.5% year on year in the quarter, owing to weaker demand and low international commodity prices. Imports rose by 3.2%, increasing substantially from the previous quarter, owing to rising domestic demand.
On the production side, the growth slowdown is evident across the tradable and non-tradable sectors. Manufacturing growth continued to weaken, falling to 4.2% in the fourth quarter. Looking forward, a recent Economist Intelligence Unit survey of 75 foreign-owned manufacturers in Southeast Asia showed that Indonesia is likely to attract more new factories than any other Southeast Asian economy over the next few years. Together, the surveyed manufacturers operate 79 factories in Indonesia, and they expect to add 54 during the next ive years. This expected expansion of plants in Indonesia by 68% is higher than the 33% expansion of the total number of plants in the rest of the region (EIU 2014b).
BOX 1 One-Stop Investment Service
During the presidential campaign, Jokowi emphasised his priority of improv-ing Indonesia’s investment climate and makimprov-ing investimprov-ing more business-friendly. During his irst 10 days in ofice, Jokowi made a surprise visit to the Investment Coordinating Agency (Badan Koordinasi Penanaman Modal [BKPM]) and asked it to conduct major reform within three to six months. BKPM started by introducing an online investment application form that allows potential investors to submit their applications electronically and reduces queueing times, which can be as long as four hours (Jakarta Post, 12 Dec. 2014). The next important move was to launch one-stop integrated ser-vices in January. Under this reform, 22 related agencies either transferred part of their authority in dealing with investment permits to BKPM or placed their oficers in BKPM.
10 Yose R. Damuri and Creina Day
Inlation, Interest Rates, and the Exchange Rate
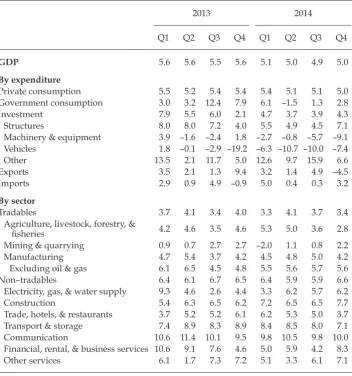
Inlationary pressures have eased across developing Southeast Asia in recent quarters, owing in part to declining oil and commodity prices. However, in the fourth quarter of 2014 Indonesia’s inlation rate accelerated following the reduc-tion of fuel subsidies in November and the increase in food prices. Inlareduc-tion was moderate at the start of the fourth quarter, having followed a downward trend in the irst three quarters (Aswicahyono and Hill 2014). Headline inlation was 4.8% in October and 6.2% in November. In December, it accelerated to 8.4%. The effect of higher administered fuel prices on headline inlation has been tempered, fortuitously, by falling international oil prices.5 In January 2015, inlation fell to 7.0% year on year. While the inlation rate is still controlled to single digits, the acceleration in inlation exceeded the expectations of analysts and BI.
Seasonal factors also contributed to the high December inlation igure, with the cost of staple foods, such as rice and red chilli peppers, rising during the holiday season at the year’s end. The biggest contributors to December inlation, month on month, were fuel prices (1.0%), electricity (0.6%), inner-city transport rates (0.6%), red chilli peppers (0.4%), and rice (0.4%) (BPS 2015a). The government off-set some of the price pressure by issuing import permits for staples, such as rice, although rice prices continue to rise. The recent agreement between Jakarta and East Nusa Tenggara to provide meat to Jakarta is an example of regional coopera-tion in supplying food from one province to another (Berita Jakarta, 23 Dec. 2014).6 BI took decisive action to contain inlationary expectations that could stem from the rise in fuel prices. In an unscheduled board meeting on 18 November, BI announced an increase of 25 basis points to its benchmark rate, to 7.75%. How-ever, it kept the deposit facility rate at 5.75%, thereby keeping the move neutral for bank liquidity. The deinition of deposits in the calculation of the loan-to-deposit ratio was broadened to include securities issued by banks, thereby providing more room for bank lending.
Accompanying the rise in headline inlation in the fourth quarter of 2014, core inlation, which excludes volatile energy and food prices, remained well anchored but is trending upwards, reaching 4.9% year on year in December. Historically, peaks in Indonesia’s inlation volatility have correlated with spikes in food prices and with administered adjustments in fuel and electricity prices. It is therefore useful to consider movements in core inlation. Headline inlation was above BI’s target zone of 3.5%–5.5% for 2014. Two counteracting forces were at work. First, in the fourth quarter of 2014 BI raised its benchmark policy rate, later raising its seven-day interbank call-money rate from 5.9% in October and November to 6.6% in December. Second, there were cost-push pressures from the increasing prices of fuel and food. The overall result is an inlationary outcome that is manageable, considering the temporary nature of the fuel-price rise, but worth the attention of BI in light of cost pressures.
5. While inlation spiked in December, following the rise in subsidised fuel prices in No-vember, inlation has been restrained by falling gasoline and diesel prices since 1 January 2015. The Asian Development Bank (ADB 2014) predicts an inlation rate of 6.7% in Indo-nesia in 2015, and expects inlation to taper towards the end of the year.
BI kept its benchmark policy rate unchanged in December and January, despite the expectation that inlationary pressures will ease in coming months owing to declining fuel prices. On the one hand, keeping the benchmark rate on hold may help to control core inlation. On the other hand, it could constrain investment spending and prevent the economy from meeting the government’s real GDP growth target of 5.8% for 2015.
In the fourth quarter of 2014, the rupiah weakened against the US dollar to levels not seen since the 1997–98 Asian inancial crisis. Point to point, the rupiah depreciated by 1.74% year on year in 2014; by the irst day of trading in 2015, the rupiah had fallen to Rp 12,514 per dollar. The dollar appreciated after improved economic data in the United States encouraged capital outlows from Asian stock markets (igure 1).7 BI purchased government bonds in the secondary market amid heavy selling pressure from foreign investors in mid-December. The depre-ciation in the rupiah does not indicate a crisis, however, because of improvements in economic fundamentals such as the current account deicit (see ‘Balance of Pay-ments’, below).
Fiscal Policy
Realisation of 2014 Budget
The realisation of the 2014 budget seems to be below target, for both revenue and expenditure. Preliminary budgetary igures reveal that the government’s revenue was around 94% of the projected revenue for 2014. This trend has existed for sev-eral years, but in 2014 the gap between targeted and actual revenue seems to have widened. The biggest gap can be found in tax revenue, which was 8.2%, or around Rp 103 trillion, lower than the target. The minister of inance indicated that short-falls exist in various taxes, including value-added taxes (short by around Rp 71 trillion) and non–oil and gas income tax (short by around Rp 56 trillion). The minister also mentioned that low tax-revenue collections were a result of the economic slowdown in the manufacturing and mining sectors, a weakening of imports, and a decrease in the price of crude palm oil on the international market (CNN Indonesia, 5 Jan. 2015).
Although tax revenue has increased substantially, with average annual growth of around 12% over the last ive years, the ratio of tax to GDP has remained almost the same. This indicates that various problems might hinder the government’s efforts to strengthen revenue. One feature of Indonesia’s tax composition is a strong reliance on corporate and consumption-related taxes, which contribute around 25% and 40%, respectively, of total tax revenue each year (Directorate Gen-eral of Taxes 2013). In contrast, tax on personal income accounts for only around 20%. Much of the corporate tax revenue comes from taxes on natural-resources wealth. For example, almost 20% of corporate tax revenue in 2013 came from the oil and gas sector. Low international oil and gas prices, coupled with dwindling oil extraction, will reduce Indonesia’s corporate tax revenue. It is important for Indonesia to increase and diversify its tax base by improving its tax administra-tion and the compliance of taxpayers. Of 22 million registered taxpayers in 2012, only around 54% submitted an annual income-tax form (Directorate General
12 Yose R. Damuri and Creina Day
of Taxes 2013). No data are available on what proportion of taxpayers iled the required documents in full.
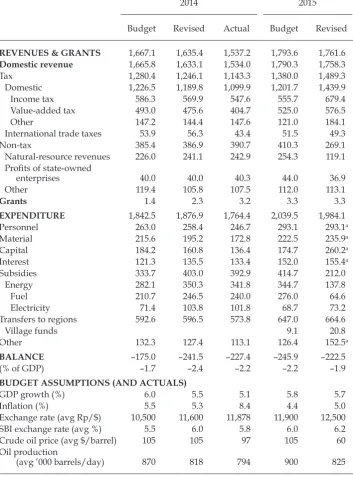
Table 2 shows that government revenue in 2014 was much lower than the tar-get but also that deicits remained below the threshold of 3% of GDP (thanks to lower expenditure, which was Rp 112.5 trillion less than targeted). Two factors may have contributed to the low realisation of expenditure. First is the reduc-tion of energy (fuel and electricity) subsidies, which in the revised 2014 budget took up around 27.4% of central-government spending (excluding transfers to regions); the government managed to cut these subsidies by 2.4%, or around Rp 8.5 trillion rupiah. Second is the eficiency improvement of central-government institutions and agencies, including some efforts to trim expenditure during the last two months of the iscal year.8 However, this can also be interpreted as the government’s inability to spend as budgeted and to deliver necessary public ser-vices, as shown by the lower amounts for all expenditure items in the budget realisation. For example, only 85% of budgeted capital expenditure was disbursed during 2014.
Low disbursement of expenditure is not new in Indonesia, but the Jokowi administration needs to pay attention to it. The combination of low revenue and low spending limits the government’s ability to boost economic performance by funding essential items such as infrastructure and social protection.
8. After forming the cabinet, Jokowi ordered all government oficials to cut their budget al-location for travel and meetings by holding meetings on their own premises, instead of in hotels, and by lying economy class. According to oficials in the Ministry of Finance, these initiatives are estimated to save up to Rp 4 trillion.
FIGURE 1 Inlation, the BI Rate, and Exchange Rates, 2012–15
Rp/$ (rhs)
REER (rhs)
BI rate (lhs)
Headline inflation (lhs)
(%) (Rp ’000)
Jan-20120 Jul-2012 Jan-2013 Jul-2013 Jan-2014 Jul-2014 Jan-2015 1
2014 2015
Budget Revised Actual Budget Revised
REVENUES & GRANTS 1,667.1 1,635.4 1,537.2 1,793.6 1,761.6 Domestic revenue 1,665.8 1,633.1 1,534.0 1,790.3 1,758.3
Tax 1,280.4 1,246.1 1,143.3 1,380.0 1,489.3
Domestic 1,226.5 1,189.8 1,099.9 1,201.7 1,439.9
Income tax 586.3 569.9 547.6 555.7 679.4
Value-added tax 493.0 475.6 404.7 525.0 576.5
Other 147.2 144.4 147.6 121.0 184.1
International trade taxes 53.9 56.3 43.4 51.5 49.3
Non-tax 385.4 386.9 390.7 410.3 269.1
Natural-resource revenues 226.0 241.1 242.9 254.3 119.1 Proits of state-owned
enterprises 40.0 40.0 40.3 44.0 36.9
Other 119.4 105.8 107.5 112.0 113.1
Grants 1.4 2.3 3.2 3.3 3.3
EXPENDITURE 1,842.5 1,876.9 1,764.4 2,039.5 1,984.1
Personnel 263.0 258.4 246.7 293.1 293.1a
Material 215.6 195.2 172.8 222.5 235.9a
Capital 184.2 160.8 136.4 174.7 260.2a
Interest 121.3 135.5 133.4 152.0 155.4a
Subsidies 333.7 403.0 392.9 414.7 212.0
Energy 282.1 350.3 341.8 344.7 137.8
Fuel 210.7 246.5 240.0 276.0 64.6
Electricity 71.4 103.8 101.8 68.7 73.2
Transfers to regions 592.6 596.5 573.8 647.0 664.6
Village funds 9.1 20.8
Other 132.3 127.4 113.1 126.4 152.5a
BALANCE –175.0 –241.5 –227.4 –245.9 –222.5
(% of GDP) –1.7 –2.4 –2.2 –2.2 –1.9
BUDGET ASSUMPTIONS (AND ACTUALS)
GDP growth (%) 6.0 5.5 5.1 5.8 5.7
Inlation (%) 5.5 5.3 8.4 4.4 5.0
Exchange rate (avg Rp/$) 10,500 11,600 11,878 11,900 12,500
SBI exchange rate (avg %) 5.5 6.0 5.8 6.0 6.2
Crude oil price (avg $/barrel) 105 105 97 105 60
Oil production
(avg ’000 barrels/day) 870 818 794 900 825
Sources: CEIC Asia Database; published and unpublished data from the Ministry of Finance (2014, 2015a); Jakarta Post (16 Feb. 2015).
Note: SBI = Sertiikat Bank Indonesia (Bank Indonesia Certiicate).
14 Yose R. Damuri and Creina Day
Revised Budget for 2015
In September 2014, parliament approved the 2015 budget, which had been pro-posed by the outgoing administration (Hill and Aswicahyono 2014). The then president, Yudhoyono, had insisted that the 2015 budget was a baseline variant that would offer the opportunity for the incoming government to make changes (EIU 2014a). The new administration submitted the draft of the revised budget in January 2015 and the parliament approved the revised budget in February 2015. The revised budget contains several necessary adjustments to allow the new administration to carry out its program and to account for relevant policy changes that have taken place since September.
Some adjustments were needed, for example, to relect recent national and international economic circumstances. The revised budget assumes that Indo-nesia’s economy will grow by 5.7% in 2015, slightly lower than the assumption in the old budget. The depreciation of the rupiah required an adjustment of the exchange-rate assumption from Rp 11,900 to Rp 12,500 per US dollar. The recent drop in international oil prices forced the government to lower its assumption about the price of Indonesian crude oil from $105 to $60 per barrel; the govern-ment also lowered its lifting target by 8.3%, over the concern that lower oil prices might mean that some oil ields will no longer be able to produce at the previously expected capacity. These revisions are relected in the revenue target for 2015. While revenue from natural resources accounts for 14.2% of total government rev-enue in the old budget, the revised version aims for only 6.8% (see box 2).9
In an attempt to compensate for this loss of revenue, the government has increased its expected revenue from taxes by 7.9%, or by 30.3% compared with actual taxation revenue last year. Revenue from personal income tax is expected to rise to Rp 679.4 trillion, an ambitious increase of 24% on last year’s actual rev-enue. Since the Directorate General of Taxes has often missed revenue targets, it is uncertain if and how the Ministry of Finance will reach this igure. Unless the ministry’s attempt includes improving tax administration, for example, the pursuit of higher taxation revenue might harm the economy by targeting already compliant taxpayers and thereby reducing their economic capacity.
Adjustments were also necessary to include the effects of eliminating fuel sub-sidies last November and changing the fuel-subsidy scheme to a ixed amount last December. These policies reduced the budgeted subsidy from Rp 414.7 tril-lion in the old 2015 budget to Rp 212.0 triltril-lion in the revised budget. Most of these funds still go to energy (distributed almost evenly between electricity and fuel), which accounts for 65% of total subsidies (See ‘Fuel-Subsidy Reform’, below).
The reduction gives the government iscal space of up to Rp 205 trillion, which can be used for other expenditures and to reduce deicits (Kompas, 9 Jan. 2015). In order to accelerate economic development and to achieve the new adminis-tration’s objectives, the government has allocated more money for programs it deems as priorities (Ministry of Finance 2015b). Most of this ‘priority budget’ will be spent on infrastructure-related expenditures, especially under the domain of the Ministry of Public Works and Housing, the Ministry of Transportation, and the
Ministry of Agriculture. In the revised budget for 2015, Rp 290 trillion has been set aside for infrastructure development (Jakarta Post, 23 Feb. 2015), an increase of 63% from the 2014 budget. The projects under this priority program include con-nectivity improvement both on land and at sea, such as the development of toll roads and railways, port building and improvement in 77 locations, and purchas-ing or buildpurchas-ing various types of vessels to support the development of the Sea Toll Road.10 The agricultural sector is also expected to be boosted, with the alloca-tion of Rp 14 trillion in infrastructure development,11 including the development of irrigation structures in some agricultural regions—Cianjur and Pare-Pare, for example—and the upgrading of agricultural machinery.
Adjustments were also needed to implement some new iscal items directed by changes in policy and government structure. One important change was the re organisation of central-government agencies, including the formation of new ministries and the separation or combination of agencies. Another important change was the introduction of a new type of regional transfer, mandated by Law 6/2014 on Villages. In the revised budget for 2015, almost Rp 21 trillion will be transferred to villages, more than double that in the original budget. It is expected that the fund will be used to improve village infrastructure and community devel-opment. It is not clear how funding will be allocated, however, since, according to the law, district governments will be in charge of implementation.
The macroeconomic effect of the budget seems to be less expansionary. The deicit remains quite modest at 1.9% of GDP (or as much as Rp 222.5 trillion), and
10. The Sea Toll Road development program is part of Jokowi’s grand plan to develop Indonesia’s maritime sector. A maritime-corridor transport system, the Sea Toll Road is expected to link thousands of Indonesian islands, served by large-tonnage ships carrying cargo or passengers and operating in sea lanes between ive main ports across the archipel-ago. The Sea Toll Road would be complemented by smaller corridors linking other ports. 11. In the proposed revised budget.
BOX 2 Tumbling World Oil Prices and the Budget
In January 2015, Brent crude-oil prices were almost 60% lower than they were in mid-2014. Oil traded at around $50 a barrel, its lowest level since 2009, owing to sustained levels of excess supply and weak global demand. In the revised 2015 budget, the Ministry of Finance assumed that the Indonesian crude price of oil will trade at $60 per barrel—down from $105 in the original budget.
16 Yose R. Damuri and Creina Day
it will be inanced mostly from domestic sources. More than Rp 242 trillion will be inanced from domestic sources. Net foreign inancing is expected to be negative, owing to the government’s loan repayments. Depending on domestic inancing risks crowding out domestic lending, which is already tight. The effectiveness of the budget depends on whether the government can implement all its infrastruc-ture projects and thereby increase the supply-side capacity of the economy.
Another important aspect of the proposed budget is the allocation of a sig-niicant amount as government’s placement of new capital to state-owned enter-prises (SOEs). Around Rp 64.8 trillion will be allocated to strengthen inancial capacity of SOEs, a big jump from Rp 5.0 trillion in the old budget. To receive this capital injection, SOEs will need to support ive priority programs: food sover-eignty, infrastructure and maritime development, the aerospace industry, national defence, and others. SOEs will also need to implement the recommendations of the Supreme Audit Agency (Badan Pemeriksa Keuangan) (Ministry of Finance, press release, 29 Jan. 2015). Thirty-ive SOEs are expected to beneit from this allocation, with infrastructure-development-related companies—for example, PT Sarana Multi Infrastruktur and Waskita Karya—set to receive the biggest portion of new capital. This capital will be raised by government inancing. Considering that the capital placement takes up almost one-third of net inancing, reducing this placement would signiicantly ease the inancing burden of covering the dei-cit.
Balance of Payments
The current account deicit fell to $6.2 billion in the fourth quarter of 2014 (table 3), largely owing to an increase in the trade surplus; imports weakened on the back of a depreciating rupiah and the combination of fuel-subsidy cuts and falling interna-tional oil prices. As a result, the deicit decreased slightly as a share of GDP, from 3.3% in 2013 to 3.0% in 2014. Yet Indonesia’s export performance remained poor. Commodities-related exports composed more than 50% of overall exports in 2014, a slight decline from 55% in 2012. Falling world commodity demand and export restrictions on various minerals and commodities hampered Indonesia’s export performance, even though the sharp depreciation of the rupiah cushioned some of the negative impact on demand for commodity exports and improved the com-petitiveness of manufacturing products. However, manufacturing output contin-ues to grow relatively slowly, at an annual rate of 5%. The manufacturing sector’s modest performance suggests that it cannot be relied on to provide a substantial source of export revenues to compensate for lower commodity export earnings.
The inancial account recorded a surplus of $7.8 billion in the fourth quarter of 2014, although this was much lower than in the third quarter (table 3). Indonesia saw substantial outlow in portfolio investment in the inal months of the year, especially in private-sector liabilities and equity capital, owing to the announced normalisation of monetary policy in the United States. Yet the outlow was more than balanced by foreign-capital inlows in the public sector. FDI inlows also slowed in the fourth quarter. Over the year, however, FDI inlows into Indonesia rose by 16.2% compared with 2013, relecting subsiding political uncertainty and increasing investor conidence (BKPM, press release, 28 Jan. 2015). The increase in the balance of the capital and inancial accounts in 2014 more than offset the current account deicit, boosting Indonesia’s foreign-exchange reserves and giv-ing Indonesia a buffer against potential capital outlows. Foreign reserves of $111.9 billion are equivalent to more than six months of imports and external debt service, greater than the international adequacy standards of three months (BI, press release, 15 Jan. 2015).
Indonesia’s external inancing relies heavily on potentially volatile portfolio and short-term inancing. These inancing needs were estimated to be around
TABLE 3 Balance of Payments, 2013–14 ($ billion)
2014
2013 2014 Q1 Q2 Q3 Q4
Current account –29.1 –26.2 –4.1 –8.9 –7.0 –6.2
Exports 182.1 175.3 43.9 44.5 43.6 43.2
Non–oil & gas 146.7 145.0 35.8 36.7 36.0 36.6
Oil & gas 33.6 28.8 7.6 7.5 7.3 6.4
Imports –176.3 –168.4 –40.6 –44.9 –42.0 –40.9
Non–oil & gas –132.9 –127.8 –30.2 –34.2 –31.6 –31.7
Oil & gas –43.3 –40.6 –10.3 –10.7 –10.4 –9.2
Merchandise trade balance 4.1 5.4 2.8 –0.7 1.2 2.1
Non–oil & gas 13.8 17.2 5.6 2.5 4.3 4.9
Oil & gas –9.7 –11.8 –2.7 –3.2 –3.1 –2.8
Services –12.1 –10.5 –2.2 –2.9 –2.6 –2.8
Income –27.1 –27.8 –6.4 –7.2 –7.1 –7.2
Current transfers 4.2 5.2 1.1 1.5 1.2 1.4
Capital & inancial accounts
Capital account 0.0 0.0 0.0 0.0 0.0 0.0
Financial account 22.0 43.6 7.2 13.9 14.7 7.8
Direct investment 12.3 15.3 3.3 3.5 5.9 2.6
Portfolio investment 10.9 25.8 8.7 8.0 7.4 1.6
Other investment –0.9 2.7 –4.7 2.3 1.4 3.7
Errors & omissions –0.2 –2.1 –1.0 –0.6 –1.3 0.8
Overall balance (change in reserves) –7.3 15.2 2.1 4.3 6.5 2.4
Foreign reserves 99.4 111.9 102.6 107.7 111.2 111.9
18 Yose R. Damuri and Creina Day
10% of GDP and around 77% of foreign-exchange reserves in 2014 (World Bank 2015). Indonesia’s reliance on short-term borrowing to inance its current account deicits, a heavy debt load denominated in foreign currencies, and a large stock of domestic debt held abroad remains a source of vulnerability. The easing of the current account deicit to a more sustainable level (below 3% of GDP) is desirable, as the large deicits of 2012 and 2013 (see Aswicahyono and Hill 2014) have left Indonesia somewhat vulnerable to capital outlows during global shocks.
FUEL-SUBSIDY REFORM
On 17 November 2014, the government announced an increase in subsidised fuel prices of 2,000 rupiah per litre, to Rp 8,500 for gasoline (a 31% rise) and Rp 7,500 for diesel (a 36% rise). On 1 January 2015, subsidies for premium gasoline were essentially removed; the price of gasoline is now adjusted each month by the gov-ernment to rise and fall in line with the price of crude oil. As the price of research octane number (RON) 88, a premium gasoline, will be adjusted every month, the price has not been completely dismantled. The government aims to gradu-ally abolish the use of RON 88 and switch to RON 92, a non-subsidised fuel sold under the Pertamax brand; Indonesia is the only country that still imports RON 88, rendering it vulnerable to trade cartels that may force a higher price (Jakarta Globe, 22 Dec. 2014). A ixed subsidy of Rp 1,000 per litre for diesel and kerosene replaced a ixed price, meaning that the government will no longer pick up the additional bill after an oil-price rise.
The initial policy change led to higher gasoline prices in November and Decem-ber 2014. At the start of January, gasoline prices were lowered to Rp 7,600 per litre (a 10.6% fall from the price set in November) because the downward trend in oil prices had caused the shadow value of gasoline to drop below the decreed price. On 19 January, fuel prices were reduced further—relecting lower global oil prices—when the government announced that premium gasoline would be Rp 6,600 per litre and diesel Rp 6,400 per litre.
Indonesia’s fuel-subsidy scheme had become an unbearable burden on the public budget (Agustina, Fengler, and Schulze 2012; Howes and Davies 2014). By the end of November 2014, world oil prices had fallen by around one-third from their level at 1 July. If ever there was an ideal time for a newly elected presi-dent to reform fuel subsidies, this was it. Unlike previous developments, the overhaul was an important step towards a market-based price mechanism—the government now sets gasoline prices each month, aligning them with the Mean of Platts Singapore.12 However, the scheduled monthly adjustment could still be undone. The real test of recent reforms will come when oil prices rise again.
The Jokowi administration has partially reformed fuel subsidies at a time of falling world oil prices and a weakening rupiah against the US dollar, two countervailing forces on the iscal burden of gasoline subsidies. Global oil prices peaked in 2008 and rallied again in 2011 to around $100 per barrel until mid-2014 (igure 2), before prices tumbled to below $50 a barrel in January 2015. By late February they had recovered somewhat, to $60 a barrel. Howes and Davies (2014) showed that the cost of fuel subsidies rose sharply in 2008 and remained
high from 2011. Figure 2 suggests that the cost of fuel subsidies followed oil-price movements. During the fuel-subsidy scheme, a depreciation of the rupiah trans-lated to an increase in domestic gasoline prices and a rise in the gap between the subsidised and the unsubsidised price per litre. Figure 3 suggests that the subsidy gap in the gasoline price would have increased with the rise in the US dollar against the rupiah if the government had not administered increases in June 2013 and November 2014. The gap decreased in these months, but it trended upwards from June 2013 in line with the rising US dollar.
The overhaul of gasoline and diesel subsidies has increased iscal space and will help reduce the gap between allocated and actual government spending in future budgets. It now seems less likely that actual spending on fuel subsidies will overshoot budget allocations, as has been the case in previous years because of trends in the oil price and the exchange rate. If so, this reform reduces the need for the government to make drastic revisions to its budget mid-year; it may also clarify the government’s inancing needs and bond issuance for the year, and in turn lower the cost of borrowing.
SOCIAL ASSISTANCE TO POOR HOUSEHOLDS
Evidence suggests that Indonesia’s fuel subsidies were highly regressive, dis-proportionately beneiting households at the top of the income distribution. Even after the fuel-subsidy reduction in June 2013, gasoline subsidies transferred Rp 200,000 per month to each household in the richest income decile and only Rp 45,000 per month to each household in the poorest (World Bank 2014a).13
13. Earlier research inds similar results. Agustina, Fengler, and Schulze’s (2012) study, for example, inds that around 28% of Indonesia’s fuel subsidies beneited the richest decile and more than half beneited the richest 30% of the population.
FIGURE 2 Oil Price (Brent Crude), 2000–2015 ($ per barrel)
Jan-20000 Jul-2002 Dec-2004 Jul-2007 Jan-2010 Aug-2012 Feb-2015 20
40 60 80 100 120 140 160
20 Yose R. Damuri and Creina Day
While many of Indonesia’s poorest citizens may not be affected directly by fuel subsidies,14 an increase in fuel prices could affect them indirectly by driving up transport costs, which in turn drive up the price of all items, including food and other basic necessities. After the rise in subsidised fuel prices on 17 November 2014, monthly inlation (year on year) in transport and food stuffs rose to 17.9% and 10.6%, respectively, in December (igure 4). A similarly steep rise in transport price inlation followed the June 2013 increase in subsidised fuel prices.
As of September 2014, BPS estimated that 27.7 million people, or 11% of Indone-sia’s population, live below the poverty line (BPS 2015b). IndoneIndone-sia’s poverty line, which is set at Rp 312,328 per person per month, or just 80 US cents a day, is low by international standards and much of Indonesia’s population is clustered just above this line (Sumner and Edward 2014). Consequently, without compensation measures in place, a relatively minor inlationary shock could push many people below that line and increase the poverty rate.15 However, the reforms to fuel subsi-dies may help to alleviate social inequality in two respects. First, income inequality (measured by the Gini coeficient) has increased over the last decade by 10%, to 0.41, and, rather than offsetting this trend, energy subsidies have exacerbated it (World Bank 2014b). Second, the savings from fuel-subsidy cuts can be diverted to inance an increase in infrastructure investment and social support for the poor.
The energy minister announced that the iscal savings generated thus far will allow the government to double its spending on transport and public works
14. Only 40% of the poorest decile of households report that they consume gasoline, most likely since the other 60% own neither cars nor motorcycles (World Bank 2014a).
15. The Ministry of Finance estimates that if prices increase by 10% then the poverty line will increase by 13%, to relect the increased level of expenditure for a minimum amount of consumption (Serambi Indonesia, 25 June 2013).
FIGURE 3 Subsidy Gap (Premium Gasoline) and the Exchange Rate, 2012–14 (’000)
Rp/$
Subsidy gap (Rp/litre)
Jan-20120 Jun-2012 Nov-2012 Apr-2013 Sep-2013 Feb-2014 Jul-2014 Dec-2014 2
4 6 8 10 12 14
(Jakarta Globe, 5 Jan. 2015). Transport costs depend not only on fuel prices but also on road infrastructure and the quality and availability of public transport. Indonesia is estimated to have foregone more than 1% in additional GDP growth owing to under-investment in infrastructure, chiely in transport (World Bank 2013), while inadequate investment has led to capacity gaps in roads and ports, and high logistics costs.16 World Bank simulations show that fully phasing out energy subsidies by 2018 could also enable the government to double its spending on social protection (World Bank 2014b).
In the lead-up to its recent fuel-subsidy reform, the government took steps to mitigate the impending impact of higher fuel prices on vulnerable households. On 3 November 2014, it began issuing cards that give poor Indonesians access to three programs—one giving cash handouts of Rp 200,000 per month and two expanding publicly funded education and health care: the Family Welfare Card (Kartu Keluarga Sejahtera [KKS]), Smart Indonesia Card (Kartu Indonesia Pintar [KIP]), and Healthy Indonesia Card (Kartu Indonesia Sehat [KIS]). Poor Indonesians were already eligible for such social programs,17 but the Jokowi gov-ernment would soon have trillions of rupiah to spend that its predecessors lacked. On 18 November, the day after cutting fuel subsidies, the government began dis-tributing family welfare deposits to KKS cardholders—15.5 million disadvantaged
16. According to the World Bank’s 2014 Logistic Performance Index, Indonesia ranks 53rd out of 160 countries. Singapore ranks 5th, Malaysia 25th, China 28th, Thailand 35th, and Vietnam 48th.
17. KKS and KIP replace Social Assistance Cards (Kartu Perlindungan Sosial) and Assis-tance for Poor Students (Bantuan Siswa Miskin), respectively. KIS is an expansion of the National Health Insurance (Jaminan Kesehatan Nasional) program, launched on 1 January 2014 by the previous government.
FIGURE 4 Monthly Inlation: Headline, Core, Food, and Transport, 2012–15 (% year on year)
Headline
Core Food Transport
Jan-20120 Jul-2012 Jan-2013 Jul-2013 Jan-2014 Jul-2014 Jan-2015 5
10 15 20 25
22 Yose R. Damuri and Creina Day
families who receive the lowest level of welfare, or 25% of households in Indone-sia. In the irst stage of the KKS program, each target family received Rp 200,000 in both November and December, a total of Rp 6.2 trillion (TNP2K 2014). This assis-tance was provided as electronic money via mobile phones, using digital inancial services (layanan keuangan digital [LKD]), to approximately 1 million families in 19 districts and cities and via Giro Pos deposits to 14 million families in 34 provinces.
The goal is for the LKD system to reach 15.5 million poor households, a third of Indonesia’s population, by the end of 2015, which would make it the larg-est system of its kind in the world. LKD’s non-cash assistance opens banking access to the poor and is expected to encourage people to save money. The latter is especially important, as inancial literacy in Indonesia is low. By sending money through mobile phones, people are less vulnerable to theft and are no longer lim-ited by the lack of bank branches in remote areas (see Stapleton 2013).
Assistance for primary education, as well as tertiary education, to students accepted to university under the KIP program will gradually expand to reach 24 million children and young adults, including those with social-welfare prob-lems and school-age children from disadvantaged families not covered under the Assistance for Poor Students (Bantuan Siswa Miskin) program. KIP beneits only those households with school-age children and thus does not extend to all households affected by higher fuel prices. Under KIS, the number of recipients of free health care and health insurance will be gradually expanded to include those with social-welfare problems and infants of premium-assistance-payment (penerima bantuan iuran) beneiciaries not covered by the National Health Insur-ance (Jaminan Kesehatan Nasional) program. However, supply-side constraints in underdeveloped regions have prevented participants in the national health scheme from accessing health care, leading to low claim rates (Jakarta Post, 15 Jan. 2015). In many regions, health facilities are simply not available or lack the neces-sary staff, equipment, or medicine for many health services.
INWARD TRADE AND INVESTMENT POLICY
During Yudhoyono’s second term, Indonesia introduced a range of policies that inhibit trade and restrict foreign investment. While the average tariff rate has continued to fall, whether under unilateral most-favoured-nation status or on a preferential basis, the use of disguised non-tariff barriers has been increasing.18 Early last year, the government enacted Law 7/2014 on Trade, which provides direction to regulate trade activities and, if necessary, to use more-protectionist policies. The government also launched a new negative investment list, which is in some respects more restrictive than the previous one (Armstrong and Rahardja 2014, 20).
In September 2014, Indonesia introduced Law 20/2014 on Standardisation and Conformity Assessment. The new law supports the implementation of the
Indonesian National Standard (Standar Nasional Indonesia [SNI]) to some manu-factured products on a voluntary and compulsory basis. As of January 2015, 10,204 SNIs had been developed, of which 270 were mandatory (BSN 2015). These SNIs include technical regulations, certiications, and laboratory testing procedures that need to be applied to imported and local products. Although the law states that the objective of the SNIs is to protect consumers and to increase the quality of Indonesia’s products, there is also interest in using SNI as a defence against imported products.19 This national-standards system has increased the cost of complying to the new regulations and the cost of obtaining evidence of conform-ity (through testing and certiication) for both domestic producers and importers, as SNIs often have different speciications from internationally accepted stand-ards. This may reduce the competitiveness of Indonesia’s exports.20
Those policies send a strong signal that Indonesia is becoming increasingly protectionist. The question is whether this position will continue under Jokowi. The National Medium-Term Development Plan 2015–2019 sets the international trade objectives of increasing non–oil and gas exports by 11.6% and raising the ratio of services trade to 3.5% of GDP by 2019 (Bappenas 2014, chapter 3, 72). The objective of increasing exports includes, among other strategies, using trade diplomacy more effectively and increasing Indonesia’s participation in the global value chain, which indicates that Indonesia might be willing to pursue a more open policy. However, the strategy also includes a plan to review existing trade agreements—particularly trade-remedy facilities—and to better manage imports, as way of increasing the competitiveness of Indonesia’s exports. This strategy includes using safeguards to protect local industries and markets from those deemed to be trading unfairly.21
Such nationalistic and protective sentiments stem from the perception that Indonesia’s meagre industrial and export performance needs to be enhanced before it continues to open its economy. This line of thinking suggests that the country needs to increase its industrial local contents and the value added of its domestically produced goods. Therefore, a certain level of support and protection is needed.22 Yet a similar strategy failed during Indonesia’s import substitution
19. Some comments from Indonesian businesses on the beneits of SNI show this tendency (Bisnis Indonesia, 23 Mar. 2012).
20. During an interview in January with automotive producers in Jakarta, the produc-ers commented that national standards are frequently less demanding than international standards but nevertheless need to be fulilled. Several food producers, including palm-oil producers, also commented that SNI speciications differed from the internationally ac-cepted standards. Producers have to comply with domestic as well as international stan-dards, which increases the price of their products.
21. During the APEC CEO Summit in Beijing on 10 November 2014, Jokowi urged APEC business leaders to support economic development in Indonesia and expressed his coun-try’s need for foreign investment (Jakarta Globe, 11 Nov. 2014). During the APEC Economic Leaders’ Meeting, however, Jokowi sent a signal that Indonesia would be careful in open-ing its economy further and in trade negotiations, and criticised Indonesia’s beopen-ing seen only as a market by other countries (see, for example, Jakarta Post, 12 Nov. 2014).
24 Yose R. Damuri and Creina Day
in the 1970s and early 1980s (see, for example, James and Fujita 1989; Thee 1987). Indeed, evidence shows that the Indonesian economy and industrial develop-ment have beneited from the liberalisation of goods, services, and investdevelop-ments.23 Virtually no restrictive regulations were created in the irst three months of the new administration, except for a plan to require exporters of commodities, such as crude palm oil and minerals, to use a letter of credits to ensure that their export revenues would be placed in the domestic banking system (Jakarta Post, 16 Jan. 2015). Such a requirement would cost exporters time and money and could reduce the competitiveness of Indonesia’s exports. Meanwhile, existing import regulations are being enforced more strictly than under the previous admin-istration; in December more than 2,100 registered importers had their licences suspended for not providing written quarterly reports on their import activities (CNN Indonesia, 15 Dec. 2014).
In investment procedures, the government started an initiative to improve the investment climate and help promote foreign investment (box 1). Since October, BKPM has received applications for $18.7 billion of prospective investment.
Regional Integration in 2015
This year may be critical for Indonesia’s involvement in regional integration and international trade agreements. The ASEAN Economic Community (AEC) will be launched on 31 December 2015, formally marking the full implementation of commitments described in the AEC Blueprint. These commitments include 277 measures—of liberalisation, facilitation, and reform—to create a more open, competitive, and equitable region (ASEAN Secretariat 2012). Some liberalisation measures, especially for trade in goods, have been in place for some months; oth-ers will be dificult to implement. Some facilitation measures—such as imple-menting the ASEAN Single Window, which will allow exporters and importers to submit all necessary documents through an online, integrated system—have been delayed by incomplete related national initiatives (Koh and Mowerman 2013).
Indonesia is struggling to meet many of its AEC commitments. It has had dif-iculty offering greater commitments in services-sector liberalisation, for example, since many recently launched sectoral laws have put foreign-equity limitations above the AEC’s services-liberalisation target. For instance, the AEC Blueprint stipulates that logistic services, as a priority services sector, must allow 70% equity participation from other ASEAN countries. Yet many existing regulations governing this sector in Indonesia, such as Law 17/2008 on Shipping, accept only minority foreign participation in logistics companies, and have yet to be brought in line with the AEC target.
Investment liberalisation is proving to be even more dificult. ASEAN countries launched the ASEAN Comprehensive Investment Agreement (ACIA) in 2009, to provide for more open investment in the region. However, ACIA still allows
a forum held by Kadin that one way for Indonesia to improve its competitiveness would be to provide protection from imports (RadarPena, 1 Nov. 2014).
countries to regulate and restrict foreign investment in sectors in their reservation list. Indonesia’s new negative investment list does not adhere to these commit-ments: it gives more restrictive treatment to 14 subsectors on Indonesia’s ACIA reservation list, such as estate-crop plantation and several forestry processing sectors. Moreover, many sectors in the negative investment list are not listed as reserved sectors in the ACIA (such as the transport, tourism, and trading sectors, which all have equity limitations). It is not clear whether Indonesia’s limitations on those sectors will be applied to foreign investment from ASEAN countries.
At the regional level, Indonesia faces the challenge of inishing negotiations over the Regional Comprehensive Economic Partnership (RCEP), which seeks to harmonise ASEAN’s current six free-trade agreements with trading partners.24 Indonesia has an important role in supporting and deining these negotiations; a representative of Indonesia acts a chief of the RCEP Trade Negotiating Commit-tee and as the ASEAN chair. After six rounds of talks, negotiations have yet to settle on an approach to continuing with RCEP’s substantive aspects (Economic Times, 16 Jan. 2015). Indonesia, like several other ASEAN members, seems to be less than enthusiastic in pursuing the negotiations; it still has negative sentiments about openness and what seems a lacklustre attitude to regional integration, as discussed above (see also Damuri, forthcoming). Indonesia should endorse RCEP, the success of which would beneit the region.25
At the bilateral level, Indonesia has yet to recommence several trade negotiations with South Korea, the European Free Trade Association, and the European Union that were postponed in 2014. Again, Indonesia seems reluctant to open its market further. The government and much of the public perceive ongoing trade agree-ments to have been unsuccessful and to have led only to surging imports from trad-ing partners, with no substantial increase of exports.26 However, some suspended negotiations are more in Indonesia’s interest than in the interests of its partners. The Indonesia–European Union Comprehensive Partnership Agreement, for example, might be used to replace the European Union’s Generalized Scheme of Preferences, which may no longer be valid by the time Indonesia becomes an upper-middle-income country. Since half of Indonesia’s exports to EU countries still beneit from this scheme, Indonesia may lose up to 12% of the value of its annual exports to the European Union if no preferential facilities exist (Damuri, Atje, and Soedjito 2015).
The Jokowi administration has much to do to improve Indonesia’s trade perfor-mance and competitiveness, and being more inward-looking is counter productive.
24. ASEAN has ive trade agreements with Japan, China, South Korea, India, and Australia and New Zealand. These agreements differ greatly in, for example, liberalisation schedules and coverage. RCEP is expected to provide greater coherence among those agreements, with ASEAN as the leading and pivotal party.
25. See, for example, Kawasaki’s (2014) study on the potential beneits of RCEP if it can provide high-quality trade agreements and promote greater coherence among ASEAN and its trading partners.
26 Yose R. Damuri and Creina Day
Competitiveness goes hand in hand with competition; competition encourages producers to work eficiently and eliminates rent-seeking. To promote competi-tion, Indonesia should provide access to foreign participants and make the most of their presence.
REFERENCES
ADB (Asian Development Bank). 2014. Asian Development Outlook Supplement: Growth Hesi -tates in Developing Asia. December. Manila: ADB.
Agustina, Cut Dian R. D., Wolfgang Fengler, and Gunther G. Schulze. 2012. ‘The Regional Effects of Indonesia’s Oil and Gas Policy: Options for Reform’. Bulletin of Indonesian Economic Studies 48 (3): 367–95.
Allford, Jason, and Moekti P. Soejachmoen. 2013. ‘Survey of Recent Developments’. Bulletin of Indonesian Economic Studies 49 (3): 267–88.
Amity, Mary, and Jozef Konings. 2007. ‘Trade Liberalization, Intermediate Inputs, and Pro-ductivity: Evidence from Indonesia’. American Economic Review 97 (5): 1611–38.
Armstrong, Shiro, and Sjamasu Rahardja. 2014. ‘Survey of Recent Developments’. Bulletin of Indonesian Economic Studies 50 (1): 3–28.
Arnold, Jens M., and Beata S. Javorcik. 2009. ‘Gifted Kids or Pushy Parents? Foreign Direct Investment and Plant Productivity in Indonesia’. Journal of International Economics 79 (1): 42–53.
ASEAN Secretariat. 2012. ASEAN Economic Community Scorecard: Charting Progress toward Regional Economic Integration; Phase I (2008–2009) and Phase II (2010–2011). Jakarta: ASEAN Secretariat.
Aswicahyono, Haryo, and Hal Hill. 2014. ‘Survey of Recent Developments’. Bulletin of Indonesian Economic Studies 50 (3): 319–46.
Bappenas (National Development Planning Agency). 2014. Rencana Pembangunan Jangka Menengah Nasional (RPJMN) 2015–2019, buku II: Agenda pembangunan bidang [National Medium-Term Development Plan (RPJMN), book II: Field development agenda]. Jakarta: Bappenas.
BI (Bank Indonesia). 2014a. ‘Consumer Expectation Survey’. December. Jakarta: BI.
———. 2014b. ‘Retail Sales Survey’. December. Jakarta: BI. http://www.bi.go.id/en/
publikasi/survei/penjualan-eceran/Documents/SPE%20Desember%202014.pdf. BPS (Badan Pusat Statistik). 2015a. ‘Consumer Price Index December 2014’. http://www.
bps.go.id/eng/tab_sub/view.php?kat=2&tabel=1&daftar=1&id_subyek=03¬ab=1.
———. 2015b. ‘Number and Percentage of Poor People, Poverty Line, Poverty Gap Index, Poverty Severity Index by Province, September 2014’. Accessed 1 March. http://www. bps.go.id/eng/tab_sub/view.php?kat=1&tabel=1&daftar=1&id_subyek=23¬ab=1. BSN (National Standardization Agency of Indonesia). 2015. ‘Data SNI Update’. Accessed 1
March. http://bsn.go.id/main/sni/isi_sni/28.
Damuri, Yose R. Forthcoming. ‘RCEP Prospect and Challenges: Political Economy of East Asian Integration’. In Regionalism in the Asia-Paciic: Current and Future Developments, edited by Sanchita B. Das. Singapore: Institute of Southeast Asian Studies.
Damuri, Yose R., Raymond Atje, and Audrey Soedjito. 2015. ‘Potential Impact of Indonesia– EU CEPA’. Working paper, Centre for Strategic and International Studies, Jakarta. Directorate General of Taxes. 2013. Harmonization in Building the Nation: 2012 Annual Report.
Jakarta: Directorate General of Taxes.
EIU (Economist Intelligence Unit). 2014a. ‘Budget 2015 Gives Jokowi Poisoned Chalice’. 20 August. http://country.eiu.com/article.aspx?articleid=1942194578&Country= Indonesia&topic=Economy.