Indo. J. Chem., 2006, 6 (1), 16 - 19
Suharso
16
* Email address : [email protected] (Suharso)
GROWTH RATE DISTRIBUTION OF BORAX SINGLE CRYSTALS ON THE (001) FACE
UNDER VARIOUS FLOW RATES
Suharso
*Department of Chemistry, Faculty of Mathematics and Natural Sciences, University of Lampung Jl. Soemantri Brojonegoro No. 1 Gedung Meneng Bandar Lampung
Received 9 January 2006; Accepted 20 January 2006
ABSTRACT
The growth rates of borax single crystals from aqueous solutions at various flow rates in the (001) direction were measured using in situ cell method. From the growth rate data obtained, the growth rate distribution of borax crystals was investigated using Minitab Software and SPSS Software at relative supersaturation of 0807 and temperature of 25 °C. The result shows that normal, gamma, and log-normal distribution give a reasonably good fit to GRD. However, there is no correlation between growth rate distribution and flow rate of solution.
Keywords: growth rate dispersion (GRD), borax, flow rate
INTRODUCTION
There is increasing experimental evidence that, under constant external conditions of supersaturation and temperature, different crystals of the same material grow at different rates. Investigations of individual crystals give information about broadening of a crystal population, initially of near uniform size. This suggests that variations of growth rate have occurred. This phenomenon of growth rate dispersion (GRD) is important for at least two very different reasons. First, it is a reflection of the growth process taking place at the crystal surface and so the nature and magnitude of the growth rate dispersion may give information about the growth mechanism. Second, its occurrence affects the crystal size distribution, and hence the product quality, produced in industrial crystallizers [1].
This paper studies the growth rate distribution of the (001) face of borax crystal by usingin situcell optical microscopy method under various flow rates. The growth rate data obtained were examined by SPSS and Minitab software to conclude their distribution model.
EXPERIMENTAL SECTION
Solubility of borax in water
The driving force for crystallization is usually expressed as a supersaturation ratio, defined as [2]:
*
A
A
S
WhereAandA*are the initial and the equilibrium solute concentrations. The solubility of borax in water used has been reported by Nies and Hulbert [3] and Sprague [4].
Experimental Set-up
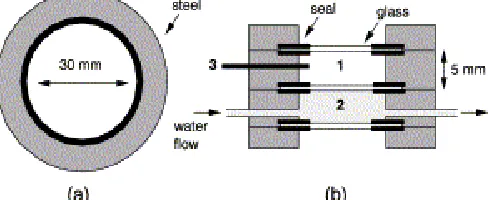
In situ cell optical microscopy method described by some researchers [5-7] was used. Optical microscopyin situgrowth experiments were conducted using a set up that consists of a Nixon Optiphot-2 Microscope with automated video image capture, a Grant W14 (Grand Instruments Ltd.) circulating water bath with temperature controller, Pulnix TM-9701 Camera (Progresive Scanning Full Frame Shutter Camera), and a Pentium II Computer. The schematic diagram of thein situgrowth cell is given in Fig 1. The in situ growth cell has two compartments; water at desired temperature was circulated through the lower chamber of the cell to keep the temperature constant in the sample solution compartment (volume 5 mL). During the growth experiments, a digital thermometer (HANNA Instruments, HI 8424) was usedd to monitor the temperature of the sample solution compartment. The images of the growing seed crystals were recorded using the video camera and the change in length of the (001) face was measured using the Optimas Software, Version 6.2 (Optimas Corporation, Bothell, Wa, USA.) linked automatically with Microsoft Excel Program, 1997.
Indo. J. Chem., 2006, 6 (1), 16 - 19
Initial crystal size (m)
G
Initial Crystal Size (m)
G
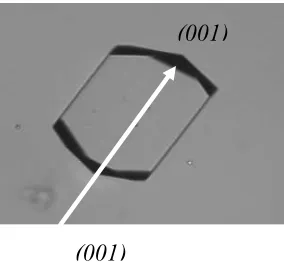
Fig 2 Schematic diagram of the (001) face from borax crystal measurement within optical in situ growth cell
The schematic of crystal measurement of the (001) face in the in situ growth cell is shown in Fig 2. Following measurement of crystal length, a linear regression was performed on the length data for each crystal. In order to obtain the growth rate of the (001) face, the slope of the plot was divided by two. The final growth rates are reported asm/minute.
Seed Preparation
The seed solution was prepared from 30 g of Univar AR grade sodium tetraborate dissolved in 100 mL of Milli-Q water by heating up until 60 °C and filtering through filter paper. The solution was quickly cooled down into petridish that covered by a transparent plastic, producing 40-250m well crystals. These seed crystals were used to investigate the growth rate.
Preparation of Growth Solutions
The growth solution was dissolved in 200 mL of Milli-Q water by heating up until 60 °C and filtering through a 0.45 m filter membrane. The filtered solutions were placed into waterbath at temperature of 25 °C with covered plastic bottle for 3 hours before used. The growth solution was circulated through the cell via peristaltic pump at different flow rates in the range 0, 2.5, 5, 7.5, and 10 mL/min. The experiments were performed at temperature 25 °C and relative supersaturation 0.807. The initial size range of the seed crystals is approximately 40-200m. The number of the crystal observed is around 42-50 crystals.
RESULT AND DISCUSSION
In Fig 3, the growth rates of the (001) face at different solution flows are plotted versus their initial crystal size. It is shown that there is no effect of crystal size on the growth rate of the (001) face under various solution flows. At the flow rate of 0 mL/min, small crystals of about 60-80 m can grow at a rate approximately similar to those of big crystals of about 160-200m. The different growth rates between initial
Fig 3 Initial crystal size versus growth rate of the (001) face for crystals grown at 25 °C and (s-1) 0.807 under various flows
Fig 4 Growth rate dispersion of the (001) face at 25 °C, relative supersaturation of 0.807, and flow rate of 0 mL/min
crystal size 60-80m are from 3.3 to 5.3 m/min. The big crystals around 150-180m grow at rates from 2.7 to 5.5m/min.
The growth rate dispersion of the (001) face can be seen in Fig 4. From 48 crystals, 19 crystals from the initial size 100-210 m and 10 crystals from the initial size below 100 m do not lie in the confidence interval of average growth rate with their error bars included. The growth rates of 14 crystals lie above upper value of confidence interval and 16 crystals lie below lower value of confidence interval.
Table 1 shows the parameters of growth rate distribution of the (001) face from normality test investigation. As can be seen from this table, only the growth rates of 5 mL/min flow rates give normal distribution withp-valueof 0.319. However, there is no correlation between growth rate distribution and flow rate of solution. The histograms of the (001) face at different flow rates are shown in Fig 5. Gamma, log-normal, and normal distributions were examined by SPSS software for their goodness of fit to the experimental data of growth rate dispersion of (001) face by comparing expected cumulative probability from the model distribution with the observed cumulative probability.
(001)
Indo. J. Chem., 2006, 6 (1), 16 - 19
Suharso
18
Table 1 Parameters of growth rate distribution of the (001) face at 25 °C, relative supersaturation of 0.807 under various flows
Flow rate (mL/min)
Parameters 0 2.5 5 7.5 10
N 48 53 42 49 50
GR(m/min) 3.912 3.761 3.821 3.542 3.910 S2(m2/min2) 0.377 0.500 0.318 0.322 0.489 S(m/min) 0.614 0.707 0.563 0.568 0.699 Skewness 0.655 0.574 0.335 1.462 0.547 Kurtosis -0.27 -0.03 -0.47 3.241 -0.34 CV (%) 15.70 18.81 14.75 16.03 17.89
Q1 3.508 3.357 3.447 3.254 3.537
M 3.812 3.744 3.721 3.403 3.765
Q3 4.318 4.034 4.188 3.640 4.336
P-Value 0.024 0.007 0.319 0.000 0.003
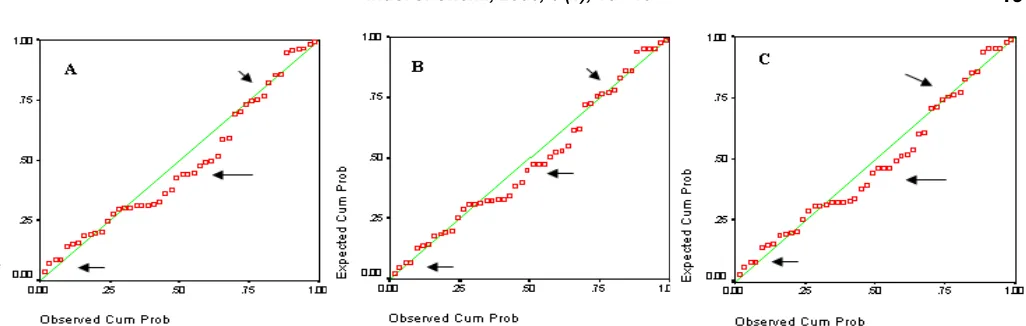
Results are shown in Fig 6 and show that gamma and log normal distribution could fit the growth rate distribution rather well (shown by the arrow).
From this figure can also be seen that the cumulative probability of occurrence of growth rate (signed red dots) are closer to expected cumulative probability of log-normal and gamma distributions (signed by green lines). It can be seen from the arrows signed that the cumulative probability of occurrence of log-normal and gamma distributions are much closer to their expected probabilities than the cumulative probability of normal distribution. These distributions are typical of all data obtained fromP-valuebelow 0.1.
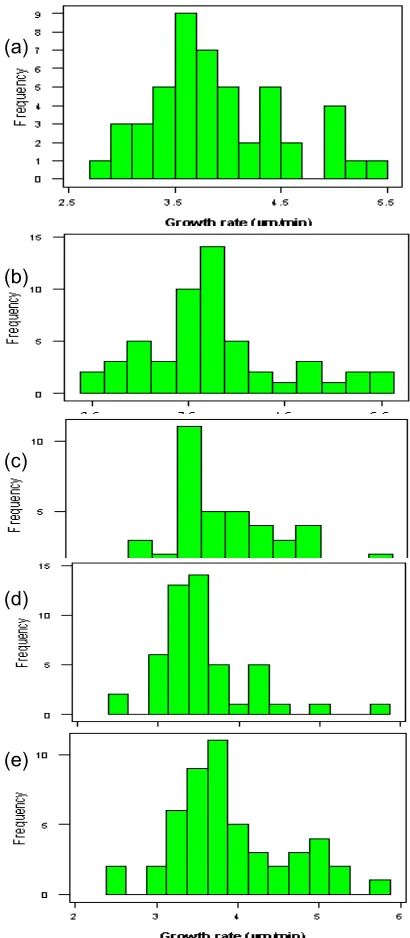
Another reason to describe the growth rate distribution of the (001) face is by the existence of two or more maxima [8]. It can be seen from the histogram of Fig 5(e) that the growth rate distribution of the (001) face has at least two clearly separated maxima, the first at approximately 3.75 m/min and the second around 5 m/min. By the observation of histogram from Fig 5, the existence of more maxima is not certain.
It is known that the growth rate and physical properties of crystals depend on macroscopic growth conditions. The crystals growing at a faster rate, owing to more favourable macroscopic external conditions, have worse internal perfection. In the case of growth rate dispersion, if under the same external conditions different crystals of the same material grow at different rates, crystals that grow faster have better internal perfection [9, 10]. It is shown that there is connection between crystal growth and dissolution rate, hence it is assumed that there exists a connection between the growth rate dispersion and some other physical properties of the crystals. Since it was established that a link between the growth rate of crystals and the growth rate of its seed exists, it can be expected that, by suitable choice of seeds, it may be possible to influence some physical properties of large crystals [8].
(a)
(b)
(c)
(d)
(e)
Fig 5 Growth rate distribution of (001) face from borax crystals grown at 25 °C, relative supersaturation of 0.807, and in the flow experiment of (a) 0, (b) 2.5 (c) 5 (d) 7.5 and (e) 10 mL/min
As shown in Fig 5(d), there are two groups of crystals whose growth rates differ significantly; it can be expected that there would also be differences in the physical properties of crystals belonging to one or the other group, as well as between crystals of the same group.
Indo. J. Chem., 2006, 6 (1), 16 - 19
Suharso
19
Fig 10 The cumulative probability comparison between experimental data and theoretical distributions of (001) face at relative supersaturation of 0.807, at temperature of 25 °C, and solution flow of 0 mL/min: (A) For normal distribution, (B) for log-normal distribution, and (C) for gamma distribution
rates of individual crystals can arise from the difference in activity of the dominant dislocation groups of equivalent crystallographic faces, which is dependent on the density, sign and orientation of screw dislocations, and the possibility of cooperation of growth spirals [11].
If the dislocation structure of the (001) face is the cause of GRD, the existence of two maxima indicates that growing borax crystals have the activities of dominant dislocation group that group around two values. These activities correspond to the growth rate of crystals that correspond to the maxima mentioned. The existence of two maxima was also reported on the growth rate dispersion of KDP crystals [11].
The result of this study can also be explained by the results of recent studies that suggest a link between GRD and the degree of crystal lattice strain [9, 12]. There are four possible mechanisms linking the stress of the crystals and GRD namely; a point defect model, a (random) distribution of dislocation (Frank network), the presence of grain boundaries and volume strain variations in the crystal [12].
CONCLUSION
From the growth rate data obtained, the growth rate distributions of borax single crystals on the (001) face show that normal, gamma, and log-normal distribution give a reasonably good fit to GRD under these experimental conditions. However, there is no correlation between growth rate distribution and flow rate of solution.
ACKNOWLEDGEMENT
This work has been supported by LPIU-DUE Project University of Lampung and A.J. Parker Cooperative Research Hydrometallurgy, Western
Australia. The author is grateful to Prof. Gordon Parkinson and Associate Prof. Mark Ogden from Nanochemistry Research Institute, Curtin University of Technology, Perth, Western Australia for the valuable guidance and support that they provided towards this work.
REFFERENCES
1. Garside, J, and Ristic, R.I., 1983, J Cryst. Growth, 61, 215-220.
2. Mullin, J.W., 1993, Crystallization, third edition, Butterworth-Heinemann Ltd, Oxford.
3. Nies, N.P., and Hulbert, R.W., 1967,J. Chem. Eng. Data, 12 (3), 303-313.
4. Sprague, R.W., 1980, In Mellor’s Comprehensive Treatise on Inorganic and Theoritical Chemistry, Vol. 5, 254, London and New York, Longman. 5. Lowe, J., Ogden, M., Mc Kinon, A., and Parkinson,
G., 2002,J Cryst. Growth,238.
6. Lee, M. and Parkinson, G. M., 1999, J Cryst. Growth, 198/199, 270-274.
7. Suharso, 2003, Jurnal Penelitian Sains dan Teknologi, 9(2), 45-50.
8. Mitrovic, M.M., 1997, Chem. Phys. Lett., 265, 315-319.
9. Zacher, U. and Mersmann, A., 1995, J Cryst. Growth,147, 172-180.
10. Ristic, R. I., Sherwood, J. N. and Wojciechowsky, K., 1988,J Cryst. Growth, 91, 163.
11. Mitrovic, M.M., Zekic, A.A., and Petrusevski, Lj.S., 1999,J Cryst. Growth, 198/199, 687-691.