International Review on
Modelling and Simulations
(IREMOS)
Contents
Sensorless Fuzzy MPPT Technique of Solar PV and DFIG Based Wind Hybrid System
by Marouane El Azzaoui, Hassane Mahmoudi, Karima Boudaraia
152
Analysis of Flashover Induced by Transient Current During Multiple Lightning Strokes on a Train
by Kelvin M. Minja, Pius V. Chombo, Narupon Promvichai, Boonruang Marungsri
160
Performance Analysis of a Wind Turbine
Based on a Self-Excited Induction Generator (SEIG)
by Abdallah Belabbes, Mohamed Bouhamida, Allal El Moubarek Bouzid, Mustapha Benghanem, Mohamed Della-Krachai, Mamadou Lamine Doumbia
169
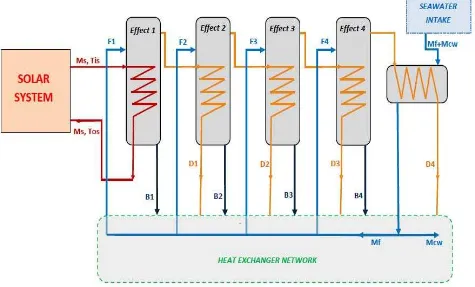
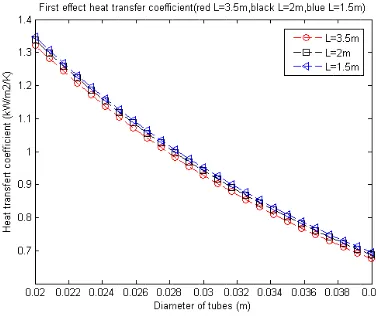
Seawater Desalination Pilot Plant: Optimal Design and Sizing of Solar Driven-Four Effect Evaporators Combined with Heat Integration Analysis
by M. Ghazi, E. Essadiqi, M. Mada, M. Faqir, A. Benabdellah
177
Forest Fire Danger Assessment Using SPMD-Model of Computation for Massive Parallel System
by Nikolay V. Baranovskiy
193
Rule-Based and Genetic Algorithm for Automatic
Gamelan Music Composition
by Khafiizh Hastuti, Azhari, Aina Musdholifah, Rahayu Supanggah
International Review on Modelling and Simulations (I.RE.MO.S.), Vol. 10, N. 3
ISSN 1974-9821 June 2017
Sensorless Fuzzy MPPT Technique of Solar PV and DFIG Based
Wind Hybrid System
Marouane El Azzaoui, Hassane Mahmoudi, Karima Boudaraia
Abstract
– This paper presents a method for estimating the power of a PV combined with a windsystem based on a Doubly Fed Induction Generator (DFIG). This estimated power is used for calculating the maximum power point tracking algorithm. A turbine drives the DFIG, its stator is attached directly to the grid, while its rotor is connected to the grid through a back-to-back converter. The PV system is used with a buck-boost converter, which is linked to the DC bus of the back-to-back converter. This structure eliminates the inverter with its associated devices. In this work, the MPPT algorithm is based on fuzzy logic whose inputs are: the previous duty cycle and the estimated power based on the calculation made by the DFIG. This allows removing the voltage and current sensors. The simulation results present the performance of the proposed method subjected to irradiation and wind speed variations at different operating modes. Copyright ©
2017 Praise Worthy Prize S.r.l. - All rights reserved.
Keywords:
Sensorless MPPT, Photovoltaic, Doubly Fed Induction Generator, Fuzzy MPPT, Hybrid SystemNomenclature
pv
I Output current of the solar cell
pv
V Output voltage of the solar cell
ph
I Photocurrent produced by PV cell
s
I Reverse saturation current of diode
q Electric charge of electron
k Boltzmann constant
n Ideality factor
se
R ,R sh Series and shunt resistances
sd
V ,Vsq Direct and quadratic stator voltages of DFIG
sd
I , Isq Direct and quadratic stator currents of DFIG
sd
, sq Direct and quadratic stator flux of DFIG
rd
V ,Vrq Direct and quadratic rotor voltages of DFIG
rd
I , Irq Direct and quadratic rotor currents of DFIG
rd
, rq Direct and quadratic rotor flux of DFIG
s
R ,R r Stator and rotor resistor
s
, r Stator and rotor frequencies s
L ,L ,r L Stator, rotor and mutual inductances m p Pole pair number
m
Mechanical speed of the DFIG
s
P , P r Stator and rotor active power
s
Q , Q r Stator and rotor reactive power
Leakage coefficient
g Slip
Air density
p
C Power coefficient
Pitch angle
R Radius of the turbine
w
v Wind speed
Tip speed ratio
t
Angular speed of the turbine
m
T Torque of the turbine
L
T Load torque
J Moment of inertia of the turbine
f Viscosity coefficient of the turbine
I.
Introduction
Renewable energy has seen an increase in recent years to reduce fossil energy sources such as oil, gas, and coal polluting the environment. These renewable energy, wind and solar energies are considered the most potential. The development of power electronics makes photovoltaic energy and wind system more attractive and practical. Moreover, DFIG becomes popular due to its advantages in variable speed wind turbine [1], [2].
M. El Azzaoui, H. Mahmoudi, K. Boudaraia
Copyright © 2017 Praise Worthy Prize S.r.l. - All rights reserved International Review on Modelling and Simulations, Vol. 10, N. 3 linked to the DC bus of the back-to-back converter.
There is in literature many hybrid system based on DFIG and PV. For example, Rajesh et al. give an architecture and control of the hybrid system [3]. Chin Kim Gan et al. present a paper that assesses the potential of implementing the Hybrid Diesel/PV/Wind/Battery in Eluvaitivu Island using HOMER simulation [4].
Mukwanga W. Siti use a load following diesel dispatch
strategy and analyse the fuel costs and energy flows [5]. Benameur Afif et al. present a wind/PV hybrid system in rural areas [6]. This research presents a sensorless Fuzzy MPPT technique to estimate the PV power for the hybrid system, which eliminates more the voltage sensor compared to old research, which eliminate just the current sensors like the work of Nguyen and Fujita that introduced a sensorless method using P&O MPPT algorithm, which remove only the current sensor of PV [7].
This research is arranged as follow: a brief structure of the system is presented in second section, and the modelling of the DFIG and PV is illustrated in the third section, while the fourth section summarizes the control strategy of the DFIG, establishing the Fuzzy MPPT algorithm, and presenting a sensorless technique to estimate PV power. Finally, simulation results show the response of the proposed method under changes of irradiation and wind speed.
II.
Presentation of the Studied System
The system studied in this work is shown in Fig. 1. The turbine is connected to DFIG through a gearbox, which allows adapting the low speed rotation of the turbine to high speed of the DFIG. The stator of the DFIG is connected directly to the grid, while its rotor is connected to the grid through a back-to-back converter and RL filter that help mitigate harmonic generated by this converter. The PV generates a power which is the input to DC-DC converter, while its output is related to DC-link of the Back-to-Back converter, then the RSC and GSC convert the DC energy to AC energy which supplies the rotor or the grid depending on the operating mode (hypo-synchronous or hyper-synchronous) [14], [15]. The DC-DC converter used is a buck-boost converter, which has good stability and fast response. The advantage of this structure is that the inverter with it associated components most used after the buck-boost converter is eliminated which reduces the system cost. Furthermore, a senseless technique for the hybrid system is suggested. This technique decrease the numbers of sensors used to extract the maximum power of the PV, so that reduces more the system cost.
III.
Modelling of PV and DFIG
To control the hybrid system, it is necessary to model the PV and DFIG. Modelling means bring out the mathematical equations governing the physical behaviour of the system.
Fig. 1. Structure of the hybrid system
III.1. Modelling of PV
The equivalent circuit of a photovoltaic cell consists of a photo current, a diode, a shunt resistor that expresses the leakage current, and a series resistor defines the internal resistor which limits the current (Fig. 2).
Fig. 2. Equivalent circuit of a PV cell
Equation describing the voltage-current characteristic is given by [8]:
pv se pv
1pv ph s
pv se pv
sh
q V R I
I I I exp
nkT
V R I
R
(1)
Fig. 3 presents the P-V and I-V characteristics of the PV array. We notice that the characteristic of the power in function as voltage presents a maximum power point (MPP). In order to extract the maximum power, this point must be tracked whatever the weather conditions.
III.2. Modelling of DFIG
M. El Azzaoui, H. Mahmoudi, K. Boudaraia
Fig. 3. Power-Voltage curves under irradiation and temperature change
Voltage equations:
sd
sd s sd s sq
d
V R I
dt
(2)
sq
sq s sq s sd
d
V R I
dt
(3)
rd
rd r rd r rq
d
V R I
dt
(4)
rq
rq r rq r rd
d
V R I
dt
(5)
Flux equations:
sd L Is sd L Im rd
(6)
sq L Is sq L Im rq
(7)
rd L Ir rd L Im sd
(8)
rq L Ir rq L Im sq
(9)
Frequencies equation:
r s p m
(10)
Powers equations:
s sd sd sq sq
P V I V I (11)
s sq sd sd sq
Q V I V I (12)
r rd rd rq rq
P V I V I (13)
s rq rd rd rq
Q V I V I (14)
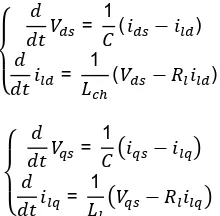
In this step, the stator field orientation is applied by aligning the stator flux with d axis to simplify the control of the DFIG [10]. Moreover, considering that the grid fed the generator by a stable voltage, and neglecting the stator resistor [11], we obtain:
0
sd s ; sq
(15)
0
sd sq s s s
V ; V V (16)
These assumptions led to deducing the expressions of the rotor voltages:
rd
rd r rd r r s rq
dI
V R I L g L I
dt
(17)
rq s m
rq r rq r r s rd
s
dI V L
V R I L g L I g
dt L
(18)
The powers can be simplified as:
s m
s rq
s V L
P I
L
(19)
2
s m s
s rd
s s s
V L V
Q I
L L
(20)
From equation (19) and equation (20), it is obvious that we can control independently the stator active and reactive powers by controlling the rotor currents. Hence, the reference currents are calculated from these equations.
IV.
Sensorless Control of the
Hybrid System
The control of the hybrid system is depicted in this section. First, classical controls of the DFIG and PV MPPT are highlighted. The sensorless method of MPPT power is suggested secondly.
IV.1. Maximum Power of Wind Turbine
Wind turbine produces the following power [12]:
2 30 5
m p w
P . C , R v (21)
where ρis the air density, Cp is the power coefficient, β is the blades orientation, R is the radius of the turbine, vw is
the wind speed, and λ is the tip speed ratio, which is given by:
t
w R
v
(22)
where Ωt is the angular speed of the turbine, its dynamic is given by:
t
m L t
d
J T T f
M. El Azzaoui, H. Mahmoudi, K. Boudaraia
Copyright © 2017 Praise Worthy Prize S.r.l. - All rights reserved International Review on Modelling and Simulations, Vol. 10, N. 3 where J is the moment of inertia, f is the viscosity
coefficient, Tm is the torque generated by the turbine, and TL is the load torque in this case the electromagnetic
torque of the DFIG. The maximum power that can be developed by the turbine is written as:
5
3 3
0 5 pmax
max topt
opt
. R C
P
(24)
with:
opt w topt
v R
(25)
IV.2. RSC Control
Through the rotor side converter (RSC), we can control the active and reactive powers of the generator independently, from equation (19) and equation (20), those powers are controlled by controlling the rotor currents using PI correctors. Results voltages are converted in the abc reference frame using Park inverse. Thereafter, by comparing these voltages with a carrier signal, the switching signals are generated to control the IGBTs of the converter as presented in Fig. 4 [16]-[18].
Fig. 4. RSC control strategy
IV.3. GSC Control
Control strategy of the grid side converter (GSC) allows controlling the reactive power passing through the filter and therefore the power factor, and regulating the DC bus voltage to a constant value enough to have three-phase voltages to the other side of RSC and GSC. The reactive power is controlled by regulating the d-axis current using a PI controller. The control of the DC bus voltage is done through two regulation loops, an outer loop that regulates the DC voltage and an inner loop that control the q-axis current by using also the PI controller to track the reference signal. Results voltages are
transformed to abc frame using Park inverse which its angle is obtained using a PLL, and compared with the carrier signal to get the pulse width modulation necessary to control the IGBTs of the converter. Fig. 5 describes the control of the GSC.
Fig. 5. GSC control strategy
IV.4. Maximum Power of PV
MPPT is a technique that maximizes the power of the PV by adjusting the voltage to follow the top of the P-V curve. The voltage is adjusted by tightening the duty cycle of the buck-boost converter that adapts the power of the PV system to the load. There are several MPPTs algorithm in the literature. The most familiar is the P&O. In this work, the fuzzy MPPT is adopted because it robust than the P&O technique, and the other reason for choosing this method is that the input is the change of power and the previous duty cycle, therefore in the sensorless step, the voltage sensor is removed again compared to the work done here [7]. The principal of the fuzzy controller based maximum power point tracking is presented in Fig. 6. Voltage and current are measured and then used to calculate the power. The fuzzy system handles the two inputs change of power ΔPkmultiplied
by the scaling factorkp and the previous value of the duty
cycle ΔDk-1to provide the duty cycle Dk that converted to
PWM signal to control the switch of the buck-boost converter. kd is the scale factor in the output, and
1 Z is a unity delay [13].
M. El Azzaoui, H. Mahmoudi, K. Boudaraia
Fig. 7 and Fig. 8 show the subsets of the input and output to the fuzzy system. Input ∆Pk has five fuzzy
subsets Positive Big (PB), Positive Small (PS), Zero (ZE), Negative Small(NS), and Negative Big (NB). Input
∆Dk−1 and output ∆Dk have eleven fuzzy subsets PB,
Positive Medium (PM), Positive Medium Medium (PMM), PS, Positive Small Small (PSS), ZE, Negative Small Small (NSS), NS, Negative Medium Medium (NMM), Negative Medium (NM), and NB. The inputs and output are normalized. The membership functions are made by triangular and trapezoidal shapes and are denser in the centre to have good accuracy while the variation of power close to zero.
Fig. 7. Membership functions power input
Fig. 8. Previous duty cycle input and duty cycle output membership functions
The fuzzy rules are defined by analysis of the PV behaviour. All conditions are taken into account to achieve good performance in term of tracking the maximum point. The Fuzzy rules are summarized in Table I.
TABLEI FUZZY SYSTEM RULES
∆Dk ∆Dk−1
NB NM NMM NS NSS ZE PSS PS PMM PM PB
∆Pk
NB PM PMM PS PSS PSS NB NSS NSS NS NMM NM
NS PM PMM PS PSS PSS NS NSS NSS NS NMM NM
ZE NB NM NMM NS NSS ZE PSS PS PMM PM PB
PS NM NMM NS NSS NSS PS PSS PSS PS PMM PM
PB NM NMM NS NSS NSS PB PSS PSS PS PMM PM
Fig. 9 shows the graphical representation of the fuzzy surface.
IV.5. Sensorless of PV Power
Maximizing power method of the PV is based on the measurement of power by measuring voltage and current as illustrated in Fig. 6.
Fig. 9. Surface generated by fuzzy system
In this section, a sensorless technique is shown to estimate the power used in the input of the fuzzy system to track the maximum power point of the PV and therefore eliminate the voltage and current sensors. This sensorless method is based on measurements made by the DFIG such as the output of the buck-boost converter is linked to the DC bus of the DFIG.
Fig. 10 shows the flows of powers exchanged between the PV and DFIG in the two hypo-synchronous and hyper-synchronous modes. In hypo-synchronous 1 mode, the direction of transfer of the energy comes from the grid and PV to the rotor of the machine, while a part of energy produced by the PV if and only so great is injected to the grid in hypo-synchronous 2 mode.
Fig. 10. Flow of powers exchanged between the converters
Finally, the power produced by the rotor of the DFIG and the PV are injected directly to the grid. The flow of all power in different operating mode is expressed by:
In hypo-synchronous mode 1:
rsc gsc pv
P P P (26)
In hypo-synchronous mode 2:
pv rsc gsc
M. El Azzaoui, H. Mahmoudi, K. Boudaraia
Copyright © 2017 Praise Worthy Prize S.r.l. - All rights reserved International Review on Modelling and Simulations, Vol. 10, N. 3 In hyper-synchronous mode :
gsc rsc pv
P P P (28)
where Prsc is the RSC power, and Pgsc is GSC power,
their expressions are given by:
rsc ra a rb b rc s dc
P i S i S i S V (29)
gsc fa a fb b fc s dc
P i S i S i S V (30)
here subscriptsr, f, a, b, andcare rotor side, filter side, phase a, phase b, and phase c respectively. Sa,b,c is the switching states of the RSC and GSC.
Table II summarizes the different systems and sensors used. Separate PV-DFIG needs all the sensors, the hybrid system without using the sensorless technique eliminate the PV inverter, when the sensorless technique is used with P&O MPPT which presented here [7], the current sensor is removed again. Moreover, the sensorless with fuzzy logic system presented in this paper eliminate the voltage sensors.
TABLEII
COMPARATIVE SENSORLESS TECHNIQUES
Sensor
System
DFIG sensors
Vpv
sensor Ipv sensor PV inverter Separate
PV-DFIG Yes Yes Yes Yes Hybrid without
Sensorless Yes Yes Yes No Sensorless with
P&O MPPT Yes Yes No No Sensorless with
fuzzy MPPT Yes No No No
V.
Simulation Results
The entire system is simulated using Matlab/Simulink software. The proposed MPPT and estimated power are analysed under change of irradiation. The flow of powers is validated in the different operating mode. The irradiation is increased from 0.6 pu to 1 pu at t=0.5s and decreased from 1 pu to 0.8 pu at t=0.7s as shown in Fig. 11.
Fig. 11. Change of irradiation
Under this change of irradiation, the power is retained in the optimal value as depicted in Fig. 12, and the Fig. 13 shows that DC bus voltage is kept to its constant
reference value. The estimated power is almost equal to the power measured unless a simple error due to the buck-boost converter yield (Fig. 14).
Fig. 12. MPPT under change of irradiation
Fig. 13. Evolution of the DC bus Voltage
Fig. 14. Response of measured and estimated powers
Now the system is subject to the variation of irradiation and wind speed to analyse the flow of powers exchanged between all converters. In hypo-synchronous 1 mode, Irradiation was increased from 1 pu to 0.8 pu at
t=0.6s and wind speed is decreased from 0.9 pu to 0.8 pu
at t=0.8s.
Fig. 15 illustrates that RSC power is the total of GSC power and PV power.
In hypo-synchronous 2 mode, Irradiation was changed from 1 pu to 1.2 pu at t=0.6s and wind speed is decreased from 0.98 pu to 0.94 pu at t=0.8s. Fig. 16 presents that the PV fed the power to the rotor through RSC and the grid through GSC. In hyper-synchronous mode, the rotor and the PV system supplies the grid through the GSC converter (Fig. 17).
M. El Azzaoui, H. Mahmoudi, K. Boudaraia
Fig. 16. Flow of powers in hypo-synchronous 2 mode
Fig. 17. Flow of powers in hyper-synchronous mode
VI.
Conclusion
In this paper, a sensorless technique of the fuzzy MPPT for a hybrid system based on PV and DFIG is studied. The structure proposed eliminates the inverter used with the PV system.
The suggested technique estimate the power used as input in fuzzy MPPT of the PV system using the DFIG system which remove the voltage and current sensors, therefore to reduce the system cost. Simulation result shows the performance of the fuzzy MPPT and the dynamic of hybrid system under changes of irradiation and wind speed in different operating mode. Hence, the proposed system allows reducing the cost by comparing it to a separate system, hybrid system without sensorless, or sensorless method based on P&O algorithm.
References
[1] B.Chitti Babu , K.B.Mohanty, ”Doubly-Fed Induction Generator for Variable Speed Wind Energy Conversion Systems,
International Journal of Computer and Electrical Engineering,
Vol. 2, No. 1, February, 2010, Pages 1793-8163, February, 2010.
[2] M. El Azzaoui, H. Mahmoudi, ”Modeling and control of a doubly fed induction generator base wind turbine system optimization of the power,” Journal of Theoretical and Applied Information
Technology,, Vol 80, No 2, pp 304-314 October 2015.
[3] Lalit Kumar Goel and Sasi K Kottayil and Rajesh K. and A.D. Kulkarni and T. Ananthapadmanabha, ”SMART GRID TECHNOLOGIES Modeling and Simulation of Solar PV and DFIG Based Wind Hybrid System,” Procedia Technology, volume 21, pages 667-675, 2015.
[4] Gan, C., Prayun, W., Tan, C., Shamshiri, M., Design of a Hybrid Diesel/PV/Wind/Battery System in Remote Areas, (2014)
International Review of Electrical Engineering (IREE), 9 (2), pp.
420-430.
[5] Siti, M., Tiako, R., Optimal Energy Control of a Grid-Connected Solar Wind-Based Electric Power Plant Applying Time-of-Use Tariffs, (2015) International Review of Electrical Engineering
(IREE), 10 (5), pp. 653-661.
[6] Afif, B., Chaker, A., Benhamou, A., Sizing of Optimal Case of Standalone Hybrid Power System Using Homer Software, (2017)
International Review of Automatic Control (IREACO), 10 (1), pp.
23-32.
[7] Danvu Nguyen, Goro Fujita, Analysis of sensorless MPPT method for hybrid PVWind system using DFIG Wind Turbines,
Sustainable Energy, Grids and Networks, volume 5, pages 50-57,
2016.
[8] Hyeonah Park and Hyosung Kim, ”PV cell modeling on single-diode equivalent circuit,” Industrial Electronics Society, IECON
2013 - 39th Annual Conference of the IEEE, Vienna, pp.
1845-1849, 2013.
[9] A. Babaie Lajimi, S. Asghar Gholamian, M. Shahabi, Modeling and Control of a DFIG-Based Wind Turbine During a Grid Voltage Drop, Engineering, Technology & Applied Science
Research, Vol. 1, No. 5, Pages 121-125, 2011.
[10] Md. Arifujjaman, M.T. Iqbal, John E. Quaicoe, Vector control of a DFIG wind turbine, Journal of electrical & electronics
engineering, Vol 9, No 2, pp. 1057-1066, 2009.
[11] J. Lopez, P. Sanchis, X. Roboam and L. Marroyo, Dynamic Behavior of the Doubly Fed Induction Generator During Three-Phase Voltage Dips, IEEE Transactions on Energy Conversion, vol. 22, no. 3, pp. 709-717, Sept. 2007.
[12] M. Pucci and M. Cirrincione, Neural MPPT control of wind generators with induction machines without speed sensors, IEEE
Trans. Ind. Elec., vol. 58, no. 1, pp.37-47, Jan 2011.
[13] Lawrence Kiprono Letting, Design and Implementation of a
Fuzzy Logic Based Maximum Power Point Tracker for a Photovoltaic System, A thesis submitted in partial fulfillment for
the degree of Master of Science in Electrical Engineering in the Jomo Kenyatta University of Agriculture and Technology, 2008. [14] Buonomo, S., Musumeci, S., Pagano, R., Porto, C., Raciti, A.,
Scollo, R., Driving a mew monolithic cascode device in a dc-dc converter application, (2008) IEEE Transactions on Industrial
Electronics, 55 (6), pp. 2439-2449.
[15] Chimento, F., Musumeci, S., Raciti, A., Sapuppo, C., Di Guardo, M., A control algorithm for power converters in the field of photovoltaic applications, (2007) 2007 European Conference on
Power Electronics and Applications, EPE, art. no. 4417291, .
[16] Attaianese, C., Monaco, M.D., Nardi, V., Tomasso, G., Dual inverter for high efficiency PV systems, (2009) 2009 IEEE
International Electric Machines and Drives Conference, IEMDC
'09, art. no. 5075298, pp. 818-825.
[17] Attaianese, C., Di Monaco, M., Tomasso, G., Phase Three-Level active NPC converters for high power systems, (2010)
SPEEDAM 2010 - International Symposium on Power Electronics, Electrical Drives, Automation and Motion, art. no.
5542195, pp. 204-209.
[18] Musumeci, S., Pagano, R., Raciti, A., Frisina, F., Melito, M., Transient behavior of IGBTs submitted to fault under load conditions, (2002) Conference Record - IAS Annual Meeting
(IEEE Industry Applications Society), 3, pp. 2182-2189.
Authors’ information
Power Electronics and Control Team, Department of Electrical Engineering, Mohammadia School of Engineers, Mohammed V University, Rabat, Morocco.
Marouane El Azzaoui was born in Khenifra,
M. El Azzaoui, H. Mahmoudi, K. Boudaraia
Copyright © 2017 Praise Worthy Prize S.r.l. - All rights reserved International Review on Modelling and Simulations, Vol. 10, N. 3
Hassane Mahmoudi was born in Meknes,
Morocco, on January 4, 1959. He received B.S degree in electrical engineering from Mohammadia School of Engineers, Rabat, Morocco, in 1982, and the Ph.D degree in power electronic from Montefiore institue of electrical engineering, Luik, Belgium, in 1990. He was an Assistant Professor of physics, at the Faculty of sciences, Meknes, Morocco, from 1982 to 1990. Since 1992, he has been a Professor at the Mohammadia Schools of engineers, Rabat, Morocco, and he was the Head of Electric Engineering Department during four years (1999, 2000, 2006 and 2007). His research interests include static converters, electrical motor drives, active power filters and the compatibility electromagnetic.
Karima Boudaraia was born in fez Morocco on
International Review on Modelling and Simulations (I.RE.MO.S.), Vol. 10, N. 3
ISSN 1974-9821 June 2017
Analysis of Flashover Induced by Transient Current
During Multiple Lightning Strokes on a Train
Kelvin M. Minja, Pius V. Chombo, Narupon Promvichai, Boonruang Marungsri
Abstract
– Power system outage due to the occurrence of flashover (across insulators) whenlightning induced voltages exceed insulators’ voltage withstand capabilities have been a major investigation in recent studies. Since the Overhead catenary system uses overhead power lines which are exposed to lightning incidences, the concerns have been made in protection against lightning strikes. The knowledge of lightning and its most influential parameters are of great importance in the safe and reliable operation of the Overhead catenary system. In this work, analysis of flashover when lightning strikes on train’s pantograph at the mast and between two masts were studied. Furthermore, the effects of the magnitude, waveforms, polarity, multiplicity and grounding resistance were investigated. In this task, the impact of lightning parameters has been achieved with computer simulation tool (ATPDraw). It was shown that the negative multiple lightning of magnitude - 34 kA and above leads flashover when strikes on pantograph at the mast and between two masts. However, the grounding resistance was recognized to have higher predominance in mast induced voltages when a lightning strike occurs at the mid-span unlike along the mast. Hence, the lightning protection design should consider the multiplicity of negative lightning strokes outcome from the point of hitting. Copyright © 2017 Praise Worthy Prize S.r.l. -
All rights reserved.
Keywords:
Catenary, Multiple Lightning Strokes, Flashover, Grounding Resistance, ATP DrawNomenclature
Ax Auxiliary line
Rt Return line
Ct Catenary line
X1 S-Rail
X2 I-Rail
X3 Catenary line with composite insulator
X4 Return line with spool insulator
X5 Auxiliary line with pin insulator
R1 Radius between mast and auxiliary line
R2 Radius between mast and return line
R3 Radius between mast and catenary line
H Height of the mast
L1 Vertical distance between auxiliary and return line
L2 Vertical distance between return and catenary line
L3 Distance between catenary line and ground
Zaux Impedance of the auxiliary line Zreturn Impedance of the return line Zcatenary Impedance of the catenary line Rf Mast grounding resistance
IU International unit
I.
Introduction
Until now, catenary contact system has become more useful for feeding traction power to electric vehicle [1]-
[6]. In spite of modernization in the electrified railway system, lightning has been a crucial problem in the overhead catenary system [1]-[2]. Statistically, most of the power system outage caused by transient current characteristics are due to lightning strokes [1], [7]-[9]. A power system failure of the overhead catenary system is triggered by direct lightning strokes to phase conductor, shielding wire and ground in line proximity [1], [10]. However, lightning strokes on phase conductor influence dynamic overvoltages, which can disturb the stability of system to a great extent [9]-[11]. It has been reported that when induced overvoltage overreach insulation withstands capability, lightning flashover across insulators occurs [2]. Many works have been performed to estimate the lightning strokes consequences in the overhead catenary system [1], [3]-[4], [12]-[17].
Kelvin M. Minja, Pius V. Chombo, Narupon Promvichai, Boonruang Marungsri
Copyright © 2017 Praise Worthy Prize S.r.l. - All rights reserved International Review on Modelling and Simulations, Vol. 10, N. 3 simulation software [1], [3]-[4], [13]-[14], [16]-[17]. But
the analyses from these studies were done in single lightning strokes without regard to the enforcement of multiple lightning strokes. Consequently, it is important to analyze characteristics of transient current during multiple lightning strokes in different waveforms and grounding resistance before establishing lightning protection design.
In this study, the effects of grounding resistance in transient current waveforms of multiple lightning strokes are investigated. The transient conditions are simulated using ATPDraw due to it is the capability for solving the electromagnetic transient problem [3]-[4], [9], [14], [18]-[23]. The characteristics depend on the amplitude of transient current during negative multiple lightning strokes on pantograph are examined.
II.
Background
A nominal voltage of 25 kV AC-50 Hz is normally used in the railway traction power system [24]. The conductor arrangement in the double-track overhead catenary system on Thai elevated railway system is shown in Figs. 1-2.
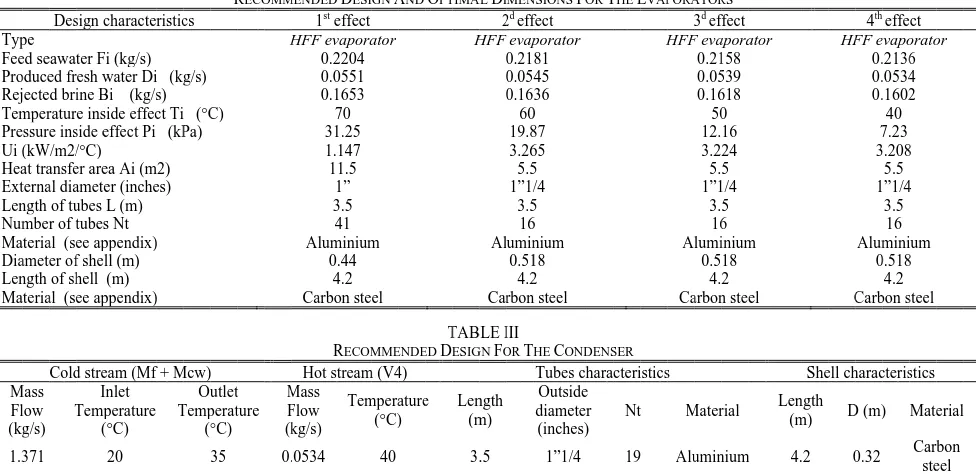
The line of 480 m was accompanied by seven masts with 60 m spacing in the simulation. This line was selected between Phayathai and Rajaprarop (see Fig. 3). The supply voltage was injected at both end points of the line. The negative multiple lightning strokes on train’s pantograph were taken as much concern as it strikes on phase conductor.
The pantograph was considered when it is at the Mast (seventh Mast) for Case 1 as shown in Fig. 1 and at the mid-span of Masts (sixth and seventh Masts) for Case 2 as shown in Fig. 2. The lightning sources were presented by the magnitudes of -34 kA, and -50 kA with 1/30.2 µs, 1.2/50 µs, 2/77.5 µs and 3/75 µs waveforms as in [18]. The elevated poles resistance of 50 Ω and grounding resistances of 5, 10, 20, 30, 40, 50, 70, 80, 90 and 100 Ω were used.
Fig. 1. Lightning strike on train’s pantograph at the Mast
Fig. 2. Lightning strike on train’s pantograph at the mid-span of Masts
Fig. 3. Airport Rail link line in Thailand [25]
III.
Catenary Contact System
III.1. Railway Transmission Line
Kelvin M. Minja, Pius V. Chombo, Narupon Promvichai, Boonruang Marungsri
view of the electrified railway system of a double-track elevated rail system and mast configuration parameters of 2×25 kV AC, 50 Hz from [15] are presented.
TABLEI
DETAILS OF 25 KVTRANSMISSION LINE FOR ELECTRIFIED RAILWAY [2],[13]
Conductors Radius
Catenary (X3) 5.06 cm
Return (X4) 0.82 cm
Auxiliary (X5) 0.56 cm
Ruling span between Masts 60 m
Railway Radius
S-rail (X1) 4.95 cm
I-rail (X2) 4.95 cm
Insulators Impulse Withstand Voltage (MV)
Composite (X3) 0.225
Spool (X4) 0.060
Pin (X5) 0.140
Ground System
Grounding resistance 5 - 100 Ω
Elevated Pole Resistance 50 Ω
Fig. 4. Railway Transmission lines data in ATPDraw
Fig. 5. Cross-section view axis of Railway Electrification system on Double Track elevated railway system [15]
III.2. Multiple Lightning Source
Since the disastrous potency of multiple lightning was aimed in the study, some parameters were set in the
ATPDraw models to characterize its behavior. Following the most occurring tendency of negative lightning strokes in Thailand [18], the magnitude of lightning current was considered with a negative polarity.
Although the report of [18] showed the lightning magnitude to range from -10 kA to -139 kA, but only -34 kA and -50 kA were used in this study.
Furthermore, three strokes per flash with intervals of 1ms were used to represent multiplicity as considered in [19], [21]-[22].
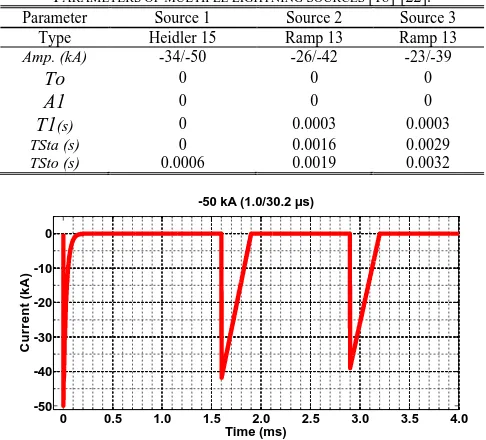
The first stroke was modeled with Heidler ideal source at time duration of 0.6 ms; the second and third strokes were designed with two slope Ramp Type 13 at time duration of 0.3 ms for each in ATPDraw. Other parameters of multiple lightning sources are given in Table II.
Fig. 6 illustrates the waveform of the first, second and third strokes of the lightning current with the magnitude of -50 kA.
TABLEII
PARAMETERS OF MULTIPLE LIGHTNING SOURCES [18]-[22]. Parameter Source 1 Source 2 Source 3
Type Heidler 15 Ramp 13 Ramp 13
Amp. (kA) -34/-50 -26/-42 -23/-39
To 0 0 0
A1 0 0 0
T1(s) 0 0.0003 0.0003
TSta (s) 0 0.0016 0.0029
TSto (s) 0.0006 0.0019 0.0032
0 0.5 1.0 1.5 2.0 2.5 3.0 3.5 4.0
-50 -40 -30 -20 -10 0
Time (ms)
C
u
rr
e
n
t
(k
A
)
-50 kA (1.0/30.2 µs)
Fig. 6. Waveform of the 1st, 2nd and 3rd strokes of the lightning current with the magnitude of -50 kA and waveform of 1.0/30.2 µs
in ATPDraw
III.3. Mast and Insulator
The cylindrical geometric model in single wave impedance was used to represent the mast model. In the literature of [4] and [27], this model was mostly explained to be recommended by IEEE and CIGRE. Hence, this model as given in [4] was taken to represent the mast.
Kelvin M. Minja, Pius V. Chombo, Narupon Promvichai, Boonruang Marungsri
Copyright © 2017 Praise Worthy Prize S.r.l. - All rights reserved International Review on Modelling and Simulations, Vol. 10, N. 3 Moreover, Fig. 5 depicts the values of R for catenary,
auxiliary and return lines. The results of computed impedances from (1) have been summarized in Table III. In ATPDraw, the mast was designed by using Linezt_1.sup model. With this type, line impedances and their corresponding heights from the ground were assigned to represent the mast.
Three types of insulators used for supporting three lines in the mast are given in Table I. Since in ATPDraw an insulator is represented by a capacitor in parallel with voltage controlled switch [28], the values of withstanding capability to be assigned to the switch for each insulation was taken from Table I.
From [2], composite, pin and spool insulators were shown to have ten, five and one units per insulator respectively. As discussed in [14], the capacitance of 8.8 pF was given for eleven units of a silicone insulator. Then a Switchvc.sup model was used to incorporate the values of voltage withstands capability and capacitances when simulating in ATPDraw:
60 0 5 R
Z ln cot . arctan
H
(1)
where:
Z is the surge impedance; its IU is Ω;
R is the equivalent radius of the mast; its IU is m; H is the height of the mast; its IU is m.
TABLEIII MAST MODELED PARAMETERS
Location Parameters
Auxiliary Zaux = 159.85 Ω, L1= 2.5 m, R1 = 1.12 m, H = 8 m
Return Zreturn = 293.57 Ω, L2 = 0.2 m, R2 = 0.12 m, H = 8 m
Catenary Zcatenary = 112.79 Ω, L3= 5.3 m, R3 = 2.5 m, H = 8 m
III.4. Train Model
A three-car train which consists of the pantograph, locomotive transformer, diode bridge rectifier and two DC motors was used to represent the design of an electric locomotive train. The rectifier bridge is represented by the parallel RC elements and the series resistance of the diodes.
A series reactor is connected between the motor and the rectifier bridge in order to smooth the direct current [29].
The system of the electric locomotive train with components mentioned above is shown in Figs.8-9 as presented in [29]-[30]. Since the study is performed when the pantograph of a powertrain is at the mast and the mid-span of masts, Figs. 7-8 show an electric locomotive train positioned across the mast and mid-span respectively.
As shown in Fig. 8, a railway transmission line has a span of 60 meters and 50 Ω resistance of elevated pole. Furthermore, grounding resistances of 5, 10, 20, 30, 40, 50, 70, 80, 90 and 100 Ω were taken to represent different soil profiles.
Fig. 7. An electric locomotive train across the mast
Fig. 8. An electric locomotive train at the mid-span of Masts
IV.
Results and Discussion
The simulation results of peak mast induced voltages across the insulators in the auxiliary, return, and catenary lines are shown in Figs. 9-16 for case 1 and Figs. 17-24 for case 2.
5 10 20 30 40 50 60 70 80 90 100
-0.6 -0.8 -1.0 -1.2 -1.4 -1.6 -1.8
Grounding Resistance ()
M
a
s
t
In
d
u
c
e
d
V
o
lt
a
g
e
(
M
V
)
-34 kA (1.0/30.2 s)
Catenary line Return line Auxiliary line
Kelvin M. Minja, Pius V. Chombo, Narupon Promvichai, Boonruang Marungsri
Grounding Resistance ()
M
Catenary line Return line Auxiliary line
Fig. 10. Mast induced voltages in Case 1 with -34 kA (1.2/50 µs)
5 10 20 30 40 50 60 70 80 90 100
Grounding Resistance ()
M
Catenary line Return line Auxiliary line
Fig. 11. Mast induced voltages in Case 1 with -34 kA (2/77.5 µs)
5 10 20 30 40 50 60 70 80 90 100
Grounding Resistance ()
M
Catenary line Return line Auxiliary line
Fig. 12. Mast induced voltages in Case 1 with -34 kA (3/75 µs)
5 10 20 30 40 50 60 70 80 90 100
-1.0 -1.5 -2.0 -2.5
Grounding Resistance ()
M
Catenary line Return line Auxiliary line
Fig. 13. Mast induced voltages in Case 1 with -50 kA (1.0/30.2 µs)
5 10 20 30 40 50 60 70 80 90 100
-1.0 -1.5 -2.0 -2.5
Grounding Resistance ()
M
Catenary line Return line Auxiliary line
Fig. 14. Mast induced voltages in Case 1 with -50 kA (1.2/50 µs)
5 10 20 30 40 50 60 70 80 90 100
-1.0 -1.5 -2.0 -2.5
Grounding Resistance ()
M
Catenary line Return line Auxiliary line
Fig. 15. Mast induced voltages in Case 1 with -50 kA (2/77.5 µs)
5 10 20 30 40 50 60 70 80 90 100
Grounding Resistance ()
M
Catenary line Auxiliary line Return line
Fig. 16. Mast induced voltages in Case 1 with -50 kA (3/75 µs)
5 10 20 30 40 50 60 70 80 90 100
Grounding Resistance ()
M
Catenary line Return line Auxiliary line
Fig. 17. Mast induced voltages in Case 2 with -34 kA (1.0/30.2 µs)
5 10 20 30 40 50 60 70 80 90 100
Grounding Resistance ()
M
Catenary line Return line Auxiliary line
Fig. 18. Mast induced voltages in Case 2 with -34 kA (1.2/50 µs)
5 10 20 30 40 50 60 70 80 90 100
-0.6 -0.8 -1.0 -1.2
Grounding Resistance ()
M
Catenary line Return line Auxiliary line
Kelvin M. Minja, Pius V. Chombo, Narupon Promvichai, Boonruang Marungsri
Grounding Resistance ()
M
Catenary line Return line Auxiliary line
Fig. 20. Mast induced voltages in Case 2 with -34 kA (3/75 µs)
5 10 20 30 40 50 60 70 80 90 100
-1.0 -1.5 -2.0
Grounding Resistance ()
M
Catenary line Return line Auxiliary line
Fig. 21. Mast induced voltages in Case 2 with -50 kA (1.0/30.2 µs)
5 10 20 30 40 50 60 70 80 90 100
-1.0 -1.5 -2.0
Grounding Resistance ()
M
Catenary line Return line Auxiliary line
Fig. 22. Mast induced voltages in Case 2 with -50 kA (1.2/50 µs)
5 10 20 30 40 50 60 70 80 90 100
-1 -1.2 -1.4 -1.6
Grounding Resistance ()
M
Catenary line Return line Auxiliary line
Fig. 23. Mast induced voltages in Case 2 with -50 kA (2/77.5 µs)
5 10 20 30 40 50 60 70 80 90 100
-0.8 -1.0 -1.2 -1.4
Grounding Resistance ()
M
Catenary line Return line Auxiliary line
Fig. 24. Mast induced voltages in Case 2 with -50 kA (3/75 µs)
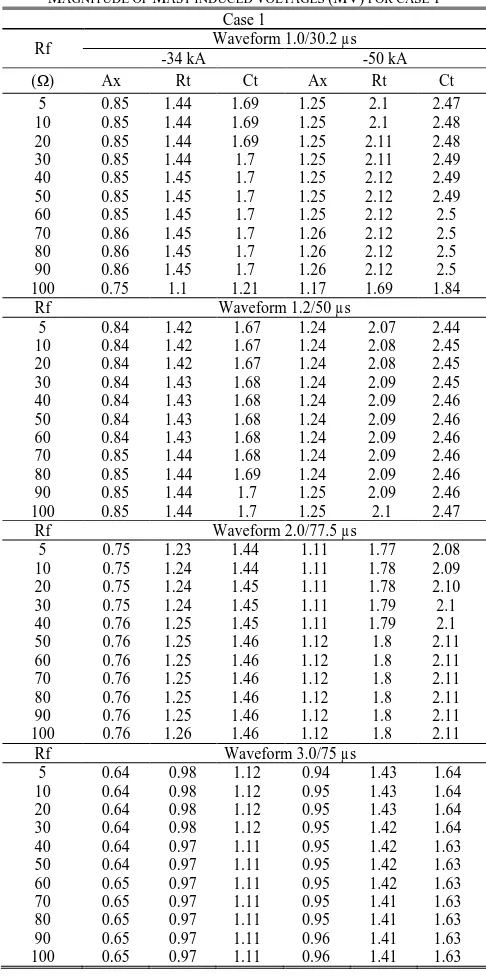
The amplitude values of Mast induced voltages in catenary (Ct), auxiliary (Ax) and return (Rt) lines for Case one and two are recapitulated in Tables IV-V. The values in Tables IV-V were obtained after being analyzed the data from the Figs. 9-24. The 1st row details the cases as explained from Figs. 1-2 and Figs. 7-8. The 2nd, 16th, 28th, and 40th rows start from the 2nd column illustrate the type of waveforms. The 3rd row starts from the 2nd column gives the magnitude of multiple lightning strokes that have been used. The 1st column starts from the 2nd row shows the ground resistances that have been exploited. The 2nd to the 4th column and the 5th to the 7th column start from the 4th row indicate the magnitude of mast induced voltages in different lines of an overhead catenary system for 34 kA and 50 kA respectively.
Kelvin M. Minja, Pius V. Chombo, Narupon Promvichai, Boonruang Marungsri
TABLEV
MAGNITUDE OF MAST INDUCED VOLTAGES (MV) FOR CASE 2 Case 2
Rf Waveform 1.0/30.2 µs -34 kA -50 kA (Ω) Ax Rt Ct Ax Rt Ct
5 0.71 1.09 1.2 1.12 1.65 1.81 10 0.72 1.09 1.2 1.13 1.65 1.82 20 0.72 1.09 1.2 1.14 1.66 1.82 30 0.73 1.09 1.2 1.14 1.66 1.82 40 0.73 1.1 1.2 1.15 1.67 1.83 50 0.73 1.1 1.21 1.15 1.67 1.83 60 0.74 1.1 1.21 1.16 1.67 1.83 70 0.74 1.1 1.21 1.16 1.68 1.84 80 0.74 1.1 1.21 1.17 1.68 1.84 90 0.75 1.1 1.21 1.17 1.68 1.84 100 0.75 1.1 1.21 1.17 1.69 1.84
Rf Waveform 1.2/50 µs
5 0.71 1.07 1.17 1.11 1.62 1.78 10 0.71 1.07 1.17 1.11 1.62 1.78 20 0.71 1.07 1.18 1.12 1.63 1.78 30 0.72 1.07 1.18 1.13 1.63 1.79 40 0.72 1.07 1.18 1.13 1.63 1.79 50 0.72 1.07 1.18 1.14 1.64 1.79 60 0.73 1.08 1.18 1.15 1.64 1.80 70 0.73 1.08 1.18 1.16 1.67 1.80 80 0.73 1.08 1.18 1.17 1.69 1.80 90 0.73 1.08 1.19 1.17 1.7 1.81 100 0.74 1.08 1.19 1.18 1.71 1.81
Rf Waveform 2.0/77.5 µs
5 0.65 0.94 0.99 1.01 1.45 1.52 10 0.65 0.93 0.99 1.02 1.45 1.53 20 0.66 0.95 1 1.03 1.46 1.54 30 0.66 0.96 1.01 1.03 1.47 1.55 40 0.67 0.97 1.02 1.04 1.48 1.56 50 0.67 0.97 1.02 1.04 1.49 1.57 60 0.67 0.98 1.03 1.05 1.5 1.58 70 0.67 0.98 1.03 1.05 1.51 1.59 80 0.68 0.99 1.04 1.05 1.52 1.6 90 0.68 0.99 1.04 1.05 1.52 1.6 100 0.68 0.99 1.05 1.06 1.53 1.61
Rf Waveform 3.0/75 µs
5 0.85 1.44 1.69 1.25 2.1 2.47 10 0.85 1.44 1.69 1.25 2.1 2.48 20 0.85 1.44 1.69 1.25 2.11 2.48 30 0.85 1.44 1.7 1.25 2.11 2.49 40 0.85 1.45 1.7 1.25 2.12 2.49 50 0.85 1.45 1.7 1.25 2.12 2.49 60 0.85 1.45 1.7 1.25 2.12 2.5 70 0.86 1.45 1.7 1.26 2.12 2.5 80 0.86 1.45 1.7 1.26 2.12 2.5 90 0.86 1.45 1.7 1.26 2.12 2.5 100 0.75 1.1 1.21 1.17 1.69 1.84
In the following sections, two different cases are discussed.
IV.1. The Effects of Negative Multiple Lightning Strokes on Train’s Pantograph at the Mast.
Results of mast induced voltages in Case 1 for -34 kA and -50 kA are shown in Figs. 9-16, and summarized in Table IV. It can be noted that the mast induced voltages were above withstand capabilities of line insulators for both catenary, auxiliary, and return lines. Marungsri et al. [18] studied about back flashover affected by tower grounding resistance and concluded that the shorter the waveform, the higher is the tower induced voltages. As seen in Figs. 9-12, it can be clearly observed that the
shortest waveform has the highest mast induced voltages in Catenary, Auxiliary, and Return line as well.
It can also be found that an increase in lightning magnitude from -34 kA to -50 kA resulted into increase in mast induced voltage (see Figs. 9-16). However, flashover was early observed with -34 kA which meant a flashover occurred from -34 kA and above with negative multiple lightning strokes. Furthermore, grounding resistance showed less significance in the performance of multiple lightning. Therefore, when the pantograph is stroke by negative multiple lightning along the mast, flashover was seemed to occur from -34 kA and above, in all waveforms and all grounding resistance. Apart from the occurrence of flashover, the catenary line was appeared to have the highest level of mast induced voltage compared to other lines as shown in Tables IV-V.
IV.2. The Effects of Negative Multiple Lightning Strokes on Train’s Pantograph
at the Mid-Span of Masts
Results of mast induced voltages in Case 2 for -34 kA and -50 kA are given from Figs. 17-24. Table V illustrates the summary of induced voltages in the catenary, auxiliary, and return lines. As depicted in Figs. 17-20, It can be observed that the mast induced voltages are above withstand capabilities of line insulators for both catenary, auxiliary, and return lines. The same results were seen in Figs. 21-24 for -50 kA. Although the effects of lightning magnitude and shorter waveform were also seen as in Case 1 but grounding resistance showed the significant contribution to the flashovers in Case 2. In general, flashover was seemed to occur from -34 kA and above, in all waveforms and all grounding resistance when the pantograph is stroke by negative multiple lightning at the mid-span. Again, the catenary line was seemed to have the highest mast induced voltage amongst the lines (see Table V).
V.
Conclusion
The following have been summarized for the conclusion:
It is noticed that negative multiple lightning of magnitude -34 kA and above may cause flashover when strikes the pantograph along the mast or at the mid-span.
The grounding resistance is observed to have a higher influence in mast induced voltages when a lightning stroke occurs at the mid-span compared with along the mast.
All waveforms resulted into flashovers although shorter waveforms displayed more top mast induced voltages. Therefore, negative multiple lightning of any waveform can lead into flashover.
Kelvin M. Minja, Pius V. Chombo, Narupon Promvichai, Boonruang Marungsri
Copyright © 2017 Praise Worthy Prize S.r.l. - All rights reserved International Review on Modelling and Simulations, Vol. 10, N. 3 occurred when lightning strokes the pantograph along
the mast.
Flashovers have been noticed with multiple strokes from -34kA and above in all waveforms and grounding resistances compared to single strokes in literature, this needs considerable attention in designing insulation and protection systems.
Acknowledgements
The authors gratefully appreciate the support of High Voltage Insulation Technology Laboratory of Suranaree University of Technology, Thailand.
References
[1] T. Chmielewski, A. Dziadkowiec, Simulations of Fast Transients in typical 25 kV a.c. railway power supply system, Seminarium
ZASTOSOWANIE KOMPUTERÓW W NAUCE I TECHNICE
2013, Gdańsk, Polska, Vol. 23(No. 36):43-46, 2013.
[2] F. Kiessling, R. Puschmann, A. Schmieder, E. Schneider, 2Ed,
Contact Lines for Electrical Railways: Planning - Design - Implementation – Maintenance (Siemens Aktiengesellschaft,
Berlin and Murnich, 2009).
[3] S. Pastromas, A. Papamikou, G. Peppas, E. Pyrgioti, Investigation of grounding resistance effect on the MV grid of Hellenic electromotive railway during lightning strikes, 33rd International
Conference on Lightning Protection, pp. 1-7, 2016.
[4] Y. Yang, and Y. Zhang, Research on Lightning Protection Simulation of High-speed Railway Catenary Based on ATP-EMTP, Journal of information & Computation Science, Vol. 12(Issue 4):1511-1521, 2015.
[5] Imed, M., Mourad, F., Habib, R., Study and design of a hybrid linear actuator for a railway system, (2010) International Review
on Modelling and Simulations (IREMOS), 3 (5), pp. 791-795.
[6] Barrero, R., Hegazy, O., Lataire, P., Coosemans, T., Van Mierlo, J., An accurate multi-train simulation tool for energy recovery evaluation in DC rail networks, (2011) International Review on
Modelling and Simulations (IREMOS), 4 (6), pp. 2985-3003.
[7] R. Bhattarai, R. Rashedin, S. Venkatesan, A. Haddad, H. Griffiths, N. Harid, Lightning performance of 275 kV Transmission Lines, 43rd International Universities Power
Engineering Conference, pp. 1-5, 2008.
[8] IEEE Std. 1100, IEEE Recommended Practice for Powering and Grounding Electronic Equipment, IEEE Standards, 1999. [9] P. Lertwanitrot, P. Kettranan, P. Itthisathienkul, A. Ngaopitakkul,
Characteristics and Behaviour of Transient Current during Lightning Strikes on Transmission Tower, Proceedings of the
International MultiConference of Engineers and Computer Scientists 2015(IMECS 2015), Vol 2, pp. 708-713, Hong Kong,
March 2015.
[10] IEEE Std. 1313.2, IEEE Guide for the Application of Insulation Coordination, IEEE Standards, 1999.
[11] P.N. Mikropoulos and T.E. Tsovilis, Estimation of the shielding performance of overhead transmission lines: the effects of lightning attachment model and lightning crest current distribution, IEEE Transactions on Dielectrics and Electrical
Insulation, Vol. 19(No. 6):2155-2164, 2012.
[12] H. Lingohr, U. Stahlberg, B. Ritchter, and V. Hinrichsen, Overvoltage protection design for DC railways, Elektrische
Bahnen, Vol. 101(No. 7):315-320, 2003.
[13] Ziya Mazloom, Multi-conductor transmission line model for
electrified railways: A method for responses of lumped devices,
Ph.D. dissertation, KTH Electrical Engineering University, Stockholm, Sweden, 2010.
[14] F. Achouri, I. Achouri, M. Khamliche, Protection of 25 kV Electrified Railway System, 4th International Conference on Electrical Engineering(ICEE), pp. 1-6, 2015.
[15] A. Andreotti, U. D. Martinis, A. Pierno, V. A. Rakov, A New Tool for Lightning Induced Voltage Calculations: CiLIV, General
Assembly and Scientific Symposium (URSI GASS), 2014 XXXIth URSI, pp. 1-4, August 2014.
[16] J. Liu, and M.G. Liu, Improved electro-geometric model for estimating lightning outage rate of catenary, IET Electrical
Systems in Transportation, Vol. 2(Issue 1):1-8, 2012.
[17] A.V. Wanjari, Effect of Lightning on the Electrified Transmission Railway System, International Journal of Advance Research in
Electrical, Electronics and Instrumentation Engineering, Vol.
3(Issue. 7):10663-10671, 2014.
[18] B. Marungsri, S. Boonpoke, A. Rawangpai, A. Oonsivilai, and C. Kritayakornupong, Study of Tower Grounding Resistance Effected Back Flashover to 500kV Transmission Line in Thailand by using ATP/EMTP, International Journal of Electrical,
Computer, Energetic, Electronic and Communication Engineering, Vol. 2(No. 6):1061-1068, 2008.
[19] M.A. Omidiora, M. Lehtonen, Performance of Surge Arrester to Multiple Lightning Strokes on Nearby Distribution Transformer,
Proceedings of the 7th WSEAS International Conference on Power Systems, pp. 59-65, Beijing, China, September 2007.
[20] J.A. Martinez-Velasco, and F.C. Aranda, EMTP Implementation of a Monte Carlo Method for Lightning Performance Analysis of Transmission Lines, Ingeniare. Revista chilena de ingeniería, Vol. 16(No. 1):169-180, 2008.
[21] M.A. Omidiora, M. Lehtonen, Simulation of Combined Shield Wire and MOV Protection on Distribution Lines in Severe Lightning Areas, Proceedings of the World Congress on
Engineering and Computer Science, San Francisco, USA, October 2007.
[22] J. C. Das, Analysis and control of large-shunt-capacitor-bank switching transients, in IEEE Transactions on Industry
Applications, vol. 41, no. 6, pp. 1444-1451, Nov.-Dec. 2005.
[23] Sarajcev, P., Wind farm surge arresters energy capability and risk of failure analysis, (2010) International Review on Modelling and
Simulations (IREMOS), 3 (5), pp. 926-937.
[24] IEC 60850, Railway Applications – Supply Voltages of Traction Systems, International Electrotechnical Commission standard,
2014.
[25] UMIASEA, Thailand’s Railway Industry-Overview and Opportunities for Foreigners Businesses, (Thailand: UMI Asia Ltd, 2014, pp. 126-142).
[26] Kalantari, M., Sadeghi, M.J., Farshad, S., Fazel, S.S., Modeling and comparison of traction transformers based on the utilization factor definitions, (2011) International Review on Modelling and
Simulations (IREMOS), 4 (1), pp. 342-351.
[27] Y Zhang, W. Sima, and Z. Zhang, Summary of the study of tower models for lightning protection analysis, High Voltage
Engineering, Vol. 32(No. 7):93-97, 2006.
[28] A. F. Imece, D. W. Durbak, H. Elahi, S. Kolluri, A. Lux, D. Mader, T. E. McDemott, A. Morched, A. M. Mousa, R. Natarajan, L. Rugeles, and E. Tarasiewicz, Modeling Guidelines for Fast Front Transients, IEEE Transactions on Power Delivery, Vol.
11(No. 1):493-506, January 1996.
[29] A. Zupan, A.T. Teklić, B. Filipović-Grčić, Modeling of 25 kV Electric Railway System for Power Quality Studies, EuroCon
2013.Zagreb, Croatia, pp. 844-849, July 2013.
[30] Mustafa KaragÖz, Analysis of the Pantograph Arcing and Its
Effect of the Railway Vehicle, Master Degree dissertation, Middle
East Technical University, January 2014.
Authors’ information
School of Electrical Engineering, Suranaree University of Technology 111 University Avenue, Nakhon Ratchasima 30000, Thailand.
Kelvin Melckzedeck Minja was born in Tanga,
Kelvin M. Minja, Pius V. Chombo, Narupon Promvichai, Boonruang Marungsri
Pius Victor Chombo has obtained his B.Eng.
Degree in Electrical Engineering from Dar es Salaam Institute of Technology, Tanzania in 2013.He is now a master’s degree student in the School of Electrical Engineering, the Suranaree University of Technology in Thailand. His interest research topics include High Voltage Systems Design and Monitoring, Laboratory and System Programming.
Narupon Promvichai has obtained his B.Eng.
Degree in the School of Electrical Engineering, the Suranaree University of Technology in Thailand, 2015. He is now a master’s degree student in the School of Electrical Engineering, the Suranaree University of Technology in Thailand.
Boonruang Marungsri was born on 1973 in
International Review on Modelling and Simulations (I.RE.MO.S.), Vol. 10, N. 3
ISSN 1974-9821 June 2017
Copyright © 2017 Praise Worthy Prize S.r.l. - All rights reserved https://doi.org/10.15866/iremos.v10i3.8690
Performance Analysis of a Wind Turbine
Based on a Self-Excited Induction Generator (SEIG)
Abdallah Belabbes
1, Mohamed Bouhamida
1, Allal El Moubarek Bouzid
1, Mustapha Benghanem
1,
Mohamed Della-Krachai
1, Mamadou Lamine Doumbia
2Abstract
– In this paper, magnetic saturation effect of on the self-excited generator (SEIG) usedin the micro-grid system is investigated. The effect of the reduction of the electrical quantities generated voltage and its frequency following a purely resistive or inductive balanced or unbalanced load connection are studied in detail. A dynamic model of SEIG in the fixed reference axis dq is developed and simulated using Simulink / Matlab. The results of the simulations of different scenarios are discussed, and conclusions are deduced at the end of this article. These results will be used to study the stability of a micro-grid under a RT-LAB simulator in the future.
Copyright © 2017 Praise Worthy Prize S.r.l. - All rights reserved.
Keywords:
Renewable Energy, Induction Generator, Islanded Wind, Modeling, Self-Excited Induction GeneratorNomenclature
, Stator, Rotor d-axis voltages
, Stator, Rotor d-axis currents
, Stator, Rotor q-axis voltages
, Stator, Rotor q-axis currents Magnetizing Inductance
, Stator, Rotor Inductances Magnetizing current Electromagnetic Torque Number of poles
, Stator, Rotor resistance
Per phase terminal excitation capacitance , Load Resistance/ Inductance per phase
Angular speeds of Rotor
, d-q axes load voltage per phase
, d-q axes load current per phase
, d-q axes capacitor voltage per phase
, d-q axes capacitor currents per phase Shaft load torque
Multiplier of speed Mechanical input power Wind velocity
Blade angle
Radius of the wind turbine Air density
I.
Introduction
The gradual increase in oil prices combined with the hope to reduce oil consumption over the next 50 years have forced researchers to focus their attention to the production of green electricity as an alternative power
source [1]-[22]. Wind is a renewable energy because it is a clean and abundant resource that can generate electricity with virtually no emissions of polluting gases. The application of asynchronous generator is more and more extensive [19]-[22]. Especially, the self-excited asynchronous generator has the advantages of simple structure, high reliability and high-speed operation. The role of independent power system has become increasingly prominent, from the perspective of national defense modernization, the significance of the study of asynchronous generators is particularly important. In fact, asynchronous generators for many years has been a hot topic of scholars [2]-[4].
![Fig. 3. Airport Rail link line in Thailand [25]](https://thumb-ap.123doks.com/thumbv2/123dok/3642981.1464021/11.595.378.464.298.409/fig-airport-rail-link-line-thailand.webp)