Paper ID : TR03 Transportasi
75
A COMPARISON BETWEEN ARTIFICIAL NEURAL NETWORKS AND
BINARY LOGIT MODELS TO ANALYSE THE INFLUENCE OF MALE MOTORISTS
ON MOTORCYCLE FATAL ACCIDENTS
Dewa Made Priyantha Wedagama
Jurusan Teknik Sipil, Universitas Udayana, Kampus Bukit Jimbaran Badung-Bali Email: [email protected]
ABSTRACT
This study aims to develop and compare models that examine the influence of male motorists on motorcycle fatal accidents using Tabanan Regency in Bali as a case study area. Both Artificial Neural Network (ANN) and binary logit models were constructed using accident data set obtained from the State Police of Bali Province. A feed forward with back propagation learning algorithm was used in the ANN model to train the network. The accident data used in this study were fit to both ANN and binary logit models. The model sensitivity shows that the ANN model estimated the motorcycle fatal accidents aboutsix out of teneventswhile the binary logit predicted five out of ten events. In addition, the model efficiency indicated that the ANN and the binary logit models show 60% and 30% respectively of perfect performances. The ANN model therefore, developed the relationship between male motorist accident factors and motorcycle fatal accident better than the binary logit model. Using the ANN model, this study found that motorcycle fatal accidents in Tabanan Regency in Bali are likely to occurr in accidents contributed by male motorist with collision types including out of control, right angle, sideswipe, rear end and head on collisions
.
Key words: fatal accident, gender, motorcycle, artificial neural networks, binary logit
1.
INTRODUCTION
The motorcycles have been extensively used as the main mode of passenger transportation in Indonesia. Motorcycles share the roadways together with the other main modes consisting light and heavy vehicles. As the results, there are always conflicts on the road amongst the three modes. Moreover, motorcyclist‟s behaviour such as speeding and manoeuvring among vehicles to get ahead on the congested road worsened traffic condition. This behaviour certainly is not favourable in terms of road safety. This circumstance leads to a high number of motorcycle accidents in Indonesia including Bali Province. In fact, in Bali Province motorcycle accidents were accounted for 70% of total road accidents (State Police of Bali Province, 2009).
Meanwhile, the accident data in Bali showed that male motorists at fault annually contributed about 80% to motorcycle accidents (State Police of Bali Province, 2009). Amongst eight regencies in Bali, Tabanan regency has been considered to have high number of motorcycle accidents (State Police of Bali Province, 2009). In 2008, there were 34 motorcycle accidents and 11 motorcycle fatal accidents respectively per 100,000 population of Tabanan regency. In addition, in 2008 there were 10 male motorists at fault per 100,000 population contributing on motorcycle fatal accidents.
During period 2003-2008, in total there were 518 motorcycle accidents in Tabanan regency and male motorists contributed about 89% (462 events) of these motorcycle accidents. Motorcycle fatal accidents were accounted for more than half (260 out of 518) of all motorcycle accidents while male motorists at fault were up to 87% (227 out of 260) in motorcycle fatal accidents during the same period. This indicated that motorcycle fatal accidents were a serious problem and male motorists significantly contributed on motorcycle fatal accidents in this regency.
Many previous studies have long investigated gender in relation to accident risk (Al-Ghamdi, 2002; Dissanayake,
Prosiding Konferensi Nasional Teknik Sipil 9 (KoNTekS 9) Komda VI BMPTTSSI - Makassar, 7-8 Oktober 2015
Paper ID : TR03 Transportasi
76
described the relationship between road accidents and their contributing factors. The ANN models have increased the understanding of the relationship between injury severity and factors related to drivers, vehicles and roadway/environment (Abdelwahab and Abdel-Aty, 2001).
A previous study has also been conducted for Tabanan regency to investigate contributing factors on motorcycle fatal accidents (Wedagama, 2009a). The study however, did not specifically examine the influence of gender on such fatal accidents. This study however, aims to develop and compare models of logistic regression and ANN models to examine the influence of male motorists on motorcycle fatal accidents in Bali. Due to data constraints, motorcycle fatal accidents in Tabanan Regency during period 2003-2008 were used as the case study area. In so doing, the ANN and binary logit models are developed given that a fatal motorcycle accident has occurred. These two models are compared to identify the better model to estimate the significant factors of male motorists that contributed to motorcycle fatal accidents in Bali.
2.
LITERATURE REVIEW
Some previous studies have used ANN to model and examine road accidents. A previous studyby Abdelwahab and Abdel-Aty (2001) compared between the two well-known ANN models: the Multi-Layer Perceptron (MLP) and Fuzzy Adaptive Resonance Theory (ART) and an ordered logit model to predict driver injury severity in traffic accidents at a signalised intersection. The study showed that the classification accuracy of the MLP model performed better for both training and testing phases than the fuzzy ART and the ordered logit models. Another previous study by Abdelwahab and Abdel-Aty (2002) also compared between two neural ANN models, the Multi-Layer Perceptron (MLP) and Radial Basis Function (RBF), and a logit model to analyse traffic safety of toll plazas. The results showed that two level nested logit model was the best in describing probabilities of accident location while the RBF was the best in analysing driver injury severity.
The ANN had also been compared to multiple discriminate analysis and binary logit models to predict vessel accidents on the lower Mississippi River (Hashemi et.al, 1995). The ANN model‟s prediction power was 1.6 times better than the other two. The ANN models were also developed to predict intersection crashes based upon driver, vehicle and roadway surface characteristics (Akin and Akbas, 2010). That study showed that the ANN model was capable in providing a very accurate prediction (90.9%) of the crash types. In addition, the results were considered very promising and encouraging for further research to estimate future year dependent variables with the model built. The ANN model has also been developed and compared to the log linear model to identify number of persons injured fatality in motor vehicle accidents(Cansiz et.al, 2009). The study concluded that the ANN model performed better than the log linear regression.
One of the challenging tasks in training an ANN model is to determine the appropriate number of neurons in the hidden layer. However, there is no accurate answer to this question. In general, the number of neurons in the hidden layer should not be underestimated or overestimated. The ANN has a few difficult conditions called its disadvantages. One of these is over-fitting problem. The parameters of the problem can be overestimated by the model, if the training part is taken into consideration to appraise the output variables without testing the ANN model. Underestimation prevents the network from building a complete representation of inputs. By contrast, overestimation can also lead to a compact representation of the relationship between the input patterns(Abdelwahab, and Abdel-Aty, 2001). This problem will be resolved by using data that is proportionately divided as training, testing and validation(Cansiz et.al, 2009). In addition, limiting the number of iterations can reduce the possibility of over-fitting problem. While there are no firm rules, the use of some heuristics will help avoid over-fitting problem. One such rule is to stop training when the ANN Mean Square Error (MSE) no longer declines significantly. In addition, using fewer hidden layer nodes reduces the possibility of over-fitting(Bjornson, and Barney, 1999).
Paper ID : TR03 Transportasi
77
complex non linear function(Cansiz et.al, 2009). In this study, the number of neurons in the hidden layer was determined by trial and error.
In this study, a tangent sigmoid transfer function was used in the hidden layer because many of the input variables were binary values and the tangent sigmoid is the preferred function under such conditions (Wilmot and Mei, 2004). The log sigmoid transfer function was used in the output layer so that the output would be in the range zero to one (Wilmot and Mei, 2004). The output layer contained a single neuron which produced the probability of accident. In order to obtain the best form, various ANN models having various architectures including number of neurons (12, 18, 24 and 30), random connection weights with a maximum number of epochs of 100 were evaluated (Abdelwahab and Abdel-Aty, 2001). The ANN model was trained with Gradient Descent Moment (GDM) learning and Levenberg-Marquardth training algorithms. Matlab software was used to implement this training method. The MSE was used to evaluate performances of the ANN models. The MSE is defined as the difference between the actual observations and the response predicted by the model and is used to determine if the model fits the data or not and whether the model can be simplified by removing terms. MSE formula is:
j i i iy
y
h
MSE
1 2)
ˆ
(
1
(1) Where: iy
= actual datai
y
ˆ
=output data h=number of dataIn addition, the performance of the ANN model was determined in terms of correlation coefficient (R). The optimum number of hidden neurons was found out for obtaining the lowest value of MSE and the highest value of R.
Meanwhile, binary logit is useful for predicting a binary dependent variable as a function of independent variables. The goal of binary logit is to identify the best fitting model that describes the relationship between a binary dependent variable and a set of independent or explanatory variables. The dependent variable is the population proportion or probability (P) that the resulting outcome is equal to 1. Parameters obtained for the independent variables can be used to estimate odds ratios for each of the independent variables in the model. The specific form of the binary logit model is:
(x) = P = x
x o o
e
e
1 11
(2)The transformation of conditional mean (x) binary logit function is known as the logit transformation. The logit is the LN (to base e) of the odds, or likelihood ratio that the dependent variable is 1, such that
Logit (P) = LN
i iP
P
1
= Bo + Bi.Xi (3) Where:Bo : the model constant
Bi : the parameter estimates for the independent variables Xi : set of independent variables (i = 1,2,...,n)
P : probability ranges from 0 to 1
i iP
P
1
: the natural logarithm ranges from negative infinity to positive infinity
The binary logit model accounts for a curvilinear relationship between the binary choice Y and the independent variables Xi, which can be continuous or discrete. The binary logit curve is approximately linear in the middle range and logarithmic at extreme values. A simple transformation of equation (4) yields
i iP
P
1
= expi i o B X B .
= expBo
.expBi.Xi
(4)
Prosiding Konferensi Nasional Teknik Sipil 9 (KoNTekS 9) Komda VI BMPTTSSI - Makassar, 7-8 Oktober 2015
Paper ID : TR03 Transportasi
78
ii
P
P
1
= exp) 1 ( i i
o B X
B
= expBo.expBi.Xi .expBi (5)
When independent variables X increases by one unit, with all other factors remaining constant, the odds [Pi/(1-Pi)] increases by a factor expBi
. This factor is called the odds ratio (OR) and ranges from 0 to positive infinity. It indicates the relative amount by which the odds of the outcome increases (OR>1) or decreases (OR<1) when the value of the corresponding independent variable increases by 1 unit.
A Hosmer-Lemeshow Test is used to carry out the goodness of fit measure. The test statistic is,
gk k
k k
v
E
O
C
1
2
)
(
ˆ
(6)Where:
C
ˆ
= The Hosmer-Lemeshow test (H-L test)Ok = Observed number of events in the kth group Ek = Expected number of events in the kth group vk = Variance correction factor for the kth group
If the observed number of events differs from what is expected by the model, the H-L test will be large and there will be evidence against the null hypothesis.
3.
MODEL DEVELOPMENT
The regency of Tabanan is located in the south-west of Bali and bounded by the Regency of Badung and Jembrana to the east and the west respectively as shown in Figure 1. It has an area about 850 km2 with a population of 414,220 in 2007. In 2007, there were 147,483 registered motorcycles, which accounted for about 88.44% of the total registered vehicles(Bali Statistic Agency, 2008). This indicated that motorcycles dominated the mode of passenger transportation in Tabanan regency. In addition, the motorcycle average annual growth during period 2003-2007 was about 7.71%.
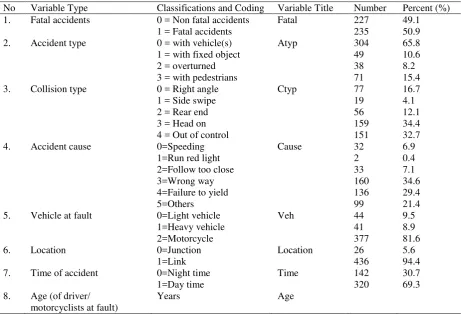
Meanwhile, data availability has been the primary consideration in determining independent variables for this study. In Table 1, all variables were obtained from the State Police of Bali province. This study attempted to consider all relevant male motorist factors including the characteristics of the motorists, vehicles and roadway/environment variables influencing motorcycle fatal accidents despite the shortcoming of existing accident data in Bali. Two levels of accidents were considered: fatal and non fatal accidents. Some independent variables in this study (i.e. variables type no. 2 - 6 in Table 1) were determined following the method used by a previous study conducted in Saudi Arabia (Al-Ghamdi, 2002). All independent variables are categorical except age, which is a continuous variable.
Paper ID : TR03 Transportasi
79
The categorical variables have several levels, so that they require the use of dummy variables defined with 0, 1, 2, 3 and so forth, as shown in Table 1. They are created so that having k-1 dummy variables for the k levels of the nominal scale of that variable. For example, the variable accident cause (Cause) has six levels and hence has five dummy variables as shown in Table 2.
Table 1.Male motorist variables
No Variable Type Classifications and Coding Variable Title Number Percent (%) 1. 2. 3. 4. 5. 6. 7. 8. Fatal accidents Accident type Collision type Accident cause
Vehicle at fault
Location
Time of accident
Age (of driver/ motorcyclists at fault)
0 = Non fatal accidents 1 = Fatal accidents 0 = with vehicle(s) 1 = with fixed object 2 = overturned 3 = with pedestrians 0 = Right angle 1 = Side swipe 2 = Rear end 3 = Head on 4 = Out of control 0=Speeding 1=Run red light 2=Follow too close 3=Wrong way 4=Failure to yield 5=Others 0=Light vehicle 1=Heavy vehicle 2=Motorcycle 0=Junction 1=Link 0=Night time 1=Day time Years Fatal Atyp Ctyp Cause Veh Location Time Age 227 235 304 49 38 71 77 19 56 159 151 32 2 33 160 136 99 44 41 377 26 436 142 320 49.1 50.9 65.8 10.6 8.2 15.4 16.7 4.1 12.1 34.4 32.7 6.9 0.4 7.1 34.6 29.4 21.4 9.5 8.9 81.6 5.6 94.4 30.7 69.3
Table 2. Dummy variables for accident cause
Cause V1 V2 V3 V4 V5
Speeding 1 0 0 0 0
Run red light 0 1 0 0 0
Follow too close 0 0 1 0 0
Wrong way 0 0 0 1 0
Failure to yield 0 0 0 0 1
Others 0 0 0 0 0
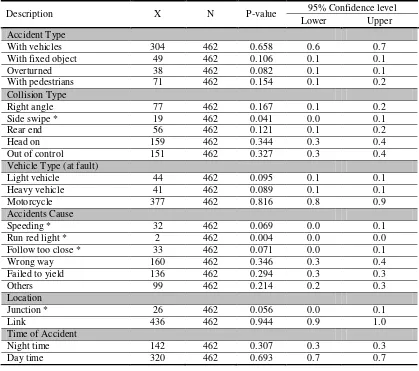
When the respondent is „speeding‟, the V1 would be set to 1 and V2, V3, V4 and V5 are set to zero (0) as shown in Table 2. This coding system is applied for the rest of categorical variables. Meanwhile, the dependent variable is fatal accidents, which is binominal in nature. According to data related statistics shown in Table 3, some variable classifications can be neglected because of their small proportion. The hypothesis testing technique for proportions was used in this study to decide whether a classification could be reduced. The following typical test was used:
H0: pi = 0 and Ha: pi
0 Where, pi is the proportion of a variable classification.Based on the test, there were five accident factors excluded from the model development stage, including „collision type-side swipe‟, „accident cause due to speeding‟, „run red light‟, „follow too close‟ and „junction as the accident
location‟. This exclusion is carried out with merging the „non significant‟ factors with another „significant‟ factors.
For instance, within the accident cause factor, „speeding‟, „run red light‟ and „follow too close‟ were merged and
Prosiding Konferensi Nasional Teknik Sipil 9 (KoNTekS 9) Komda VI BMPTTSSI - Makassar, 7-8 Oktober 2015
Paper ID : TR03 Transportasi
80
These reductions result new classifications for variables collision type and accident cause. Consequently, the classifications used in the model development are recoded using the same technique that has been described previously (Refer Table 2). These variables are used to develop both the ANN and binary logit models.
Table 3. Hypothesis testing: data statistics (motorcycle fatal accidents)
Description X N P-value 95% Confidence level
Lower Upper
Accident Type
With vehicles 304 462 0.658 0.6 0.7
With fixed object 49 462 0.106 0.1 0.1
Overturned 38 462 0.082 0.1 0.1
With pedestrians 71 462 0.154 0.1 0.2
Collision Type
Right angle 77 462 0.167 0.1 0.2
Side swipe * 19 462 0.041 0.0 0.1
Rear end 56 462 0.121 0.1 0.2
Head on 159 462 0.344 0.3 0.4
Out of control 151 462 0.327 0.3 0.4
Vehicle Type (at fault)
Light vehicle 44 462 0.095 0.1 0.1
Heavy vehicle 41 462 0.089 0.1 0.1
Motorcycle 377 462 0.816 0.8 0.9
Accidents Cause
Speeding * 32 462 0.069 0.0 0.1
Run red light * 2 462 0.004 0.0 0.0
Follow too close * 33 462 0.071 0.0 0.1
Wrong way 160 462 0.346 0.3 0.4
Failed to yield 136 462 0.294 0.3 0.3
Others 99 462 0.214 0.2 0.3
Location
Junction * 26 462 0.056 0.0 0.1
Link 436 462 0.944 0.9 1.0
Time of Accident
Night time 142 462 0.307 0.3 0.3
Day time 320 462 0.693 0.7 0.7
* Statistically insignificant at the 5% level; the 95% confidence limits include 0. Where: X = number of classification (yes=1), N = sample size
For the ANN model development, all input variables were normalized to have a range of [-1, 1] in order to have fast convergence using the min-max normalization formula as below (Delen et.al, 2006):
A A A A A A
new
new
new
v
v
(
_
max
_
min
)
_
min
min
max
min
'
(7)Where v‟ v Max A Min A New_max A New_minA : : : : : :
the normalized value the original value
the maximum value of the original variable the maximum value of the original variable
the maximum value of the min-max normalization range (1 and 0) the maximum value of the min-max normalization range (1 and 0)
Paper ID : TR03 Transportasi
81
4.
RESULTS AND ANALYSIS
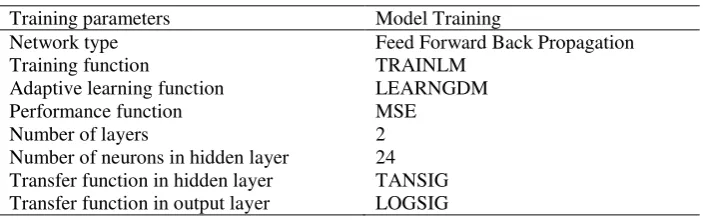
All ANN models had been run with a maximum number of epochs of 100 and with 0.0001 MSE as the goal value. In order to avoid over-fitting of the ANN model the „early stopping‟ method is used in which the training phase is terminated when the error of the validation set is at a minimum. The minimum MSE and the highest coefficient (R) were observed at 24 hidden neurons. Table 4 shows list of training parameters used for the ANN model training and testing. In doing a comparison with the binary logit models, the final ANN models were selected on the basis of the performance of the model in the validation sets instead of the training sets because the termination of the training was based on the validation sets and not on the training sets. Because sensitivity for estimating a motorcycle fatal accident was considered more important than specificity, only the training sets (or validation sets for the ANN models) with sensitivity threshold at 95% were selected.
Table 4. List of the training parameters of the ANN model
Training parameters Model Training
Network type Training function
Adaptive learning function Performance function Number of layers
Number of neurons in hidden layer Transfer function in hidden layer Transfer function in output layer
Feed Forward Back Propagation TRAINLM
LEARNGDM MSE
2 24 TANSIG LOGSIG
Table 5 shows that the Omnibus Tests of Model Coefficients of the binary logit is significant (Sig. < 0.05) so it is concluded that the independent variables improve on the predictive power of the null model. In addition, the Hosmer-Lemeshow (H-L) test indicating the significance of developed binary logit models (Sig. > 0.05). In addition, Table 5 shows the sensitivity, specificity, efficiency and the Area under Receiver Operating Characteristic (AUC) curve of the selected model. The model sensitivity and specificity measure the correctly identified on the proportion of actual positives (predicting fatal accidents as fatal accidents) and negatives (not predicting non fatal accidents as fatal accidents) respectively, while model efficiency is considered best at its maximum value. Based on model efficiency andthe AUC values therefore, the accident data were fit better to the ANN model than binary logit model.
Table 5. Comparative performance of the ANN and binary logit models
Model Training or validation
Omnibus test (Sig.)
H-L test (Sig.)
AUC Sensitivity (%)
Specificity (%)
Efficiency (%)
Binary logit 0.037 0.198 0.61 63 59 61
ANN --- --- 0.76 52 100 77
Model Testing Sensitivity
(%)
Specificity (%)
Efficiency (%)
Binary logit --- --- --- 50 77 65
ANN --- --- --- 58 100 80
In order to compare the performance of the models, ideally, these would have been based on the testing data set alone in order that assessment of the models could be made on data other than that on which they were calibrated (Wilmot and Mei, 2004).The sensitivity of model testing shows that the ANN model estimated the motorcycle fatal accidents aboutsix out of teneventswhile the binary logit estimated five out of ten events. Overall, the ANN model performs better than binary logit.
Prosiding Konferensi Nasional Teknik Sipil 9 (KoNTekS 9) Komda VI BMPTTSSI - Makassar, 7-8 Oktober 2015
Paper ID : TR03 Transportasi
82
5.
CONCLUSIONS
The assessment of the model performance indicated that the accidents data were fit to both ANN and binary logit models. The sensitivity of model testing shows that the ANN model estimated the motorcycle fatal accidents about six out of teneventswhile the binary logit estimated five out of ten events. In addition, the model testing efficiency indicated that the ANN model shows 60% of perfect performance while the LR shows 30% of perfect prediction. The ANN model therefore, developed the relationship between male motorist accident factors and motorcycle fatal accident better than the binary logit model.
Using the ANN model, this study found that a motorcycle fatal accident in Tabanan Regency in Bali is likely occurred in an accident contributed by male motorist with collision types including out of control, right angle, sideswipe, rear end and head on collisions. In fact, a quick query of the data revealed that head on collisions and out of control contributed about 34% and 33% respectively on motorcycle fatal accidents.
REFERENCES
Abdelwahab, H. and Abdel-Aty, M. (2001). “Development of artificial neural network models to predict driver
injury severity in traffic accidents at signalized intersections”. Transportation Research Record: Journal of the Transportation Research Board, Vol. 1746, 6-13.
Abdelwahab, H. and Abdel-Aty, M. (2002). “Artificial neural networks and logit models for traffic safety analysis
of toll plazas”. Transportation Research Record: Journal of the Transportation Research Board, Vol. 1784, 115-125.
Akin, D. and Akbas, B. A. (2010). “Neural network (NN) model to predict intersection crashes based upon driver,
vehicle and roadway surface characteristics”. Scientific Research and Essays, Vol. 5, 2837-2847.
Al-Ghamdi, A.S. (2002). “Using binary logit to estimate the influence of accident factors on accident severity”. Accident Analysis and Prevention, Vol. 34, 729-741.
Bali Statistic Agency. (2008) Statistics of Bali Province: Bali in Figures.
Bjornson, C. and Barney, D.K. (1999). “Identifying significant model inputs with neural networks tax court
determination of reasonable compensation”. Expert Systems with Applications, Vol. 17, 13-19.
Cansiz, O.F, Calisici, M. and Miroglu, M.M. (2009). “Use of artificial neural network to estimate number of persons fatally injured in motor vehicle accidents”. In Proceedings of the 3rd International Conference on Applied Mathematics, Simulation, Modelling and Proceedings of the 3rd International Conference on Circuits, Systems and Signals, 136-142, Athens, Greece.
Delen, D, Sharda, R. and Bessonov, M. (2006). ”Identifying significant predictors of injury severity in traffic
accidents using a series of artificial neural networks”. Accident Analysis and Prevention, Vol. 38, 434-444. Dissanayake, S. (2004). “Comparison of severity affecting factors between young and older drivers involved in
single vehicle crashes”. Journal of International Association of Traffic and Safety Sciences (IATSS), Vol. 28 (2), 48-54.
Hashemi, R.R, Le Blanc. L.A, Rucks, C.T. and Shearry, A. (1995). “A neural network for transportation safety
modelling”. Expert Systems with Applications, Vol. 9, 247-256.
O‟Donnel, C.J.and Connor, D.H. (1996). “Predicting the severity of motor vehicle accident injuries using models of
ordered multiple choice”. Accident Analysis and Prevention, Vol. 28(6), 739-753.
State Police of Bali Province. (2009) Accident Data Report. Denpasar, Bali. State Police of Bali Province.
Wedagama, D.M.P. (2009a). “Predicting the influence of accident related factors on motorcycle fatal accidents using logistic regression (case study: Tabanan, Bali)”. Jurnal Teknik Sipil - Institut Teknologi Bandung, Vol. 16(1), 29-37.
Wedagama, D.M.P. (2009b). “The influence of young and male motorists accident factors on motorcycle injuries in
Bali”. IATSS Research, Vol. 33(2), 64-75.