DEMAND FORECASTING ANALYSIS USING TIME SERIES
METHODS AT AYAM LODHO PAK YUSUF RESTAURANT
Mochamad Cholik Hidayatullah1, Gatot Yudoko1
1School of Business and Management, Institute Technology of Bandung, Indonesia Email: [email protected]
Abstract
Food service industry have experienced tremendous growth in recent years. This growth indicated that demand from consumer have grown rapidly throughout the years. As one of the food service industry, Ayam Lodho Pak Yusuf (ALPY) restaurant encountered demand fluctuation as the impact of enormous demand from consumer. Growth of restaurant business draws uncertainty in consumer demand. Barely with subjective judgment, ALPY restaurant tried to forecast its daily demand. As the implication, stock out occurred frequently especially in the peak period. This research aims to construct proper demand forecasting which match with demand pattern at ALPY restaurant using time series methods. The result showed that simple exponential was favorable to forecast demand in weekdays as well as Christmas and Oew Zears holidays period/ Xinters model/ Xinters model surpassed other methods to forecast demand in weekend period. While in the Fid holidays- Iolts model became the best forecast method to use in this period. The selection of method based on the lowest mean absolute deviation (MAD), and mean absolute average of error (MAPE) produced by forecast methods in each period. . The measurement of tracking signalproposed to the manager in track and control the forecasting method. Keywords: Demand Forecasting, Restaurant, Time Series Methods, MAD, MAPE, tracking signal
INTRODUCTION
Food service industry have experienced tremendous growth in recent years. Statistic from Bank Indonesia have shown the increasing value of Food and Beverages Service Activities contribution to Indonesian GDP. GDP value of Food and Beverages Service Activities recorded at Rp214,414 billion in 2015. The growth of this industry reached 30.33% from 2010 which recorded at Rp164,518 billion. This growth indicates that demand from consumer have grown rapidly throughout the years.
Ayam Lodho Pak Yusuf (ALPY) restaurant is culinary business established in 1987 at Trenggalek, East Java. This restaurant served traditional javanese cuisine named Ayam Lodho, , a traditional Javanese cuisine made from grilled chicken served with spice-flavored coconut milk. As one of the business in food service industry, ALPY restaurant encountered demand fluctuation for the impact of rapid growth in this sector. In Trenggalek Regency, growth of food service industry showed on the increasing number of restaurant from 2010 to 2014. The number of restaurant in Trenggalek Regency increased about 65% from 2010 to 2014. Growth of restaurant business draws uncertainty in consumer demand. Increasing number of restaurant could affect consumer in choosing desired product.
demand. In anticipating consumer demand, ALPY restaurant is merely use subjective judgment to predict future demand. As implication, stock out and lost sales happen much more frequently at ALPY restaurant especially in the peak period.
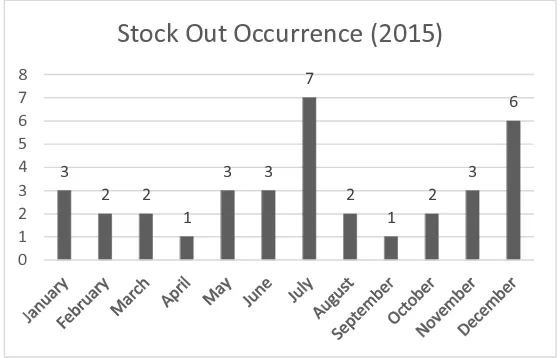
Figure 1 shows the stockout occurence at ALPY restaurant in 2015. Highest occurrence of stock out was in July when it was on the day of Eid. The second highest occurrence of stock out was in Eecember during Dhristmas and new years holiday/ Uhe main reason this stock out occurred because of the under estimated demand in the peak period.
ALPY restaurant as the one of popular restaurant in Trenggalek experienced this condition with limited skill and capability to forecast demand. Current technique to forecast demand unable to predict demand fluctuation with trend and seasonality causing stock out which occured frequently in peak period. Objectives of this research is to construct proper demand forecasting technique for ALPY restaurant. Thus, it could reduce the stock out occurrence at ALPY restaurant to maximize profitability.
THEORETICAL FOUNDATION
Demand Forecasting
Forecasting means to estimate future event or conditionoutside the organizations control to provide a foundation for managerial planning (Herbig, Milewicz, & Golden, 1993). Demand forecasting is necessary if managers want to cope with seasonality, changes in demand levels, price-cutting manuevers of the competition, or even a huge fluctuation of the economy (Chambers, Mullick, & Smith, 1971). There are two components in historical demand. These components comprise of systematic and random component (Chopra & Meindl, 2014). Demand forecasting is tried to measure the systematic component of demand, while the random component is the error measurement of the forecast. There are three terms in systematic component which is tried to be measured. It comprise of level, trend, and
Time Series Forecasting Methods
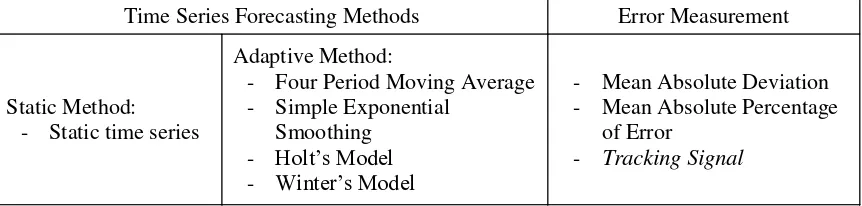
Time series forecasting use historical data to predict the future that assume the past pattern will continue into the future (Jain, 2003). Table 2 shows the time series forecasting methods and error measurement of this study. The use of this methods consider the historical demand pattern which incorporates trend and seasonality and the ease of use for restaurant manager. The formula of each method provided in Appendix for ease access to practitioners. These methods calculated using Microsoft Excel which commonly used in computing and measurement.
Table 1. Time Series Forecasting Methods (Chopra & Meindl, 2014)
METHODOLOGY
This research incorporates observation at the restaurant and interview with manager to acquire primary data. Historical demand data from 2012 to 2015 of ALPY restaurant are used to contruct the forecasting methods. The forecast error of each method in time series measured with mean absolute deviation (MAD), and mean absolute percentage of error (MAPE) as a basic error measurement used in forecasting area. MAD and MAPE as error measurement selected based on the error and demand pattern. The appropriate method chosen from demand forecasting method that yield the minimum error consider its MAD, and MAPE. Selected forecasting method for each period will be controlled with tracking signalto measure the reliability of forecast result.
ANALYSIS & RESULT
Consider this demand pattern at ALPY restaurant, researcher decided to separated the forecast period into four different periods. Those periods are Weekdays Forecast, Weekend Forecast, Christmas ' Oew Zears Iolidays Gorecast- and Fid Iolidays Gorecast/
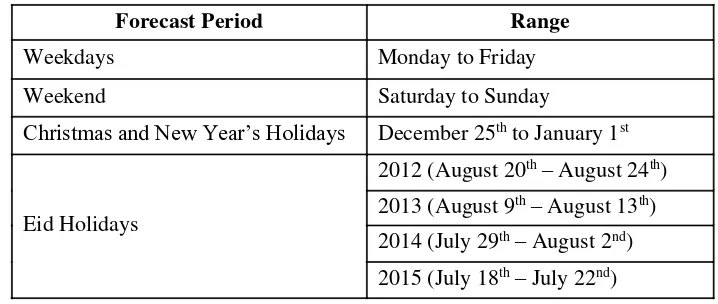
Using demand data from 2012 to 2015, each forecast period employed different range. Table 2 shows the range used on each forecast period. This separation in analyzing demand forecast was done in order to avoid significant error when extreme change in demand occurred. With different period of forecast, it is expected to gain more accuracy as long-term forecast are usually less accurate than short-term forecasts (Chopra & Meindl, 2014).
Time Series Forecasting Methods Error Measurement
Static Method: - Static time series
Adaptive Method:
- Four Period Moving Average - Simple Exponential
Smoothing - Iolts Nodel - Xinters Nodel
- Mean Absolute Deviation - Mean Absolute Percentage
of Error
Table 2. Demand Forecast Period
Forecast Period Range
Weekdays Monday to Friday
Weekend Saturday to Sunday
Dhristmas and Oew Zears Iolidays December 25thto January 1st
Eid Holidays
2012 (August 20th•August 24th) 2013 (August 9th•August 13th)
2014 (July 29th•August 2nd)
2015 (July 18th•July 22nd)
Each forecast period used same number of data from 2012 to 2015. Weekdays forecast use 240 days for each year while weekend forecast use 100 days each. Christmas and New Years forecast use fixed date range from Eecember 36th to Kanuary 2st/ Gor Fid holidays forecast, the date on Eid differed each year. However, ALPY restaurant has a fixed range while operated on Eid holidays. Restaurant is always open in five days on Eid holidays. The restaurant started to open one day after Eid then closed on the seventh day after Eid.
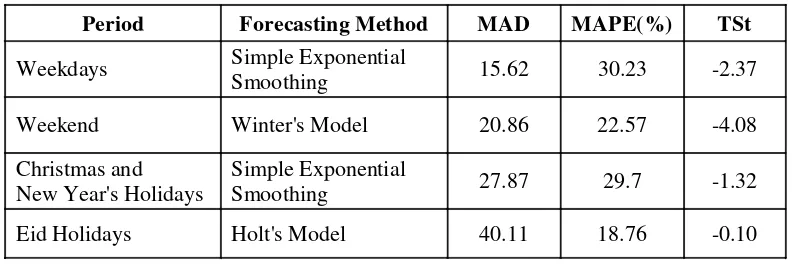
Table 3 shows the forecasting method which selected for each period based on the result of data analysis. The table also shows error measurement and the tracking signal for each method. The tracking signal used to track and control the forecasting method. It measured whether the forecasting method was either underforecasting (TS<-6) or overforecsting (TS>+6) (Chopra & Meindl, 2014). The use of MAD in this study based on the forecast error distribution which not presented the symetric shape. MAD is a proper measurement when the forecast error does not have symetric distribution (Chopra & Meindl, 2014). MAPE used in this study as comparison of forecast error for each method. This measurement better fit with demand pattern at ALPY restaurant which has significant seasonality and varied from one period to others. MAPE is better used when those components exist (Chopra & Meindl, 2014).
Simple exponential smoothing was selected as the best forecast method for weekdays period based on its error measurement. This method has TS value of -2.37 that still in the coverage of its rule of thumb/ Xinters model which chosen to forecast in weekend period has TS value of -4.08 which barely crossed the limit value of -6. However, in the calculation done by researcher, the number changed as the new demand have arrived. It tended to adapt with demand pattern and improved periodically/ Jn Dhristmas and Oew Zears period- the simple exponential smoothing was favorable among other methods. Its TS value also in the
Table 3. Selected Method with Error Measurement
Period Forecasting Method MAD MAPE(%) TSt
Weekdays Simple Exponential
Smoothing 15.62 30.23 -2.37
Weekend Winter's Model 20.86 22.57 -4.08
Christmas and New Year's Holidays
Simple Exponential
Smoothing 27.87 29.7 -1.32
Eid Holidays Holt's Model 40.11 18.76 -0.10
CONCLUSSION
This research has objective to construct proper forecasting technique which better fit with demand pattern at ALPY. Using time series method which comprise of static and adaptive method. The method compared with error measurement to define the proper method which has the least error considered.
As the demand pattern at ALPY restaurant fluctuated significantly, the forecasting period divided into four section which comprise of weekdays period, weekend period,
Dhristmas and Oew Zears holidays period- and Fid period/ Bll of the method used in this
study comprise of static method, four period moving average, simple exponential smoothing,
Iolts model- and Xinters model/ Bll of those methods analyzed in four different periods/
The result shows that simple exponential smoothing was favorable to forecast demand in weekdays as well as Dhristmas and Oew Zears period/ Xinters model surpassed other
methods to forecast demand in weekend period/ Xhile in the Fid holidays- Iolts model
became the best forecast method to use in this period.
REFERENCES
Chambers, J. C., Mullick, S. K., & Smith, D. D. (1971). How to Choose the Right Forecasting Technique.Harvard Business Review.
Chopra, S., & Meindl, P. (2014).Supply Chain Management Strategy: Global Edition. New Jersey: Pearson Education, Inc.
Herbig, P., Milewicz, J., & Golden, J. E. (1993, December 2). Forecasting: Who, What, When, and How.The Journal of Business Forecasting Methods & Systems, 16.
APPENDIX
1. Static Time Series (mixed)
Ft+1= [L +(t + l)T] St+1
L =estimate of level att = 0(the deseasonalized demand estimate during Periodt = 0)
T =estimate of trend (increase or decrease in demand per period)
St=estimate of seasonal factor for Periodt Dt=actual demand observed in Periodt Ft= forecast of demand for Periodt
Deseasonalized Demand
Àg
ÁÁÁ Å
» ¼ ¼ º ¼ ¼ ¹ÒÀg(Ðc
þÑÂÀg'ÐcþÑÂ¥ yÀ]
g(ý'ÐcþÑ
])g'ý(ÐcþÑ Ó
ÌyßÍ
Ç ÖÞá ß ÕåÕÝ
Ê À]Vß
g'ÎÌc(ýÍVþÏ
])g(ÎÌc(ýÍVþÏ
ÖÞá ß ÞÔÔ
Dt =actual demand at periodt
p =periodicity (number of periods the seasonal cycle would repeats)
The linear relationship exists between the deseasonalized demand and time formulated by:
Estimation of seasonal factor computed by:
Given as:
˸ãÅ ÀãÀÙ
Di= deseasonalized demand at Periodi Dt= actual demand in period t
2. Four Period Moving Average
Âg'ý Å ÌÀgÂÀg(ýÂÀg(þÂÀg(ÿÍV{
3. Simple Exponential Smoothing
Âg'ý Å Åg
Åg'ý Å èÀg'ý ÌxÃèÍÅg
Åü Å xÝ Ê À]
a
])ý
¡ is a smoothing constant for the level- 1 > ¡ > 2/
4. Debjui IeZ[b
linear regression with actual demandDtand time Periodt
Àg ÅÑãÂÒ
The constant b measures the estimate of demand Period t=0, L0, and the slope a
measures the rate of change in demand per period,T0.
Âg'ýÅ Åg ÑÝÔ Âg'a Å Åg
Åg'ý Å èÀg'ý ÌxÃèÍÌÅg ÌgÍ
Ìg'ý Å éÌÅg'ýà ÅgÍ Â ÌxÃéÍÌg
¡ is a smoothing constant for the level- 1 > ¡ > 2- and ¥ is a smoothing constant for the trend- 1 > ¥ > 2/
5. S_dj[hui IeZ[b 'c_n[Z(
Âg'ý Å ÌÅg ÌgÍËg'ý
Lt=estimate of level at periodt Tt=estimate of trend at periodt
St+1=estimate of seasonal factor for the next period
Ft+1= forecast of demand for the next period
Åg'ý Å èÈÀËg'ý
g'ýÉ Â ÌxÃèÍÌÅgÂÌgÍ
Ìg'ý ÅéÌÅg'ýÃÅgÍ Â ÌxÃéÍÌg
Ëg'c'ý ÅêÈÀÅg'ý
g'ýÉ Â ÌxÃêÍËg'ý