Children at family risk of dyslexia: a follow-up
in early adolescence
Margaret J. Snowling,
1Valerie Muter,
1and Julia Carroll
2 1University of York, UK;2University of Warwick, UKBackground: This study is the follow-up in early adolescence of children born to families with a history of dyslexia (Gallagher, Frith, & Snowling, 2000). Methods: Fifty young people with a family history of dyslexia and 20 young people from control families were assessed at 12–13 years on a battery of tests of literacy and language skills, and they completed questionnaires tapping self-perception and print exposure. One parent from each family participated in an interview documenting family circumstances (including family literacy) and a range of environmental variables considered likely correlates of reading disability. They also rated their child’s behavioural and emotional adjustment and their own health and well-being. Parental literacy levels were also measured. Results: Forty-two per cent of the ‘at-risk’ sample had reading and spelling impairments. A significant proportion of the literacy-impaired group were affected by behavioural and emotional difficulties, although they were not low in terms of global self-esteem. The children in the at-risk subgroup who did not fulfil criteria for literacy impairment showed weak orthographic skills in adolescence and their reading was not fluent. There were no dif-ferences in the literacy levels or activities of the parents of impaired and unimpaired at-risk children, and no significant correlation between parent and child reading levels in the at-risk group. The impaired group read less than the other groups, their reading difficulties impacted learning at school and there was evidence that they also had an impact on family life and maternal well-being. Conclusions: The literacy difficulties of children at family-risk of dyslexia were longstanding and there was no evidence of catch-up in these skills between 8 and 13 years. The findings point to the role of gene–environment correlation in the determination of dyslexia. Keywords: Dyslexia, reading difficulties, risk factors, environment, adolescence.
It is widely recognised that dyslexia is a language-based disorder that runs in families and is heritable (Pennington & Olson, 2005). Accordingly, a number of studies have followed the progress of children at genetic risk of dyslexia from the pre-school years, before ‘dyslexia’ can be diagnosed (e.g., Elbro, Borstrom, & Petersen, 1998; Hindson et al., 2005; Lyytinen et al., 2006; Pennington & Lefly, 2001; Scarborough, 1990). Such studies avoid the bias that arises when children who have failed to learn to read are recruited to clinical samples; they also provide evidence regarding risk and protective fac-tors in reading development.
Initial findings from family studies of children at ‘high risk’ of dyslexia suggested that the behavioural profile of dyslexia changes with age, from a pattern of delayed language development in the pre-school years to the more specific profile of phonological difficulties in the school years (Scarborough, 1990). As further evidence has accumulated, it has become clear that a more common scenario is for poor readers in at-risk samples to be characterised by broader language difficulties (Hindson et al., 2005; Lyytinen et al., 2006; Snowling, Gallagher, & Frith, 2003). Moreover, a number of pertinent findings suggest that the risk of reading disorders is
multi-factorial, with ‘impaired’ individuals sharing certain risk factors with unimpaired individuals from similar family backgrounds.
Elbro et al. (1998) were the first to report con-tinuity of risk for dyslexia in a study following Danish children from dyslexic families; while literacy-impaired at-risk children showed deficits on tests of letter knowledge, phoneme awareness, ver-bal short-term memory (STM) and the distinctness of phonological representations, they shared deficits on tests of morphological awareness and articulatory accuracy with unimpaired children from similar family backgrounds. Pennington and Lefly (2001), following the progress of English-speaking children, reported that children who became reading-disabled shared deficits in verbal STM and rapid serial nam-ing (RAN) with high-risk unimpaired children, but only the impaired group had problems on phono-logical awareness tasks. Converging findings from Snowling, Gallagher, and Frith (2003) suggested that, whereas high-risk literacy-impaired children had poor phonological awareness, both high-risk impaired and unimpaired 6-year-olds showed slow acquisition of grapheme–phoneme skills. Together, these findings are consistent with the action of multiple-gene systems contributing through inter-actions with environmental factors to continuous variations in a phenotype. How this risk unfolds over time is under-researched – and the focus has been
Conflict of interest statement: No conflicts declared.
Ó2007 The Authors
on cognitive risk factors; it is important also to con-sider the role of environmental factors in determin-ing the developmental outcome of children from high-risk families.
The present study investigated the cognitive, educational and psycho-social outcomes of children at family risk of dyslexia at the age of 12–13 years. The study sample consisted of the cohort of children at family risk of dyslexia followed by Snowling and colleagues from the age of 3 years, 9 months (Gallagher, Frith, & Snowling, 2000; Snowling et al., 2003). Its focus was on the characteristics of dys-lexia in early adolescence, and on how these are related to individual, home and school variables.
Although dyslexia is a well-researched learning disorder, surprisingly few studies have documented the progress of children with dyslexia. Those that have done so have reported a slow rate of reading and spelling development, with poor levels of literacy into adulthood (Maughan, 1995; Maughan & Hagell, 1996). Follow-up studies of clinical samples have sometimes portrayed a different picture in which reading difficulties resolve while problems of spelling and phoneme awareness persist (Bruck, 1990, 1992).
In the present sample, 66% of 8-year-old children from high-risk families had reading and spelling attainment one standard deviation below the mean of the control group and were defined as ‘literacy-impaired’. We predicted that at follow-up, these children would show persisting literacy problems (Shaywitz et al., 1995). The remaining 34% of the high-risk group were defined as ‘unimpaired’ at 8 years, although they had been slow to learn letter names and displayed deficits in nonword reading and phonetic spelling skills at 6 years. Based on the assumption that deficiencies in phonological deco-ding can constrain the development of orthographic learning over time (Share, 1999), we predicted that these ‘unimpaired’ high-risk children would do less well in word-level reading and spelling than controls in adolescence. In contrast, given the good language levels this group showed at previous test points, we predicted they would show average reading com-prehension (Gough & Tumner, 1986; Muter, Hulme, Snowling, & Stevenson, 2004).
Psycho-social development in children at risk of dyslexia
To assess the possible impact of literacy difficulties on psychosocial adjustment, self-perception, beha-vioural and emotional difficulties were investigated. There is strong evidence of a link between reading difficulties and both externalising and internalising disorders (Maughan & Carroll, 2006). However, the two types of disorder show different links with liter-acy difficulties. Carroll, Maughan, Goodman, and Meltzer (2005) reported that children with literacy difficulties are at increased risk of anxiety, attention
problems and conduct disorder. Although the asso-ciations with conduct and attention disorder can be explained in terms of the increased levels of inat-tention present in each condition, anxiety appeared to be directly caused by literacy difficulties. One possible explanation is that behaviour problems associated with reading difficulties may be mediated by progressive school failure and lowered self-esteem (Chapman & Tunmer, 1997). An alternative is that they are caused by shared genetic or environmental risk factors. If the latter is true, one might expect that at-risk unimpaired children would also show elevated levels of inattention and behavioural prob-lems. If the problems are, in contrast, caused by the literacy difficulties themselves, one might expect to see elevated levels of difficulties only in the at-risk impaired group.
Environmental correlates of literacy outcome
The role of the home environment has not generally been shown to play a large role in the development of literacy in typically developing families. Wadsworth, Corley, Hewitt, Plomin, and DeFries (2002) examined the association between parent and child reading scores in adoptive and non-adoptive families. There was a significant correlation only in the non-adoptive families, suggesting that parent reading levels have little environmental influence on child reading abilit-ies. They concluded that most environmental influ-ences on reading development are at the individual, rather than parental level, including schooling and pastimes chosen by the child (Petrill, Deater-Deckard, Schatschneider, & Davis, 2005 for similar findings).
If the environment provided by parents of children with dyslexia is important in the development of lit-eracy difficulties, one would expect that parental practices would be correlated to child literacy out-comes and that the at-risk impaired group would have parents with poorer literacy and different reading-related practices. To that end, we assessed the extent to which the literacy outcomes of partici-pants in the study were associated with differences in parental literacy skills, as well as differences in family-literacy environment.
Reading difficulties are, in fact, a commonly cited example of likely gene–environment correlations (Stanovich, 1986; Rutter, 2005). Children with read-ing difficulties are thought to be more likely to choose pastimes and school subjects which do not involve large amounts of reading. In this way children with reading difficulties are likely to encounter ‘print’ less often than an average child on a day-to-day basis, perhaps leading to a ‘Matthew effect’ and a negative cycle of achievement. The present study provides an opportunity to quantify the print exposure of children at high-risk of reading difficulties with and without poor literacy outcomes. We expected young people with poor literacy to show evidence of self-selecting environments with less print exposure.
Method
Participants
The parents of 93 children who had been assessed at all three previous assessment points (t1, t2, t3) were in-vited by letter to participate in the current study (t4). Those invited included families who had volunteered as ‘dyslexic’ by self-report att1 but whose data were not included in the t3 analyses because neither parent fulfilled strict criteria for dyslexia on formal tests. Consent forms were returned from 52/73 ‘at-risk’ and 20/37 control families from the original sample. All of the consenting families were seen, the majority in their homes. Two ‘at risk’ children were subsequently excluded because of chronic medical problems.
At the beginning of the first phase, when the children were 3;09 (t1), both parents were asked to complete a set of literacy tests to assess their skills. Att4, when the children were 12–13 years old, one parent from each family (usually the mother) participated in a semi-structured interview. Sixty-six parents were inter-viewed, 46 from at-risk and 20 from control families. Two children from each of 4 families participated in this study (3 pairs of twins and 1 pair of siblings). We chose one child at random from each pair and the interview was conducted with reference to that child.
Tests and procedures
The present investigation was the fourth phase of a lon-gitudinal study (t4). In the first phase, children were seen at the ages of 3;09 (t1), 6;00 (t2), 8;00 (t3). Att3, children were classified into impaired and unimpaired groups on the basis of performance on the Wechsler Objective Reading Dimensions (WORD; Rust, Golombok, & Trickey, 1992) single word reading and spelling tests (see Snowling et al., 2003 for details of full test battery).
Cognitive tests at t4
Literacy skills. To provide a comprehensive assess-ment of reading and spelling skills, multiple measures were used. These included tests of single word reading and spelling (WORD; Rust et al., 1992); tests of un-timed nonword and exception word reading (Griffiths & Snowling, 2002); and a test of decoding skills that in-volved reading aloud a passage comprising nonsense words (Hatcher, Snowling, & Griffiths, 2002). To assess text reading and comprehension, the final three pas-sages from form A and the final passage from form B of the Neale Analysis of Reading Abilities (NARAII; Neale, 1989) were given; in this test the child reads the pas-sage aloud and then answers verbally-posed questions about it. To assess reading fluency, the sight word and phonemic decoding efficiency subscales of the TOWRE (Test of Word Reading Efficiency; Torgesen, Wagner, & Rashotte, 1997) were given; these tests assess how many words or nonwords, assembled vertically in col-umns on a page, can be read in a 45-second time interval.
Language skills. To assess verbal ability, children were asked to complete the Vocabulary and Verbal Similarities subtests from the Wechsler Abbreviated
Scale of Intelligence (WASI; Zhu & Garcia, 1999). The Vocabulary test requires words to be defined, Verbal Similarities requires description of the conceptual si-milarity between a set of items (e.g., red, blue, green are all colours). To assess sentence memory, participants completed the Clinical Evaluation of Language Funda-mentals (CELF-III) Recalling Sentences subtest (Semel, Wiig, & Secord, 1995) which requires the immediate repetition of sentences varying in grammatical com-plexity. To assess phonological awareness, participants were asked to take away a phoneme from a spoken nonword in a phoneme deletion task, e.g., ‘bice’ – take away the /b/ is ‘ice’ (McDougall, Hulme, Ellis, & Monk, 1994). To assess phonological processing, participants repeated 40 nonwords, 10 of each of 2, 3, 4 and 5 syllables (Children’s Nonword Repetition Test; Gathercole, Willis, Baddeley, & Emslie, 1994).
Psycho-social and behavioural measures at t4
Attention control. To identify children with problems of attention, three tests were given from the Test of Everyday Attention for Children (Manly, Robertson, Anderson, & Nimmo-Smith, 1998). SCORE! measures sustained attention by requiring the child to listen to an audiotape and count the number of irregular bleeps detected over a continuous time interval. Opposite Worlds measures switching attention and requires in-hibition of a familiar response. The child tracks through a series of squares bearing the digits 1 or 2. In response to ‘1’ they are instructed to give ‘2’, and vice versa. The time to complete this task is recorded. Same Worlds (in which the child gives the conventional responses of ‘1’ and ‘2’) is included as a baseline measure of speed of processing.
Emotional and behavioural adjustment. To assess the young person’s emotional and behavioural adjust-ment, parents completed the Strengths and Difficulties Questionnaire (SDQ; Goodman, 1997). This scale re-quires parents to rate their children on 5 subscales; pro-social, hyperactive, emotional, conduct and peer problems, to state whether or not they believe their child has learning difficulties and what their impact is. To seek participant’s own views of their social, aca-demic and physical competence they completed three scales from the Self-Perception Profile for Children (Harter, 1985): academic competence, social accept-ance and athletic competence.
Measures of family literacy environment
Parental reading skills. Parents were asked to com-plete the Reading and Spelling subtests from the Wide Range Achievement Test III (WRAT-R; Jastak & Wilk-inson, 1984) at t1, when the children were 3;09 years old. These are graded word reading and spelling tests.
Parental interview. The interview schedule was de-signed to elicit information concerning environmental variables that might affect the outcome of children at high risk of dyslexia. The main variables of interest, in addition to how often participants read, were family background and environment, school factors and
educational support. The specific constructs examined were: Socioeconomic background (based on the occu-pations of both parents), Family structure, Family lit-eracy (how litlit-eracy is fostered/supported in the home), Family aspirations (ambitions and expectations for children), School history (changes of school, special educational needs support; type, quantity, frequency), Extra support outside of school (including private tui-tion), Home-school liaison (interview protocol available at http://www.york.ac.uk/res/crl/).
Information was also sought concerning significant health issues, life events and family stresses that may have affected the children, supplemented with specific questions about the burden the child’s difficulty places on the families (Goodman, 1997). The interviewed par-ent also completed a general health questionnaire (GHQ-12; Goldberg & Williams, 1988) to assess psy-chological well-being.
Print exposure. Familiarity with books and magazines was assessed using questionnaires tapping recognition of author names, book titles and magazine names (Griffiths, 1999), providing a composite measure of print exposure.
Results
It was important in view of the loss of 15 at-risk and 12 control participants between t3 and t4 first to ascertain whether there were systematic differ-ences between the t4 retained sample and the ori-ginal sample. A series of analyses compared the performance at t3 of those participants who took part in the current phase with that of the particip-ants lost to the study on key cognitive and back-ground variables (child’s IQ at age 6, reading and spelling skill at 8 years, socioeconomic circum-stances and mother’s educational level). For the ‘at-risk’ group, there was no significant difference between consenting young people and those lost to sample on any of these variables (Fs all <1). Thus, the reasons for ‘drop-out’ did not introduce a sys-tematic bias in findings for children from ‘at risk’ families. For controls, the groups differed in verbal IQ, F(1,31)¼6.53, p¼.016, but not in
perform-ance IQ, literacy skills at 8 years or in social background factors (Fs < 1). The mean Verbal IQ for the retained controls was 107.48 (SD¼13.5)
and for the controls lost to sample 120.09 (SD¼
14.6). Since attrition from the control group was primarily of more able children, thet4comparisons between the at-risk and control groups are con-servative.
Literacy outcomes in adolescence according to self-reported family status
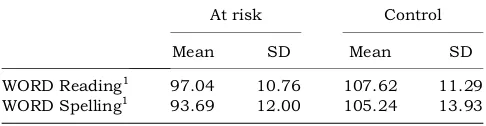
Table 1 shows the performance of the entire sample of participants on standardised tests of reading and spelling att4, according to self-reported family sta-tus at the point of recruitment. Standard scores were
used to assess the number of participants from ‘dyslexic’ and control families who were literacy im-paired at 12–13 years. As att3, the criterion used to define literacy impairment was that the composite score for single word reading and spelling fell one standard deviation below the control mean. Twenty-one out of 50 (42%) of the ‘at-risk group’ were defined as literacy impaired on this criterion (11 boys and 10 girls), compared with 3/20 (15%) of the control group (all girls). The present estimate is more conservative than that att3and in the region of that reported by related studies.
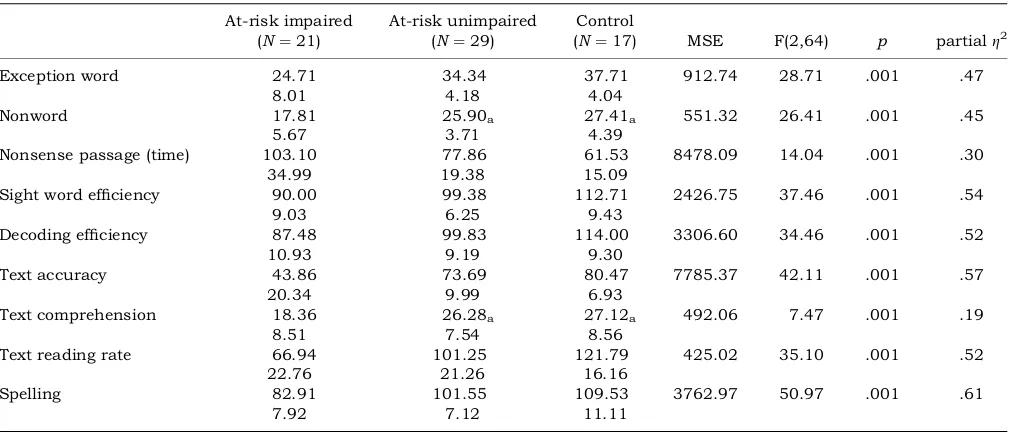
Table 2 shows the performance on the reading tasks of the sample divided according to family risk and outcome status (risk literacy impaired, at-risk literacy unimpaired and control). Although it has been argued elsewhere that the risk of dyslexia is continuous (Pennington & Lefly, 2001; Snowling et al., 2003), the data are treated categorically here to be consistent with the approach taken in our previous paper and in others in the literature. For all analyses, 3 children with poor literacy skills were removed from the control group (as at t3) be-fore proceeding to conduct between-Ss ANOVAs, followed up by Games–Howell post-hoc tests (for unequal Ns) to investigate differences between subgroups. The size of the control group was small and therefore the power to detect subgroup differ-ences between the at-risk unimpaired and control groups was relatively low. We therefore provide ef-fect sizes for differences that may have reached a conventional level of significance hadNbeen higher. There was a significant main effect of Group for all reading measures (exception and nonword read-ing, reading nonsense words embedded in passages, text reading accuracy, comprehension and rate), and the at-risk impaired group was impaired in com-parison to controls across tasks. The at-risk unim-paired group performed at the same level as controls in the un-timed nonword reading task (d¼.37) and
in reading comprehension (d¼.11); however, they
performed significantly worse than controls in exception word reading, text reading accuracy and on all of the timed measures – their performance falling between that of at-risk impaired and control participants. The spelling variable was used in classifying the sample, therefore group differences were anticipated; the three subgroups differed from one another on this variable.
Table 1 Educational attainments at t4 according to self-reported family status
At risk Control
Mean SD Mean SD
WORD Reading1 97.04 10.76 107.62 11.29 WORD Spelling1 93.69 12.00 105.24 13.93
Note:1¼standard score.
Language skills in adolescence according to literacy outcome.
Table 3 shows the performance of the three outcome groups on measures of language and phonological awareness. There was a significant main effect of Group for all measures (WASI Similarities and Vocabulary, nonword repetition, sentence recall and phoneme awareness). With the exception of sentence recall, the at-risk unimpaired group performed at the same level as controls on these measures (however, the effect size for the subgroup difference on Voca-bulary was medium (d¼.44)). In sentence recall, the
performance of the at-risk unimpaired group was significantly better than that of the at-risk impaired group but significantly worse than that of controls.
Measures of psycho-social functioning
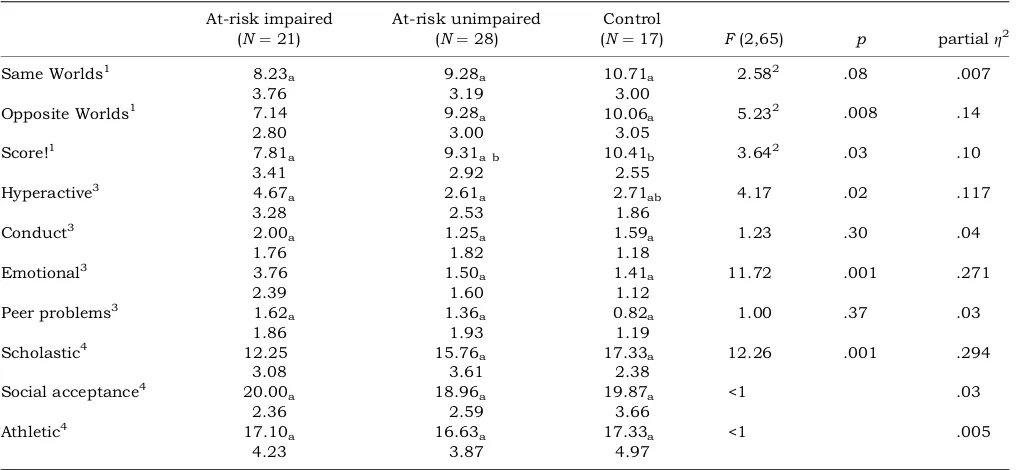
The top rows of Table 4 show the performance of the three groups on measures of sustained attention and attention switching and the lower rows, data from
the SDQ and the Harter scales assessing the socio-emotional adjustment.
Attention control. The three groups did not differ on the baseline Same Worlds measure, though the dif-ference approached significance. There was a signi-ficant main effect of group on the two attention measures: Opposite Worlds (measuring switching attention) and Score! (measuring sustained atten-tion). In Opposite Worlds, the at-risk impaired group scored significantly less well than the other two groups, who did not differ. On the Score! measure the at-risk impaired group differed from controls, but the at-risk unimpaired group did not differ sig-nificantly from either of the other groups (note; the effect size for the comparison between the at-risk unimpaired and the control groups was .40).
Emotional and behavioural ratings. There was a clear association between literacy outcome and whether the parents thought their child had learning difficulties as revealed by the SDQ; all of the
Table 2 Reading and spelling skills att4according to outcome status At-risk impaired
912.74 28.71 .001 .47
Nonword 17.81
551.32 26.41 .001 .45
Nonsense passage (time) 103.10 34.99
77.86 19.38
61.53 15.09
8478.09 14.04 .001 .30
Sight word efficiency 90.00 9.03
99.38 6.25
112.71 9.43
2426.75 37.46 .001 .54
Decoding efficiency 87.48
3306.60 34.46 .001 .52
Text accuracy 43.86
7785.37 42.11 .001 .57
Text comprehension 18.36
492.06 7.47 .001 .19
Text reading rate 66.94 22.76
101.25 21.26
121.79 16.16
425.02 35.10 .001 .52
Spelling 82.91
3762.97 50.97 .001 .61
Note:Values sharing the same subscript do not differ significantly.
Table 3 Language measures att4according to literacy outcome At-risk impaired
878.60 12.81 .001 0.29
WASI Vocabulary 46.81
1072.36 15.09 .001 0.32
Nonword repetition 32.95
100.31 10.88 .001 0.25
Sentence recall 7.29
101.82 20.48 .001 0.39
Phoneme deletion 9.14
74.23 11.15 .001 0.26
literacy-impaired group were thought to have learn-ing difficulties and in addition to this, so were a third of the at-risk unimpaired group. There was a main effect of Group for parental ratings of hyperactivity and emotion, but not for conduct or peer problems. The at-risk impaired group showed significantly more emotional symptoms than both the at-risk unimpaired group and the control group, who did not differ from each other in emotionality. In terms of rated hyperactivity, the at-risk impaired group were rated as significantly more hyperactive than the at-risk unimpaired group (p¼.024) and marginally
more hyperactive than the controls (p¼.068). The
two unimpaired groups did not differ from one an-other. On the Harter Self Perception profile, there was a significant group effect for scholastic compet-ence but not for social or athletic competcompet-ence. The at-risk impaired group rated themselves as lower in scholastic competence than either of the other two groups.
Parental reading-related abilities
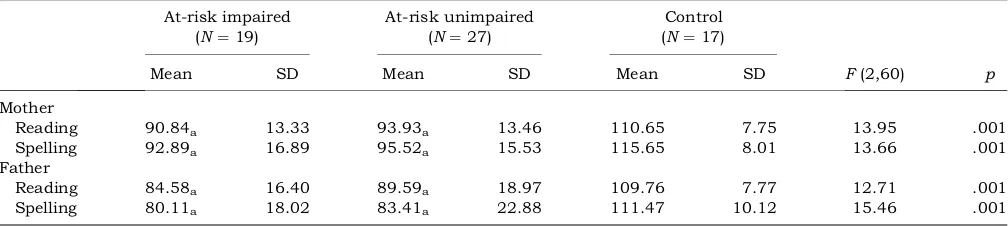
Table 5 shows the scores of parents of the partici-pants on tests of literacy measured at the beginning of phase 1, grouped according to outcome at t4. There were three pairs of twins and one pair of sib-lings in the sample; one child from each of these families was excluded for the purpose of these ana-lyses (to avoid double counting of their parents’ data).
A multivariate ANOVA indicated that there was a significant main effect of Group on parental varia-bles, F(14,28)¼590.96, p< .001. Univariate
ana-lyses confirmed a significant main effect of Group on
mothers’ and fathers’ reading and spelling. The pat-tern of performance across groups was the same throughout: the control group outperformed the at-risk groups, who did not differ significantly from each other. It is noteworthy, however, that there was significantly more variability in each of the at-risk groups for reading and spelling than among controls. A series of bivariate correlations examined the relationships between parental literacy skills and literacy outcomes for children in at-risk and control families separately. Examination of the respective scatterplots revealed that the data were well distri-buted for both at-risk and control groups and there was neither a restriction in range nor presence of outliers that could have affected the size of the cor-relations. In control families, there was a robust relationship between the literacy skills of mothers and fathers (reading: r¼.69; spelling r¼.55); as
expected this did not hold for at-risk families in which at least one parent was dyslexic (reading: r¼
.25; spelling r¼).014). Literacy composite scores, representing the average of reading and spelling attainments on standardised tests, were used to examine parent–child correlations. For controls, there was a high correlation (r¼.71) between the
parent literacy composite score (averaged across both parents) and child literacy att4; the correlation was somewhat weaker when the relationship was assessed between the literacy skills of the parent with poorer spelling and the child (r¼.52). For
at-risk cases, neither correlation was significant (aver-age parent–child:r¼.13; poorer spelling parent and
child: r¼.12). Thus, although there is a strong
relationship between parent and child literacy skills in normally reading families, there is only a weak
Table 4 Behavioural and psychosocial outcomes at t4 according to literacy status
At-risk impaired
Same Worlds1 8.23
a
Opposite Worlds1 7.14 2.80
Hyperactive3 4.67a
3.28
Conduct3 2.00a
1.76
Peer problems3 1.62 a
Social acceptance4 20.00 a
Notes:1¼raw scores on TEACH subtests; 2¼F(2,66); 3¼parental rating on the SDQ questionnaire; 4¼self-ratings on Harter self-perception profile. Values sharing the same subscript do not differ significantly.
relationship in families in which there is a history of dyslexia. It should be noted that selective sample attrition from the control group may have contrib-uted to this difference.
Family environmental factors
Interview responses were coded using ordinal or categorical scales, as appropriate. Composite scores were formed for four areas by standardising the scores for each of the relevant questions and calcu-lating the mean z score: i) family socioeconomic background, ii) parent reading behaviour, iii) family literacy behaviours, iv) child reading behaviour.
Family literacy. Two composite scores provided measures of family literacy environment: parent reading behaviour (how frequently the father and mother read books, newspapers or magazines) and family literacy behaviours (how often the family bought books or gave books as presents). Although there was a trend for the parents of impaired children to read less than those of controls, there was no statistically significant main effect of group (F(2,58)¼ 2.69, p¼.076). Similarly, there were no
group differences in how often the family bought books and gave books as presents (F(2,58)¼1.41,
p¼.25).
Family structure. There was no association between family size or structure and literacy outcome. There was a trend for those in the at-risk impaired group to be later-born children (X2(4)¼8.77,p¼.067); while
this may be an artefact of sample selection, with some at-risk children volunteering because of an impaired older sibling, it is possible that this could be an experiential factor specifically related to read-ing disability (Stevenson & Fredman, 1990).
Socioeconomic background. A composite variable measuring family socioeconomic background com-prised data based on father and mother qualifica-tions, education and occupation. There was no statistically significant effect of socioeconomic background on literacy outcome (F(2,58)¼2.89,
p¼.064), although there was a trend for control
families to be of higher socioeconomic status and educational background than both at-risk groups.
There was a low incidence of significant life events and major health issues in the sample and no association between these and literacy outcomes.
Child’s own reading behaviour. Two measures provided information on how often the index case chose to read. There were significant group differ-ences in the composite score reflecting how often the young person read books, magazines or newspapers, (F(2,58)¼5.45,p¼.007); participants in the at-risk
impaired group read less than those in the at-risk unimpaired and control groups, who did not differ from each other. There were also between-group differences in print exposure (F(2,60)¼12.29,
p< .001); at-risk impaired individuals had poorer knowledge of books and authors than controls; there were no significant group differences between im-paired and unimim-paired at-risk participants or be-tween unimpaired young people and controls.
Educational factors
School history. There was no association between literacy outcome and the type of school attended (X2
(4) ¼7.04,NS).
Literacy support. First, parents were asked whether they felt that their child had any learning difficulties. If they thought that they might do, they were asked questions concerning the amount and type of extra help the child had received. Thirty-five parents out of the 66 asked felt that their child had or might have some kind of learning difficulty. This is therefore more inclusive than the criterion measure of low literacy attainment used to classify cases into impaired and unimpaired; all of the parents of the at-risk impaired cases felt that their child had learning difficulties. Importantly, however, 11 of those defined as having unimpaired literacy levels were thought to have learning difficulties, as well as three children from the control group.
Of the children thought to have difficulties, 68.6% had been on the Special Needs Register of their school at some point, indicating that their learning difficulties were identified. The same number had received literacy support at some time in the past. Only 14.3% of this group were currently receiving extra help with their difficulties outside of school,
Table 5 Standard scores of parents of at-risk and control children on Wide Range Achievement Test-III (Jastak & Wilkinson, 1984)
At-risk impaired (N¼19)
At-risk unimpaired (N¼27)
Control (N¼17)
F(2,60) p
Mean SD Mean SD Mean SD
Mother
Reading 90.84a 13.33 93.93a 13.46 110.65 7.75 13.95 .001
Spelling 92.89a 16.89 95.52a 15.53 115.65 8.01 13.66 .001
Father
Reading 84.58a 16.40 89.59a 18.97 109.76 7.77 12.71 .001
Spelling 80.11a 18.02 83.41a 22.88 111.47 10.12 15.46 .001
though 48.6% had received some extra tuition dur-ing the primary school years. Parents were con-cerned about their progress: 57.1% had been to their child’s school with worries about their progress, and 25.7% had been three times or more.
Focusing on the smaller group of at-risk literacy-impaired children, 68.4% of parents had been to the school with worries about progress. The majority (78.9%) of these children had been on the Special Needs Register and all but three had received sup-port with their literacy at some point in their school career. Currently, 52.6% were receiving extra sup-port. Generally, low literacy attainments were being recognised and supported, although 15.8% of par-ents described the relationship they had with their child’s school as poor.
The impact of learning difficulties
There were some indications that learning difficulties had an impact on the family as a whole: 51.4% of the parents whose children were thought to have learn-ing difficulties felt that the difficulties had had some impact on family life, and 14.3% felt that it had had ‘a lot’ or ‘a great deal’ of impact (the proportion was 74.3% for the at-risk impaired group). The mothers of the at-risk impaired cases also showed higher levels of stress and depression, as illustrated by significantly higher scores on the General Health Questionnaire (F(2,59)¼6.72,p¼.002). There was
no significant difference between the scores of at-risk unimpaired and control cases, suggesting that liter-acy difficulties do have some impact on the home life and family environment.
Discussion
This study was a follow-up in early adolescence of children at family risk of dyslexia previously seen at the ages of 3;09, 6 and 8 years of age. Forty-two percent of the ‘high risk’ sample had literacy prob-lems of long standing; these were associated with poor educational attainments across the curriculum, including in mathematics and science (unpublished data). The high-risk impaired cases were all consid-ered by their parents to have learning difficulties.
At 6 years, a significant proportion of the high-risk children were considered at risk of literacy difficul-ties because of decoding problems but went on to be classified as normal readers at 8 years. Since these children appeared to be compensating for their weakness using good language resources, a possible decline in their literacy skills was hypothesised. An important finding in relation to this was that in adolescence, ‘at risk’ unimpaired children were sig-nificantly less fluent at reading than controls and as slow as ‘at risk’ poor readers on timed tasks, sug-gesting reading skills were not fully automatised. Moreover, although their reading comprehension
was normal, there was evidence of orthographic deficits, as indicated by poorer exception word reading and spelling skills than controls. Interest-ingly, one-third of the parents of the ‘unimpaired’ group considered their child to have a learning dif-ficulty, reflecting their sensitivity to subtle problems that were not evident on formal tests.
There were some suggestions of direct effects of literacy difficulties on emotional well-being: at-risk impaired children showed increased levels of emo-tional difficulties and lower opinions of their schol-astic competence. Similarly, the at-risk impaired group but not the unimpaired group showed in-creased difficulties in attention, based on parent ratings as well as cognitive measures. This suggests that difficulties in attention have a close association with literacy problems, rather than being due to generalised cognitive and environmental risk factors. The psycho-social difficulties shown by the at-risk impaired group were, however, quite circumscribed. Concerns about scholastic competence had not affected self-perceptions of social or athletic com-petence, in contrast to findings from older students with dyslexia (Carroll & Iles, 2006). In addition, there were no group differences in conduct or peer pro-blems. These findings may be in line with reports of lower levels of emotional and behavioural difficulties after childhood (Boetsch et al., 1996).
Examination of the association between parent and child literacy levels produced different findings for at-risk and control groups. Although parent and child literacy skills were correlated in control fa-milies, suggestive of heritability of reading and spelling skills, this was not the case for the at-risk families. This is a surprising finding, suggesting an unusual route for literacy development in children with a family history of dyslexia; in contrast to what might be expected, it does not seem to be the case that more severely affected parents have more se-verely affected offspring. Rather, the lack of associ-ation between parental and child literacy level suggests a complex interaction of multiple genetic effects acting through different environments to produce heterogeneity in literacy outcomes.
Although there was a trend for the parents of at-risk literacy-impaired adolescents to read less than those with normal literacy skills, and for the at-risk parents of both groups to be of lower soci-oeconomic standing, there were no clear associa-tions between child outcomes within the ‘at-risk’ group and the behaviours or skills of their parents with dyslexia. Against this backdrop of relatively homogenous family environments, a significant finding was that the young people with the poorest literacy outcomes read less than their contempor-aries. Most of the children with literacy difficulties had been identified and had received support in school; literacy difficulties were considered to have impacted on the classroom learning of impaired young people and to some extent on their families;
and they were associated with poorer maternal well-being.
In a study such as the present one, it is difficult to ascertain the causal pathways through which the family risk of dyslexia is expressed. It seems that in the volunteer sample of primarily middle-class children, the family environment offered many opportunities to promote literacy, and parents also ensured that appropriate learning support was in place for those who required it. Notwithstanding this, young people in these families with poor literacy preferred not to participate in literacy-related activities. Thus, the micro-environments surrounding these young people were self-selecting and arguably, neither conducive to literacy progress nor to learning in school.
Thus, our findings confirm the heightened risk of dyslexia among the offspring of parents with dys-lexia, and the literacy outcomes of the children in the high-risk group were unrelated to home, family or school environmental factors. However, there was evidence of group differences in factors that may be considered a consequence of the learning difficulty itself; poor readers read less than average readers, and their parents more often went to their children’s schools with worries about their progress. In addi-tion, parental expectations of the educational pros-pects of their children were lower and more signs of maternal depression were reported for this group. A limitation of the present study was its small sample size. Examination of group means suggested that, in addition to impairments in reading fluency and orthographic skills, young people at family risk of dyslexia who were not classified as poor readers showed weaker un-timed nonword reading and vocabulary knowledge than controls, and their abil-ity to sustain attention was somewhat poorer. These findings underline the continuous nature of the risk of reading, language and related attentional prob-lems in families with a history of dyslexia; the extent to which these relate to similar problems in the parental generation deserves further investigation.
The increased risk of dyslexia in adolescence in at-risk families extends previous findings that have followed children at family risk through the pre-school and early pre-school years. The present findings confirm that reading difficulties of developmental origin tend to persist rather than resolve, and this is true even for children who grow up in family envir-onments that are favourable in terms of the oppor-tunities they provide for literacy development. Together these findings may appear to suggest that the genetic risk of dyslexia is deterministic. On the contrary, the present findings highlight the role of a gene–environment correlation, as evidenced by the small amounts of time the poor readers spend reading, as compared with average readers from families of similar risk status. Furthermore, the lack of relationship between parental literacy levels and those of their offspring in the at-risk families is striking when compared to the strong relationship
observed in control families. This weak relationship between parent and child literacy levels suggests a multi-factorial pattern of inheritance, such that the genetic risk of dyslexia is continuous and may be modified by mechanisms that depend on factors either intrinsic to the child or ambient in their environment (Rutter, 2005). Professionals involved in the management of children with reading diffi-culties need to be mindful of the likely persistence of reading difficulties and should take steps to ensure such children remain motivated to engage in reading and writing activities.
Acknowledgements
The present study was funded by a grant from the Nuffield Foundation. Julia Carroll was funded by an ESRC Postdoctoral Fellowship (no. T026271158). We thank Uta Frith for support throughout the project, Barbara Maughan, Yvonne Griffiths and Brian Byrne for advice and assistance, and all of the families who took part.
Correspondence to
Margaret J. Snowling, Department of Psychology, University of York, York YO10 5DD, UK; Tel: 01904 434366, Fax: 01904 433181; Email: mjs19@york. ac.uk
References
Boetsch, E.A., Green, P.A., & Pennington, B.F. (1996). Psychosocial correlates of dyslexia across the life span.
Development and Psychopathology,8, 539–562. Bruck, M. (1990). Word recognition skills of adults with
childhood diagnoses of dyslexia. Developmental Psychology,26, 439–454.
Bruck, M. (1992). Persistence of dyslexics’ phonological awareness deficits. Developmental Psychology, 28, 874–886.
Carroll, J.M., & Iles, J.E. (2006). An assessment of anxiety levels in dyslexic students in higher educa-tion. British Journal of Educational Psychology, 76, 651–662.
Carroll, J.M., Maughan, B., Goodman, R., & Meltzer, H. (2005). Literacy difficulties and psychiatric disorders: Evidence for co-morbidity. Journal of Child Psycho-logy and Psychiatry,46, 524–532.
Chapman, J.W., & Tunmer, W.E. (1997). A longitudinal study of beginning reading achievement and reading self-concept. British Journal of Educational Psycho-logy,67, 279–291.
Elbro, C., Borstrom, I., & Petersen, D.K. (1998). Predict-ing dyslexia from kindergarten: The importance of distinctness of phonological representations of lexical items.Reading Research Quarterly,33, 36–60. Gallagher, A., Frith, U., & Snowling, M.J. (2000).
Precursors of literacy delay among children at genetic risk of dyslexia. Journal of Child Psychology and Psychiatry,41, 203–213.
Gathercole, S.E., Willis, C., Baddeley, A.D., & Emslie, H. (1994). The Children’s Test of Nonword Repetition: A test of phonological working memory. Memory, 2, 103–127.
Goldberg, D.P., & Williams, P. (1988). General Health Questionnaire. Windsor: NFER-Nelson.
Goodman, R. (1997). The strengths and difficulties questionnaire: A research note. Journal of Child Psychology and Psychiatry,38, 581–586.
Gough, P.B., & Tumner, W.E. (1986). Decoding, reading and reading disability.Remedial and Special Educa-tion,7, 6–10.
Griffiths, Y.M. (1999).Individual differences in develop-mental dyslexia. York: University of York.
Griffiths, Y.M., & Snowling, M.J. (2002). Predictors of exception word and nonword reading in dyslexic children: The severity hypothesis. Journal of Educa-tional Psychology,94, 34–43.
Harter, S. (1985).Manual of the Self Perception Profile for Children. Denver, CO: University of Denver. Hatcher, J., Snowling, M.J., & Griffiths, Y.M. (2002).
Cognitive assessment of dyslexic students in higher education.British Journal of Educational Psychology,
72, 119–133.
Hindson, B., Byrne, B., Fielding-Barnsley, R., Newman, C., Hine, D.W., & Shankweiler, D. (2005). Assessment and early instruction of pre-school children at risk for reading disability.Journal of Educational Psychology,
97, 687–704.
Jastak, J., & Wilkinson, G.S. (1984). Wide Range Achievement Test-Revised. Wilmington, DE: Wide Range Inc.
Lyytinen, H., Erskine, J.M., Tolvanen, A., Torppa, M., Poikkeus, A.-M., & Lyytinen, P. (2006). Trajectories of reading development; a follow-up from birth to school age of children with and without risk for dyslexia.
Merrill-Palmer Quarterly,52, 514–546.
Manly, T., Robertson, I.H., Anderson, V., & Nimmo-Smith, I. (1998). Test of Everyday Attention for Children (TEA-Ch). London: Harcourt Assessment. Maughan, B. (1995). Long-term outcomes of
develop-mental reading problems.Journal of Child Psychology and Psychiatry,36, 357–371.
Maughan, B. & Carroll, J.M. (2006). Literacy and mental disorders. Current Opinion in Psychiatry,19, 350–355.
Maughan, B., & Hagell, A. (1996). Poor readers in adulthood: Psychosocial functioning. Development and Psychopathology,8, 457–476.
McDougall, S., Hulme, C., Ellis, A.W., & Monk, A. (1994). Learning to read: The role of short-term memory and phonological skills. Journal of Experi-mental Child Psychology,58, 112–123.
Muter, V., Hulme, C., Snowling, M.J., & Stevenson, J. (2004). Phonemes, rimes, vocabulary, and gramma-tical skills as foundations of early reading development: Evidence from a longitudinal study.
Developmental Psychology,40, 665–681.
Neale, M.D. (1989). Neale analysis of reading ability: Revised British edition. Windsor, UK: NFER.
Pennington, B.F., & Lefly, D.L. (2001). Early reading development in children at family risk for dyslexia.
Child Development,72, 816–833.
Pennington, B.F., & Olson, R.K. (2005). Genetics of dyslexia. In M.J. Snowling & C. Hulme (Eds.), The science of reading: A handbook(pp. 453–472). Oxford: Blackwell.
Petrill, S.A., Deater-Deckard, K., Schatschneider, C., & Davis, C. (2005). Measured environmental influences on early reading: Evidence from an adoption study.
Scientific Studies of Reading,9, 237–259.
Rust, J., Golombok, S., & Trickey, G. (1992).Wechsler Objective Reading Dimensions. London: The Psycho-logical Corporation.
Rutter, M. (2005).Genes and behavior. Oxford: Black-well.
Scarborough, H.S. (1990). Very early language deficits in dyslexic children. Child Development, 61, 1728– 1743.
Semel, E., Wiig, E.H., & Secord, W.A. (1995). Clinical Evaluation of Language Fundamentals – Third Edition (CELFÒ–3). London: Harcourt Assessment.
Share, D.L. (1999). Phonological recoding and ortho-graphic learning: A direct test of the self-teaching hypothesis. Journal of Experimental Child Psycho-logy,72, 95–129.
Shaywitz, B.A., Holford, T.R., Holahan, J.M., Fletcher, J.M., Steubing, K.K., Fancis, D.J., et al. (1995). A Matthew effect for IQ but not for reading: Results from a longitudinal study.Reading Research Quarterly,30, 894–906.
Snowling, M.J., Gallagher, A., & Frith, U. (2003). Family risk of dyslexia is continuous: Individual differences in the precursors of reading skill.Child Development,
74, 358–373.
Stanovich, K.E. (1986). Matthew effects in reading: Some consequences of individual differences in the acquisition of literacy. Reading Research Quarterly,
21, 360–407.
Stevenson, J., & Fredman, G. (1990). The social environmental correlates of reading ability. Journal of Child Psychology and Psychiatry,31, 681–698. Torgesen, J., Wagner, R., & Rashotte, C. (1997).Test of
Word Reading Efficiency (TOWRE). Austin, TX: Pro– Ed.
Wadsworth, S., Corley, R., Hewitt, J.K., Plomin, R., & DeFries, J.C. (2002). Parent–offspring resemblance for reading performance at 7, 12 and 16 years of age in the Colorado Adoption Project. Journal of Child Psychology and Psychiatry,43, 769–774.
Zhu, J., & Garcia, E (1999). The Wechsler Abbreviated Scale of Intelligence (WASI). New York: Psychological Corporation.
Manuscript accepted 10 November 2006