i
THE EFFECT OF GREEN PERCEIVED VALUE, GREEN PERCEIVED RISK AND GREEN TRUST TO GREEN PURCHASE INTENTION PRODUCT OF
THE BODY SHOP THESIS
To achieve Management Degree of Economics and Business Faculty
Written By:
YO TENDY PRATAMA
B100112009
FACULTY OF ECONOMICS AND BUSINESS
DUAL DEGREE MANAGEMENT PROGRAM
MUHAMMADIYAH UNIVERSITY OF SURAKARTA
1
The Effect of Green Perceived Value, Green Perceived Risk and Green Trust To Green Purchase Intention Product OfThe Body Shop
Yo Tendy Pratama
Faculty of Economics and Business
Dual Degree Management Program
Muhammadiyah University of Surakarta
Email: [email protected]
ABSTRACT
The purpose of this study is to develop a framework to explore the influence of the original green perceived value and green perceived risk on green purchase intention of and to discuss the mediating role of green trust and also explore positive and negative influence. This study applies four original concepts
2
INTRODUCTION
A. BACKGROUND
The public has increasingly noticed environmental issues by reason of the disastrous environmental pollution arisen from industrial manufacturing activities in the world (Chen, 2011). Consequently, more firms are prone to accept environment protection as their social responsibility (Peattie, 1995; Dwyer, 2009; Lee, 2009). Because environmental concern has quickly become a mainstream issue as a result of global warming nowadays, more forethoughtful companies would like to utilize green opportunities (Molina-Azorı´n et al.,2009; Haden et al., 2009).
Why the body shop
Founded in 1976 by the late British environmental and human rights campaigner Dame Anita Roddick, The Body Shop started life as a small outfit in Brighton selling just 25 products. Customers were encouraged to recycle packaging (partly because Roddick didn't have enough bottles at first) and there was a real emphasis on natural ingredients that were ethically sourced and cruelty-free. Now the range consists of over 300 products and there are more than 2500 stores worldwide.
B. RESEARCH PROBLEM
This research aims to analyze and test empirically, does product quality, and brand.These problems can be derived into specific problem, that:
1. How the effect of green percieved value toward customer green trust? 2. How to the effect of green perceived risk toward customer green trust? 3. How the effect of green perceived value toward consumer green
3
4. How the effect of green perceived risk toward consumer green purchase intention?
5. How the effect of green trust toward consumer green purchase intention?
C. THE PURPOSE STUDY
Based on the research problem above the purpose of this study is to analyze. The aim of this study is toknow the determinan issues. The main purpose studys of this research are as follows:
1. To analyze the effect of green perceived value toward customer green trust.
2. To analyze the effect of green perceived risk toward customer green trust.
3. To analyze the effect of green perceived value toward consumer purchase intention.
4. To analyze the effect of green perceived risk toward consumer purchase intention.
5. To analyze the effect of greentrust toward on consumer purchase intention.
D. BENEFIT OF RESEARCH
1. Benefits that can be taken by The Body Shop is a material consideration in implementing sustainable corporate strategy for a product in order to create a positive perception of the customer in order to create competitive advantage to the company.
2. Results of this study are expected to provide information and contribute to the development of science, especially with regard to green perceived value, green perceived risk, green trust and green perceived intention.
4
LITERATURE REVIEW AND HYPOTHESIS DEVELOPMENT
H1. Green perceived value is positively effect with green trust.
The positive effect of green perceived value on green trust Perceived
value is defined as a consumer’s overall evaluation of the net benefit of a product or service based on a consumer’s appraisal (Bolton and Drew, 1991; Patterson and Spreng, 1997). Previous research has widely explored perceived value because it has a positive effect on marketing performance (Sweeney et al., 1999). Because perceived value is more important nowadays, companies can enhance consumer purchase intentions through product value (Steenkamp and Geyskens, 2006). A product can deliver value to customers
by offering them benefit and by differentiating the product from competitors’
(Zeithaml, 1988; Aaker, 1996).
H2. Green perceived risk is negatively effect with green trust.
The negative effect green perceived risk on green trust. Perceived risk is a subjective evaluation by consumers associated with possible consequences of wrong decisions (Peter and Ryan, 1976). Because perceived risk is a combination of negative consequence and uncertainty, the assessment of perceived risk would affect customer purchase decision (Peter and Ryan, 1976; Stone and Gronhaug, 1993; Aaker, 1996). Prior research asserts that perceived risk would impact consumer purchase decisions and behaviors (Chaudhuri, 1997; Mitchell, 1992).
H3. Green trust is positively associated with green purchase intentions.
5
intentions are affected by consumer trust (Harris and Goode, 2010). Past literature posits that customer trust is a determinant of consumer purchase intentions (Schlosser et al., 2006).
H4. Green perceived value is positively associated with green purchase intentions.
The positive effect green perceived value on green purchase intentions. Because consumer judgment is often based on incomplete information, perceived value of products which are acted as a signal to them would positively influence their purchase intentions (Kardes et al., 2004). Perceived value is a set of attributes which are related to the perception of a
product’s value, so it can build up a positive word-of-mouth effect and raise purchase intentions (Sweeney et al., 1999; Ashton et al., 2010).
H5. Green perceived risk is negatively associated with green purchase intentions.
6
METHODOLOGY AND DISCUSSION
The population in this study is the all customer makes apurchase of organic products in website kasku.com. In this study, the number of samples in this study amounted to 88 respondents (group the body shop) in kaskus, on the recommendation of the assumptions under lying path analysis tool (path analysis), which is a minimum of 88 respondents.
With benefits, or their income and savings they have a high involvement to the body shop. Because they are also helped by the Internet, magazines, electronic media, etc. To collect the source and find out the latest styles this study took respondents 18-30 years because of the involvement of well-known brands and purchase the body shop.
The research object of this study focuses on female consumers who have experience of purchasing products, the body shop in Indonesia. Questionnaires were purposive random sampling to consumers who have experience of purchasing information and electronics products. Randomly selected sample of respondents 18-30 years. For each randomly selected consumers to confirm he must have experience of purchase and production formation.
7
Table 1. Respondents by Item Question Answer Variable Item
Question
Respondent Answer
1 2 3 4 5
∑ % ∑ % ∑ % ∑ % ∑ %
GPR GPR1
GPR2 GPR3 1 0 3 1.1% 0.0% 3.4% 17 25 19 19.3% 28.4% 21.6% 45 43 37 51.1% 48.9% 42.0% 22 17 26 25.0% 19.3% 29.5% 3 3 3 3.4% 3.4% 3.4%
GPV GPV1
GPV2 3 2 3,4% 2.3% 13 15 13.8% 17% 33 23 37.5% 26,1% 21 21 23.9% 23.9% 18 27 20.5% 30.7%
GT GT1
GT2 GT3 4 4 6 4.5% 4.5% 6.8% 4 6 10 4.5% 6.8% 11.4% 21 21 23 23.9% 23.9% 26.1% 35 34 33 39.8% 28.6% 37.5% 24 25 16 29.3% 26.1% 18.2%
GPI GPI1
GPI2 GPI3 6 5 1 6.8% 5.7% 1.1% 11 18 27 12.5% 20.5% 30.7% 28 34 36 31.8% 38.5% 40.9% 36 26 18 30.9% 29.5% 20.5% 7 5 6 8.0% 5.7% 6.8%
Sources: Primary data were processed in 2014
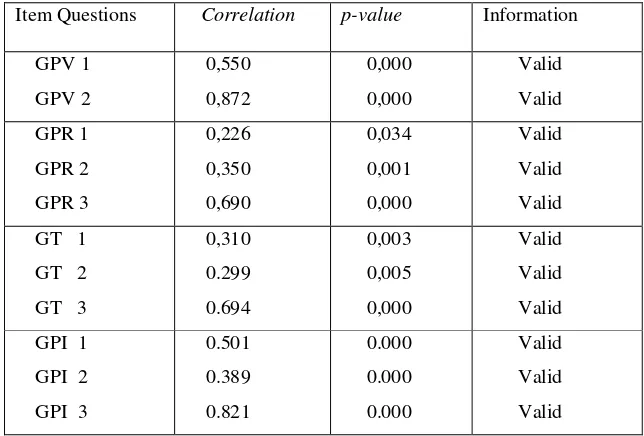
Table 2. Validity Test Item Questions
Item Questions Correlation p-value Information
GPV 1 GPV 2 0,550 0,872 0,000 0,000 Valid Valid GPR 1 GPR 2 GPR 3 0,226 0,350 0,690 0,034 0,001 0,000 Valid Valid Valid
GT 1
GT 2
GT 3
0,310 0.299 0.694 0,003 0,005 0,000 Valid Valid Valid
GPI 1
GPI 2
GPI 3
0.501 0.389 0.821 0.000 0.000 0.000 Valid Valid Valid
Sources: Primary datawereprocessedin 2014
8
Variable Alpha Correlation Information
Green Perceived Risk 0.709 Reliable
Green Perceived Value 0.611 Reliable
Green Trust 0.635 Reliable
Green Purchase Intention 0.672 Reliable
Sources: Primary data were processed in 2014
The data in Table 3 it can be seen that the alpha correlation preponderant 0.6 indicates that the question which is an indicator of variable Green Perceived Risk, Perceived Value of Green, Green Trust and Purchase Intention Green is reliable.
Table 4. Multicollinearity Test
Variable VIF Information
Green Perceived Risk
Green Perceived Value
Green Trust
1,118
1,121
1,142
Not occur multicollinearity
not occur multicollinearity
not occur multicollinearity
Sources: Out put SPSS in 2014
From table 4 above shows that the VIF value of all independent variables have VIF value>10, which means that the regression equation there is no multicollinearity.
Table 5. Regression Analysis 1
Model
Unstandardized Coefficients
Standardized Coefficients
T Sig.
B Std. Error Beta
1 (Constant) 7.416 1.844 4.023 .000
GPV .238 .113 .201 2.108 .038
GPR -.336 .121 -.266 -2.788 .007
GT .300 .092 .314 3.264 .002
9
Table 5 Data addressing the regression coefficients on variables GPV (0.201) shows a positive value, ie the direction o fa significant relationship exists between GPV against GPI variables (sig. 0.038), meaning that if the higher GPV then GPI will increase. While the regression coefficient on the variable GPR (-0.266) shows a negative value, ie there is a significant inverse relationship between GPR to GPI (sig. 0.007), meaning that if the higher GPR then GPI getting down. And the regression coefficient CM (0.314) shows a positive value, ie the direction of a significant relationship exists between the variables GT GPI (sig. 0.002).
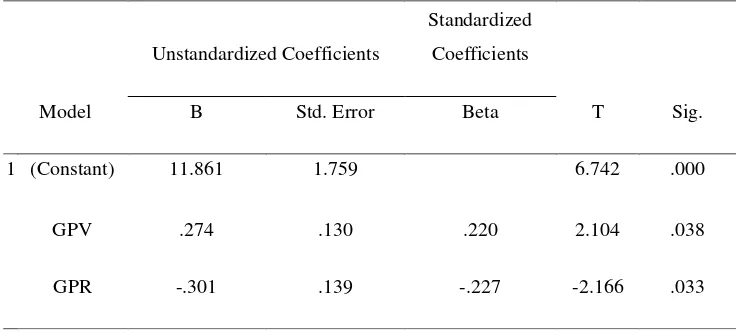
Table 6. Regression Analysis 2
Model
Unstandardized Coefficients
Standardized
Coefficients
T Sig.
B Std. Error Beta
1 (Constant) 11.861 1.759 6.742 .000
GPV .274 .130 .220 2.104 .038
GPR -.301 .139 -.227 -2.166 .033
a. Dependent Variable: GT
10
CONCLUSIONS AND SUGGESTION
A. CONCLUSIONS
1. The Green Perceived Value has a positive relationship to the Green Trust.
2. Green Perceived Risk has a negative relationship to the Green Trust
3. Perceived Green Trust has a positive relationship to the Green Purchase Intentions.
4. The Green Perceived Value has a positive relationship to the Green Purchase Intentions.
5. Green Perceived Risk has a negative relationship to the Green Purchase Intentions.
B. SUGGESTIONS
If companies want to adopt a successful green marketing, green marketing concept should integrate into all aspects of marketing activities on a regular basis and do green marketing strategies better.This study has several limitations, among others, from the aspects of sampling, the data obtained can not describe the behavior of these consumers so it is advisable for future studies to fix it and because of the persistence of variables outside of the research that affect green purchase intentions, because will improve the generalization of research results as well as having a higher value of benefits.
REFERENCES
11
Akehurst Gary, Afonso Carolina, and Goncalves Helena Martins. 2012. The Roles Of Green Perceived Value, Green Perceived Risk, And Green Trust To Green Purchase Intention, Management decision vol.50 no.5
Bolton, R.N. and Drew, J.H. (1991), “A multistage model of consumers’ assessment of service quality and value”, Journal of Consumer Research,
Vol. 17 No. 4, pp. 375-84.
Chang, H.H. and Chen, S.W. (2008), “The impact of online store environment
cues on purchase intention: trust and perceived risk as a mediator”,
Online Information Review, Vol. 32 No. 6, pp. 818-41.
Chaudhuri, A. (1997), “Consumption emotion and perceived risk: a macro
-analytic approach”, Journal of Business Research, Vol. 39 No. 1, pp. 81 -92.
Chen Yu-Shan, Chang Ching-Hsun. 2012. Enhance Green Purchase Intentions:The Roles Of Green Perceived Value, Green Perceived Risk, And Green Trust, Management Decision Vol. 50 No. 3, 2012
Chen Yu-Shan, changchimg-hsun. 2013. Towards Green Trust : The Influences Of Green Percieved Risk. And Green Satisfaction. Management decision vol.51.no.1 2013
Dwyer, R.J. (2009), “Keen to be green organizations: a focused rules approach to
accountability”,Management Decision, Vol. 47 No. 7, pp. 1200-16. Engel, J.F., Blackwell, R.D. and Miniard, P.W. (1986), Consumer Behavior, The
Dryden Press, Chicago, IL.
Ghozali, Imam. 2005. AplikasiAnalisis Multivariate dengan program SPSS,BadanPenerbitUniversitasDiponegoro, Semarang.
Gregg, D.G. and Walczak, S. (2008), “Dressing your online auction business for
12
Harridge-March, S. (2006), “Can the building of trust overcome consumer
perceived risk online?”,Marketing Intelligence & Planning, Vol. 24 No.
7, pp. 746-61.
Kardes, F.R., Posavac, S.S. and Cronley, M.L. (2004), “Consumer inference: a review of processes,bases, and judgment contexts”, Journal of Consumer
Psychology, Vol. 14 No. 3, pp. 230-56.
Mishra, D.P., Heide, J.B. and Cort, S.G. (1998), “Information asymmetry and levels of agencyrelationships”, Journal of Marketing Research, Vol. 35
No. 3, pp. 277-95.
Murphy, Enis. 1986. Green Marketing, Public Policy and Managerial Strategies.
Journal of Business Strategy and The Environment.Vol 11 P. 285-297.
Mitchell, V.W. (1999), “Consumer perceived risk: conceptualizations and models”, European Journal of Marketing, Vol. 33 No. 1, pp. 163-95. Molina-Azorı´n, J.F., Claver-Corte´s, E., Lo´pez-Gamero, M.D. and Tarı´, J.J.
(2009), “Green management and financial performance: a literature review”, Management Decision, Vol. 47 No. 7, pp. 1080-100.
Peter, J.P. and Ryan, M.J. (1976), “An investigation of perceived risk at the brand
level”, Journal of Marketing Research, Vol. 13 No. 2, pp. 184-9.
Patterson, P. and Spreng, R. (1997), “Modeling the relationship between
perceived value, satisfaction and repurchase intention in a business-to- business, service context: an empirical examination”, International Journal of Service Industry Management, Vol. 8 No. 5, pp. 414-34.
Rotter, J.B. (1971), “Generalized expectancies for interpersonal trust”, American
Psychologist,Vol. 26 No. 5, pp. 443-50.
Schurr, P.H. and Ozanne, J.L. (1985), “Influences on exchange processes: buyers’ preconceptionsof a seller’s trustworthiness and bargaining toughness”,
13
Steenkamp, J.B.E.M. and Geyskens, I. (2006), “How country characteristics affect
the perceivedvalue of web sites”, Journal of Marketing, Vol. 70 No. 3,
pp. 136-50.
Stone, R.N. and Gronhaug, K. (1993), “Perceived risk: further considerations for the marketing discipline”, European Journal of Marketing, Vol. 27 No. 3, pp. 39-50.
Sweeney, J.C. and Soutar, G.N. (2001), “Consumer perceived value: the development of a multipleitem scale”, Journal of Retailing, Vol. 77 No.
2, pp. 203-20.
Sweeney, J.C., Soutar, G.N. and Johnson, L.W. (1999), “The role of perceived risk in thequality-value relationship: a study in a retail environment”, Journal of Retailing, Vol. 75No. 1, pp. 77-105.
Wood, C.M. and Scheer, L.K. (1996), “Incorporating perceived risk into models of consumer dealassessment and purchase intent”, in Corfman, K.P. and Lynch, J.G. Jr (Eds), Advances inConsumer Research, Vol. 23, Aassociation for Consumer Research, Provo, UT, pp. 399-406.
Zeithaml, V.A. (1988), “Consumer perceptions of price, quality, and value: a
means-end model and synthesis of evidence”, Journal of Marketing, Vol. 52 No. 3, pp. 2-22.