Correspondence:
Sitti Juhana Dwidarti, Physical Medicine and Rehabilitation Polyclinic, Cicalengka Hospital, Kabupaten Bandung
Jl. H. Darham, No. 35 Cikopo Desa Tenjolaya, Cicalengka, Kabupaten Bandung, Jawa Barat, Indonesia
e-mail: [email protected]
Effects of Core Strength Training Using Stable Versus Unstable Surfaces
on Lower Body Quality in 8
thGrade Male and Female Students in a Junior
High School in Bandung
Sitti Juhana Dwidarti,1 Tertianto Prabowo,2 Ellyana Sungkar2
1Physical Medicine and Rehabilitation Clinic, Cicalengka Hospital, Bandung District
2Department of Physical Medicine and Rehabilitation, Universitas Padjadjaran-Dr. Hasan Sadikin General Hospital, Bandung
Abstract Objective: To investigate the effects of core strength training performed on
stable (CSTS) compared to unstable surfaces (CSTU) on physical fitness in
school-aged boys and girls.
Methods: In this study, 72 (36 males, 36 females) untrained healthy subjects (mean age: 14±1 years, age range: 13–15 years) were randomly assigned to a CSTS group for stable surface (n = 36; 18 males and 18 females) or a CSTU group for unstable surface (n = 36; 18 males and 18 females). Core strength training performed on stable as compared to unstable surfaces were assessed on pre- and post-tests. Training period lasted 6 weeks (2 sessions/week). The
components of physical fitness were assessed using standing long jump test,
stand-and-reach test, 20-m sprint test, jumping sideway test, and y balance test.
Results: This study showed significant results in increased components
of physical fitness in both CSTS and CSTU groups (p<0.05). The increase of physical fitness for CSTU was better than CSTS (p<0.05). There were differences of physical fitness between gender in both groups (p<0.05) except
for stand-and-reach test (p>0.05).
Conclusions: Core strength training performed on unstable and stable
surfaces increases all components of physical fitness in youths. Core strength
training performed on unstable surface can better improve the physical
fitness compared to the stable surface. There were differences of physical fitness between gender in both groups except for stand-and-reach test.
Keywords:Resistance training, physical fitness, gender
pISSN: 2302-1381; eISSN: 2338-4506; http://doi.org/10.15850/ijihs.v6n1.1050 IJIHS. 2018;6(1):11–21
Introduction
Exercise physiology experts have agreed that exercises performed routinely in a scalable and programmed manner will affect the growth and development of children.1,2 A study in
Indonesia found that different physical activity levels affect physical fitness in boys and girls aged 13–15 years.3
Anatomically, core can be represented as the muscular box with the abdomen in the front, the paraspinals and gluteus at the back, the diaphragm as the roof, and the pelvic floor and hip girdle musculature as the bottom.4,5
Functionally, the core can be thought of as the kinetic link that facilitates the transfer of torques and angular momentum between the lower and upper extremities that is of vital importance for sport-specific and everyday activities in different age groups.4,6,–8 The core
strength training may have the potentials to improve the core muscle strength as well as health-related (i.e., strength, flexibility) and skill-related (i.e., balance, coordination, speed) components of physical fitness in youth.4,9
Received: July10, 2017
Revised:
November 17, 2017
Several daily and sports-related activities may occur on relatively unstable surfaces such as walking on cobblestone pavements jumping on uneven natural turf, landing on sand during beach-volleyball, and kicking a ball while being impeded by an opponent. Thus, according to the concept of training specificity, training must attempt to closely address the demands of these activities.4 In this regard, Behm and
Colado-Sanchez have propagated strength training using unstable surfaces and/or devices to enhance performance and increase the musculoskeletal health in youth and old adults.4,10 In a recent study, a group performing
9-week progressive core strength training on unstable surfaces in community-dwelling old adults (age: 63–80 years) was compared to a passive control group. The intervention group presented significantly improved measures of trunk muscle strength, spinal mobility, functional mobility, and dynamic balance. It was concluded that core strength training conducted on unstable surfaces is a feasible and effective exercise program for attenuating age-related performance decrements among older adults.4,11 The use of unstable surfaces
during youth strength training might be particularly beneficial due to the fact that the balance and coordination are not yet fully developed in school-aged children.12 Unstable
elements in strength training exercises lead to substantial force decrements while at the same time overall muscle activity appears to remain unchanged.13,14 That reduced loads
combined with high repetitions still represent a sufficient training stimulus in youth which is why strength training performed on unstable surfaces seems to be well-suited for the promotion of health-related and skill-related components of physical fitness in youth.7,8,14
Therefore, this study aimed to investigate the effects of core strength training performed on stable (CSTS) compared to unstable surfaces (CSTU) on physical fitness in school-aged boys and girls.
Methods
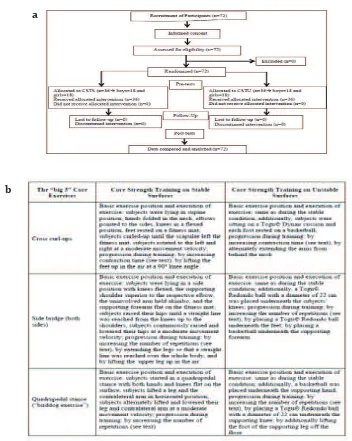
This was randomized controlled study with 72 boys and girls participated in this study. The experimental procedures were explained (Fig. 1a). The participants included 8th grade
students in SMPN 27 Bandung, a public junior high school in Bandung, who were recruited between September and October 2015. All participants could be classified as physically active according to the PAQ-C
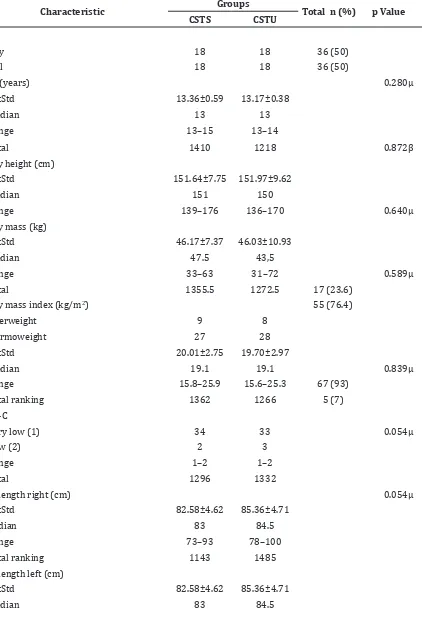
questionnaire. Characteristics of the study population were also described (Table 1). All participants were eligible for inclusion in this study because the participants had no history of musculoskeletal, neurological or orthopedic disorders that might affect the ability to perform physical fitness tests and core strength training. Furthermore, none had previously participated in systematic strength or balance training. Parents’ and participants’ informed consents were obtained before the start of the study. Ethical approval was given by the Health Research Ethic Committee, Faculty of Medicine, Universitas Padjadjaran.
The two programs were supervised and conducted by 2 physiotherapists. The ratio of participant-to-supervisor was kept small for both intervention groups with 2 supervisors to 9 participants. Both programs include circuit training with each instructor supervising 4–5 participants. Both training programs lasted 6 weeks and 2 training sessions per week with a total of 12 training sessions. Each training session lasted 30 min, starting with warm-up and ending with a cool-down program. Both groups mainly conducted the “big 3” exercises (curl-up, side bridge, and quadruped position). A detailed description of the core exercises was portrayed (Fig. 1b).
During the training weeks 1–2, participants from the CSTS and CSTU groups performed exercises with 3 sets per exercise and 40 s contraction time or 20 repetitions. During training weeks 3–4, the contraction times and repetitions were increased to 45 s or 23 repetitions. During training weeks 5–6, the contraction times and repetitions were increased to 50 s or 25 repetitions. The rest between sets was similar to the respective contraction time (e.g., 40 s during weeks 1–2). An additional 2–3 min rest was given between exercises.
Prior to pre- and post-tests, all participants underwent a standardized 5-minutes warm-up consisting of skipping exercises. Thereafter, physical fitness tests were assessed.
Standing long jump test has been considered a general index of muscular fitness in youth. Subjects were instructed to stand with both feet right behind a starting line and to jump as far as possible. The best trial in terms of maximal distance was from the starting line to the landing point at heel contact.
Fig. 1 Flow Chart of Participants (a), Description of the Two Programs (b) a
b
Spinal and pelvic flexibility was then tested using the stand-and-reach test. All subjects were instructed to start the test in a standing position on an elevated platform while putting their feet together. They were then asked to bend over using their maximal range of motion. During the test, knees, arms, and fingers were fully extended. A tape measure was attached to the platform.
The jumping sideways test evaluates motor coordination under time pressure. Subjects
were instructed to jump as many times as possible over a period of 15 s with both legs together back and forth across a strip of wood that was attached to a mat (50 × 100 cm).
Table 1 Participant Characteristics
Characteristic Groups Total n (%) p Value
CSTS CSTU
Sex
Boy 18 18 36 (50)
Girl 18 18 36 (50)
Age (years) 0.280μ
M±Std 13.36±0.59 13.17±0.38
Median 13 13
Range 13–15 13–14
Total 1410 1218 0.872β
Body height (cm)
M±Std 151.64±7.75 151.97±9.62
Median 151 150
Range 139–176 136–170 0.640μ
Body mass (kg)
M±Std 46.17±7.37 46.03±10.93
Median 47.5 43,5
Range 33–63 31–72 0.589μ
Total 1355.5 1272.5 17 (23.6)
Body mass index (kg/m2) 55 (76.4)
Overweight 9 8
Normoweight 27 28
M±Std 20.01±2.75 19.70±2.97
Median 19.1 19.1 0.839μ
Range 15.8–25.9 15.6–25.3 67 (93)
Total ranking 1362 1266 5 (7)
PAQ-C
Very low (1) 34 33 0.054μ
Low (2) 2 3
Range 1–2 1–2
Total 1296 1332
Leg length right (cm) 0.054μ
M±Std 82.58±4.62 85.36±4.71
Median 83 84.5
Range 73–93 78–100
Total ranking 1143 1485
Leg length left (cm)
M±Std 82.58±4.62 85.36±4.71
Range 73–93 78–100
Total 1143 1485
Note: M = mean; Std = standard deviation; t test (β); Mann Whitney test (μ)
documented after each reach. A composite score was measured by using the formula of (CS) = [(maximum anterior reach distance + maximum posteromedial reach distance + maximum posterolateral reach distance)/(leg length × 3)] × 100.
Initially, descriptive statistics were done for all variables, followed by the normality test using the Saphiro-Wilks test. Hypothesis test of physical fitness before and after core exercise for both kinds of surfaces. If there are differences between the gender in the physical fitness test the hypothesis then separated for girl and for boy.
Analysis of the data used in this study is the t-test to compare the difference between two average data that were independent and normally distributed between the core exercise group on stable and unstable surfaces. For data that were not normally distributed, Mann Whitney test was used. To tests the difference in the average value before and after practice, the t-test was used when the data was normally distributed while the Wilcoxon Match Pair test was used for data that were not normally distributed. The significance level was set at p≤0.05.
Results
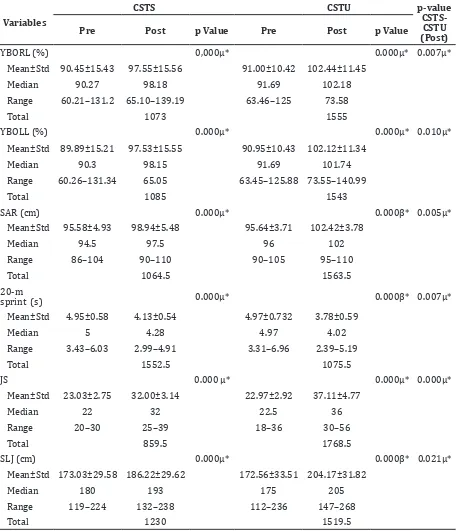
The results for all outcome variables in pre- and post-intervention results for all outcome variables are described (Table 2). In this study, no statistically significant differences were found in the baseline between the 2 intervention groups (p>0.05). A significant difference (p<0.05) for all variables was found in the pre- and post-intervention for both groups. All variables of physical fitness tests on CSTU group were higher than those of the CSTS group after intervention and for 20-m sprint test, the CSTU group was faster than CSTS group.
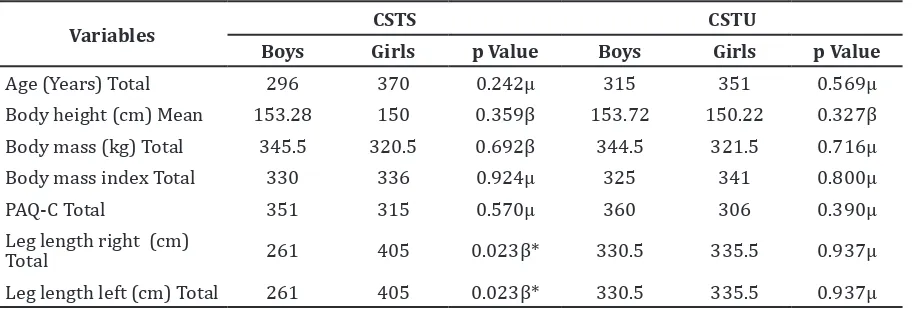
No significant difference in characteristics was found between boys and girls participated in this study (p>0.05) for all variables, except that the participants in CSTS group significantly different (p<0.05) for the length of the right leg and left leg length were described (Table 3).
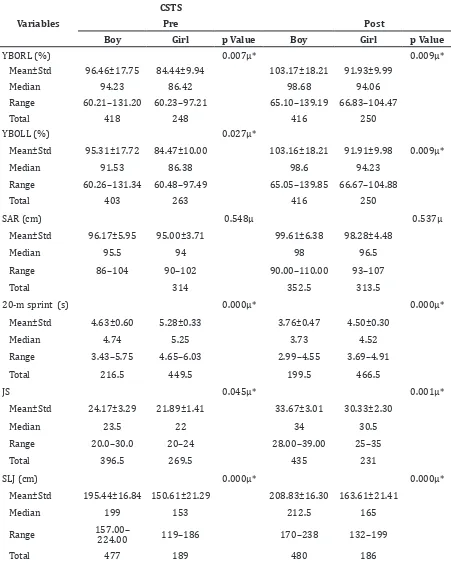
There were significant differences in almost all physical fitness test results between boys
and girls in the CSTS group both in pre- and post-intervention (p<0.05), except for stand-and-reach test (p>0.05) (Table 4).
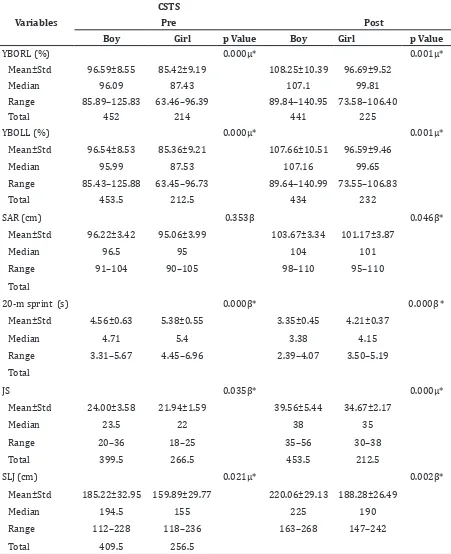
There were also significant differences in almost all physical fitness test results between boys and girls in the CSTU group both in pre- and post-intervention (p<0.05), except for stand-and-reach test in pre-intervention results (p>0.05) (Table 5).
Discussion
The main findings of this study are that (1) performance in physical fitness tests (i.e., standing long jump test, 20-m sprint test, stand-and-reach test, jumping sideways test, Y balance test) was significantly improved in both intervention groups over the 6-week training period; (2) CSTU as compared to CSTS has additional effects on physical fitness; (3) there are differences in physical fitness between gender except for the stand-and-reach test.
The present results are in accordance with the literatures regarding the effects of core strength training on TMS and physical fitness in youth. Following 6 weeks of core strength training (e.g., low plank obliques, push-up jacks) conducted during physical education classes (1 session/week), Allen et al. 9 have
found significant performance enhancement (f=0.27–0.69) in 5 different trunk muscle endurance tests (i.e., Parallel Roman Chair Dynamic Back Extension, Prone Plank, Lateral Plank, Dynamic Curl-Up, Static Curl-up) in healthy untrained children with a mean age of 11 years. In a randomized controlled trial, Hoshikawa et al.15 investigated the effects
Table 2 Effects of the Two Programs on Measures of Physical Fitness
Variables
CSTS CSTU p-value
CSTS-CSTU (Post)
Pre Post p Value Pre Post p Value
YBORL (%) 0,000μ* 0.000μ* 0.007μ*
Mean±Std 90.45±15.43 97.55±15.56 91.00±10.42 102.44±11.45
Median 90.27 98.18 91.69 102.18
Range 60.21–131.2 65.10–139.19 63.46–125 73.58
Total 1073 1555
YBOLL (%) 0.000μ* 0.000μ* 0.010μ*
Mean±Std 89.89±15.21 97.53±15.55 90.95±10.43 102.12±11.34
Median 90.3 98.15 91.69 101.74
Range 60.26–131.34 65.05 63.45–125.88 73.55–140.99
Total 1085 1543
SAR (cm) 0.000μ* 0.000β* 0.005μ*
Mean±Std 95.58±4.93 98.94±5.48 95.64±3.71 102.42±3.78
Median 94.5 97.5 96 102
Range 86–104 90–110 90–105 95–110
Total 1064.5 1563.5
20-m
sprint (s) 0.000μ* 0.000β* 0.007μ*
Mean±Std 4.95±0.58 4.13±0.54 4.97±0.732 3.78±0.59
Median 5 4.28 4.97 4.02
Range 3.43–6.03 2.99–4.91 3.31–6.96 2.39–5.19
Total 1552.5 1075.5
JS 0.000 μ* 0.000μ* 0.000μ*
Mean±Std 23.03±2.75 32.00±3.14 22.97±2.92 37.11±4.77
Median 22 32 22.5 36
Range 20–30 25–39 18–36 30–56
Total 859.5 1768.5
SLJ (cm) 0.000μ* 0.000β* 0.021μ*
Mean±Std 173.03±29.58 186.22±29.62 172.56±33.51 204.17±31.82
Median 180 193 175 205
Range 119–224 132–238 112–236 147–268
Total 1230 1519.5
Note: Significance value based on the p-value <0,05 (*).
Table 3 Characteristics of Boys and Girls
Variables CSTS CSTU
Boys Girls p Value Boys Girls p Value
Age (Years) Total 296 370 0.242μ 315 351 0.569μ
Body height (cm) Mean 153.28 150 0.359β 153.72 150.22 0.327β
Body mass (kg) Total 345.5 320.5 0.692β 344.5 321.5 0.716μ
Body mass index Total 330 336 0.924μ 325 341 0.800μ
PAQ-C Total 351 315 0.570μ 360 306 0.390μ
Leg length right (cm)
Total 261 405 0.023β* 330.5 335.5 0.937μ
Leg length left (cm) Total 261 405 0.023β* 330.5 335.5 0.937μ
Note. Significance value based on the p-value <0,05 (*)
strength, cross-sectional area of trunk muscles, and athletic performance. With respect to hip strength and physical fitness measures, both intervention groups showed significant but similar performance enhancements in peak torque of the hip flexors (combined training group: f=0.45, isolated training group: f=0.74) and in 15-m sprint test (combined training group: f = .56, isolated training group: f=0.40) following training. However, the relative change in peak hip extensor torque was found to be significantly higher in the combined (f=1.26) as compared to the isolated (f = 0.68) training group. Furthermore, significant gains in squatting (combined training group: f=0.33, soccer training group: f=0.06) and countermovement jump heights (combined training group: f=0.62, soccer training group: f=0.12) were observed in the combined training group only.15 Our findings extend the
existing results in as much as we additionally observed improvements in the measures for the flexibility, coordination, and balance following core strength training in youths. With reference to the literature and our own findings, core strength training appears to be a well-suited conditioning program to promote the health- and skill-related physical fitness in youth. 9,10 The positive effects of core strength
training on the physical performance of the lower extremities can most likely be explained by the specific role of the trunk as a linkage between upper and lower extremities. During every-day or sports-related rotational torso movements, trunk muscles generate torque along diagonal proximal to distal path to enhance the extremity force production. 9,10
Konin et al. referred to this as serape (or “shawl-like”) effect. Scientific evidence was provided by Kibler who was able to show that 51% of total kinetic energy and 54% of total force are developed in the hip and trunk muscles during the tennis serve of professional athletes.6,16
Young et al.17 stated that the muscles belonging
to the global system (e.g., erector spinae, rectus abdominis, internal/external obliques, latissimus dorsi) primarily generate torque in a serape-like manner during the rotational movements (e.g., throwing). Moreover, the trunk acts as a kinetic link that facilitates the transfer of torques and angular momenta between upper and lower extremities during the execution of whole body movements as part of sports and occupational skills, fitness activities, and activities of daily living. There is evidence for this hypothesis which indicates that during normal human movement, trunk muscle activations (e.g., musculus transversus abdominis) are organized well ahead (110 ms) in anticipation of movement or perturbation to balance in healthy young adults.17 Hodges
Effects of the Two Programs on Measures of Physical Fitness in Boys and Girls in CSTS Group
Table 4
Variables
CSTS
Pre Post
Boy Girl p Value Boy Girl p Value
YBORL (%) 0.007μ* 0.009μ*
Mean±Std 96.46±17.75 84.44±9.94 103.17±18.21 91.93±9.99
Median 94.23 86.42 98.68 94.06
Range 60.21–131.20 60.23–97.21 65.10–139.19 66.83–104.47
Total 418 248 416 250
YBOLL (%) 0.027μ*
Mean±Std 95.31±17.72 84.47±10.00 103.16±18.21 91.91±9.98 0.009μ*
Median 91.53 86.38 98.6 94.23
Range 60.26–131.34 60.48–97.49 65.05–139.85 66.67–104.88
Total 403 263 416 250
SAR (cm) 0.548μ 0.537μ
Mean±Std 96.17±5.95 95.00±3.71 99.61±6.38 98.28±4.48
Median 95.5 94 98 96.5
Range 86–104 90–102 90.00–110.00 93–107
Total 314 352.5 313.5
20-m sprint (s) 0.000μ* 0.000μ*
Mean±Std 4.63±0.60 5.28±0.33 3.76±0.47 4.50±0.30
Median 4.74 5.25 3.73 4.52
Range 3.43–5.75 4.65–6.03 2.99–4.55 3.69–4.91
Total 216.5 449.5 199.5 466.5
JS 0.045μ* 0.001μ*
Mean±Std 24.17±3.29 21.89±1.41 33.67±3.01 30.33±2.30
Median 23.5 22 34 30.5
Range 20.0–30.0 20–24 28.00–39.00 25–35
Total 396.5 269.5 435 231
SLJ (cm) 0.000μ* 0.000μ*
Mean±Std 195.44±16.84 150.61±21.29 208.83±16.30 163.61±21.41
Median 199 153 212.5 165
Range 157.00–224.00 119–186 170–238 132–199
Total 477 189 480 186
Effects of the Two Programs on Measures of Physical Fitness in Boys and Girls in CSTU Group
Table 5
Variables
CSTS
Pre Post
Boy Girl p Value Boy Girl p Value
YBORL (%) 0.000μ* 0.001μ*
Mean±Std 96.59±8.55 85.42±9.19 108.25±10.39 96.69±9.52
Median 96.09 87.43 107.1 99.81
Range 85.89–125.83 63.46–96.39 89.84–140.95 73.58–106.40
Total 452 214 441 225
YBOLL (%) 0.000μ* 0.001μ*
Mean±Std 96.54±8.53 85.36±9.21 107.66±10.51 96.59±9.46
Median 95.99 87.53 107.16 99.65
Range 85.43–125.88 63.45–96.73 89.64–140.99 73.55–106.83
Total 453.5 212.5 434 232
SAR (cm) 0.353β 0.046β*
Mean±Std 96.22±3.42 95.06±3.99 103.67±3.34 101.17±3.87
Median 96.5 95 104 101
Range 91–104 90–105 98–110 95–110
Total
20-m sprint (s) 0.000β* 0.000β *
Mean±Std 4.56±0.63 5.38±0.55 3.35±0.45 4.21±0.37
Median 4.71 5.4 3.38 4.15
Range 3.31–5.67 4.45–6.96 2.39–4.07 3.50–5.19
Total
JS 0.035β* 0.000μ*
Mean±Std 24.00±3.58 21.94±1.59 39.56±5.44 34.67±2.17
Median 23.5 22 38 35
Range 20–36 18–25 35–56 30–38
Total 399.5 266.5 453.5 212.5
SLJ (cm) 0.021μ* 0.002β*
Mean±Std 185.22±32.95 159.89±29.77 220.06±29.13 188.28±26.49
Median 194.5 155 225 190
Range 112–228 118–236 163–268 147–242
Total 409.5 256.5
References
1. Klentrou P. Influence of exercise and training on critical stages of bone growth and development.
Pediatr Exerc Sci. 2016;28(2):178–86.
2. Chahar PS. Physiological basis of growth and development among children and adolescent in relation to physical activity. Am J Sports Sci Med. 2014;2(5):17–22.
3. Peltzer K, Pengpid S. Leisure time physical inactivity and sedentary behaviour and lifestyle correlates among students aged 13–15 in the Association of Southeast Asian Nations (ASEAN) member states, 2007–2013. Int J Environ Res Public Health. 2016;13(2):217–8. 4. Granacher U, Schellbach J, Klein K, Prieske
muscles are characterized by a relatively high proportion of type I (slow-twitch) fibers.10
Interestingly, the performance during physical fitness tests significantly improved although postural positions during training and testing conditions were different (i.e., horizontal lying during training vs. upright standing during testing). Despite this difference, transfer effects were noticed from the core strength exercises performed in vertical directions while lying in horizontal positions to proxies of physical fitness predominately performed in vertical position.18 Future studies have
to elucidate whether core strength training programs conducted in an upright standing position (e.g., Romanian deadlift) may be even more effective in enhancing components of physical fitness in adolescents. By integrating unstable surfaces in our CSTU exercise protocol, we specifically aimed at activating the deep muscles that are responsible for trunk stability. Nevertheless, our findings indicate that CSTU as compared to CSTS has only limited additional effects (i.e., stand-and-reach test) on physical fitness. In this regard, the previous study compared trunk muscle activities (which inludes rectus abdominis, external or internal oblique, transversus abdominis, erector spinae) during resistance exercises (i.e., back squat, dead lift, overhead press, curl lifts) performed on stable ground versus the BOSU Balance Trainer in trained young men.18 The main finding of this study
was that no significant differences were found in activity across all examined muscles and lifts when performing the resistance exercises on the BOSU Balance Trainer as compared to stable ground. The authors concluded that the tested resistance exercises can be performed on stable ground without losing the potential trunk muscle training benefits. Our findings regarding the limited additional effects of CSTU as compared to CSTS are in line with the results of this cross-sectional study. To the authors’ knowledge, there is no other study available in the literature that compared the effects of
CSTS versus CSTU on measures of physical fitness. Therefore, we will discuss a study that investigated the effects of lower extremity strength training using stable versus unstable surfaces on athletic performance in healthy, trained individuals. Both intervention groups performed the same exercises (e.g., squats, deadlifts, lunges, single-leg squats) at identical training volumes but on different training surfaces (stable vs. unstable). Following 10 weeks of training, findings were inconsistent in as much as the unstable group showed significantly greater improvements than the stable group in sprint time (stable group: f=1.33, unstable group: f=1.50) and in agility performance (stable group: f=0.97, unstable group: f=1.60). In terms of drop jump power performance, both groups showed similar performance enhancements (stable group: f =0.26, unstable group: f=0.11).19
Seryozha et al.20 have conducted research
in children aged 6–18 years. The result of the study stated that the standing long jump test results can be affected by age, BMI, and gender. Boys showed better results in the standing long jump test than girls and this defferences becomes greater with age. There is improved performance in several tests on boys than girls aged 13–15 in dashes (speed) and the shuttle runs (agility and speed); vertical, standing long jumps and distance throw (coordination and explosive strength); flexed arm hang and sit-ups (local muscular endurance); beam walk and flamingo stand (balance).20
O, Baeyens JP, Muehlbauer T. Effects of core strength training using stable versus unstable
surfaces on physical fitness in adolescents: a
randomized controlled trial. BMC Sports Sci Med Rehabil. 2014;6(1):40–1.
5. Akuthota V, Ferreiro A, Moore T, Fredericson M.
Core stability exercise principles. Curr Sports
Med Rep. 2008;7(1):39–44.
6. Kibler WB, Press J, Sciascia A. The role of core stability in athletic function. Sports Med. 2006;36(3):189–98.
7. Nesser TW, Huxel KC, Tincher JL, Okada T: The relationship between core stability and performance in division I football players. J Strength Cond Res. 2008;22(6):1750–4.
8. Okada T, Huxel KC, Nesser TW. Relationship between core stability, functional movement, and performance. J Strength Cond Res. 2011;25(1):252–61.
9. Allen BA, Hannon JC, Burns RD, Williams SM. Effect of a core conditioning intervention on tests of trunk muscular endurance in school-aged children. J Strength Cond Res. 2014;28(7):2063–70.
10. Behm DG, Colado JC, Sanchez JC. Instability
resistance training across the exercise
continuum. Sports Health. 2013;5(6):500–3. 11. Granacher U, Lacroix A, Muehlbauer T, Roettger
K, Gollhofer A. Effects of core instability strength training on trunk muscle strength, spinal mobility, dynamic balance and functional mobility in older adults. Gerontology. 2013;59(2):105–13.
12. Behm DG, Muehlbauer T, Kibele A, Granacher U. Effects of strength training using unstable surfaces on strength, power and balance performance across the lifespan: a systematic review and meta-analysis. Sports Med. 2015;45(10):1645–69.
13. Anderson KG, Behm DG: Maintenance of EMG
activity and loss of force output with instability. J Strength Cond Res. 2004;18(3):637–40. 14. Filipa A, Byrnes R, Paterno MV, Myer GD,
Hewett TE. Neuromuscular training improves
performance on the star excursion balance test
in young female athletes. J Orthop Sports Phys Ther. 2010;40(9):551–8.
15. Hoshikawa Y, Lida T, Muramatsu M, Ii N, Nakajima Y, Chumank K, et al. Effects of stabilization training of trunk muscularity and physical performance in youth soccer players. J Strength Cond Res. 2013,27;(11)3142–9. 16. Konin JG, Beil N, Werner G. Facilitating the
serape effect to enhance extremity force
production. Athlet Ther Today. 2003;8(2):54– 6.
17. Young JL, Herring SA, Press JM, Casazza BA.
The influence of the spine on the shoulder in
the throwing athlete. J Back Musculosceletal Rehabil. 1996;7(1):5–17.
18. Granacher U, Schellbach J, Klein K, Prieske O, Baeyens JP, Muehlbauer T. Effects of core strength training using stable versus unstable
surfaces on physical fitness in adolescents: a
randomized controlled trial. BMC Sports Sci Med Rehabil. [serial on the internet]. 2014 Nov [cited 2017 Jan 22];6(40):[about 11p.]. Available from: https://www.ncbi.nlm.nih. gov/pmc/articles/PMC4290805/.
19. Cressey EM, West CA, Tiberio DP, Kraemer WJ, Maresh CM. The effects of ten weeks of lower body unstable surface training on markers of athletic performance. J Strength Cond Res. 2007;21(2):561–7.