“Cellulose nanopaper structures of high toughness,”Biomacromolecules, vol. 9, no. 6, pp. 1579–1585, 2008.
[4] A. J. Svagan, M. A. S. Azizi Samir, and L. A. Berglund, “Biomimetic polysaccharide nanocomposites of high cellulose content and high tough-ness,”Biomacromolecules, vol. 8, no. 8, pp. 2556–2563, 2007. [5] S. J. Eichhorn, A. Dufresne, M. Aranguren, N. E. Marcovich,
J. R. Capadona, S. J. Rowan, C. Weder, W. Thielemans, M. Roman, S. Renneckar, W. Gindl, S. Veigel, J. Keckes, H. Yano, K. Abe, M. Nogi, A. N. Nakagaito, A. Mangalam, J. Simonsen, A. S. Benight, A. Bismarck, L. A. Berglund, and T. Peijs, “Review: Current international research into cellulose nanofibres and nanocomposites,”J. Mater. Sci., vol. 45, no. 1, pp. 1–33, 2010.
[6] Ø. Eriksen, K. Syverud, and Ø. Gregersen, “The use of microfibrillated cellulose produced from kraft pulp as a strength enhancer in TMP paper,” Nordic Pulp Paper Res. J., vol. 23, no. 3, pp. 299–304, 2008.
[7] K. M¨orseburg and G. Chinga-Carrasco, “Assessing the combined bene-fits of clay and nanofibrillated cellulose in layered TMP-based sheets,” Cellulose, vol. 16, no. 5, pp. 795–806, 2009.
[8] P. Saketi, M. Essen, M. Mikczinski, S. Heinemann, S. Fatikow, and P. Kallio, “A flexible microrobotic platform for handling microscale spec-imens of fibrous materials for microscopic studies,”J. Micros., vol. 248, no. 2, pp. 163–171, 2012.
[9] P. Saketi, A. Treimanis, P. Fardim, P. Ronkanen, and P. Kallio, “Micro-robotic platform for manipulation and flexibility measurement of individ-ual paper fibers,” presented at the IEEE/RSJ Int. Conf. Intelligent Robots and Syst., Taipei, Taiwan, 2010.
[10] G. Guhados, W. Wan, and J. L. Hutter, “Measurement of the elastic mod-ulus of single bacterial cellulose fibers using atomic force microscopy,” Langmuir, vol. 21, no. 14, pp. 6642–6646, 2005.
[11] Y.-C. Hsieh, H. Yano, M. Nogi, and S. J. Eichhorn, “An estimation of the Young’s modulus of bacterial cellulose filaments,”Cellulose, vol. 15, no. 4, pp. 507–513, 2008.
[12] E. D. Cranston, M. Eita, E. Johansson, J. Netrval, M. Salajkov´a, H. Arwin, and L. W˚agberg, “Determination of Young’s modulus for nanofibril-lated cellulose multilayer thin films using buckling,”Biomacromolecules, vol. 12, no. 4, pp. 961–969, 2011.
[13] K. Syverud, G. Chinga-Carrasco, J. Toledo, and P. G. Toledo, “A compar-ative study of Eucalyptus and Pinus radiata pulp fibres as raw materials for production of cellulose nanofibrils,”Carbohydrate Polymers, vol. 84, no. 3, pp. 1033–1038, 2010.
[14] M. Mikczinski, G. Josefsson, G. Chinga-Carrasco, K. Syverud, E. K. Gamstedt, and S. Fatikow, “Introducing and in-situ microrobotic approach for assessing the stiffness properties of microfibrillated cellu-lose films,” presented at the Int. Paper Phys. Conf., Stockholm, Sweden, 2012.
[15] M. Mikczinski, M. Bartenwerfer, P. Saketi, S. Heinemann, R. Passas, P. Kallio, and S. Fatikow, “Towards Automated Manipulation and Charac-terisation of Paper-making Fibres and its Components,” inFine Structure of Papermaking Fibres. Uppsala, Sweden: Swedish Univ. Agricultural Sci., 2011, pp. 163–178.
[16] SmarAct GmbH, “SmarAct Product Catalogue,” vol. 12, Oldenburg: Ger-many, 2013.
[17] F. Beyerle and S. Muntwyler,FT-S270 Force Sensing Probe – Datasheet. Femtotools AG Z¨urich, Switzerland, Nov. 11, 2007.
[18] P-620.2 - P-629.2 PIHera XY Piezo Stage - Datasheet.Physik Instrumente, Karlsruhe, Germany, 2008.
[19] P-620.Z - P-622.Z PIHera Precision Z-Stage - Datasheet.Physik Instru-mente, Karlsruhe, Germany, 2008.
A Nanorobotic System forIn SituStiffness Measurements on Membranes
Jean-Ochin Abrahamians, Bruno Sauvet, J´erˆome Polesel-Maris, R´emy Braive, and St´ephane R´egnier
Abstract—In order to characterize the mechanical behavior of fragile
resonant microelectromechanical systems (MEMS)/nanoelectromechanical systems (NEMS), nondestructive measurements are required. In this paper, a cartography of local stiffness variations on a suspended micromembrane is established for the first time, by a tuning-fork-based dynamic force sensor inside a scanning electron microscope (SEM). Experiments are conducted individually on a batch of InP membranes 200 nm thin, using a 9-degree-of-freedom (dof) nanomanipulation system, complemented with virtual reality and automation tools. Results provide stiffness values in the range of a few newton per meter, with variations in a single sample depending on the membrane models.
Index Terms—Calibration and identification, force and tactile sensing, force control, membrane.
I. INTRODUCTION
As of now, the behavior of micro- and nano-scale mechanical res-onators is not fully understood due to nonlinearities in their dynam-ics [1]. The samples of interest in this paper are suspended micromem-branes (see Fig. 1). Such resonators are critical in the miniaturization of
Manuscript received July 22, 2013; accepted August 28, 2013. Date of publi-cation September 18, 2013; date of current version February 3, 2014. This paper was recommended for publication by Guest Editor S. Martel and Editor B. J. Nelson upon evaluation of the reviewers’ comments. This work was supported by the French Agence Nationale de la Recherche, through the NANOROBUST project, under Contract ANR 2011 NANO 006.
J.-O. Abrahamians is with the Institut des Syst`emes Intelligents et de Robo-tique, Universit´e Pierre et Marie Curie, CNRS UMR 7222, 75005 Paris, France, and also with the CEA, IRAMIS, Service de Physique et Chimie des Surfaces et Interfaces, F-91191 Gif-sur-Yvette, France (e-mail: [email protected]). B. Sauvet and St´ephane R´egnier are with the Institut des Syst`emes Intelligents et de Robotique, Universit´e Pierre et Marie Curie, CNRS UMR 7222, 75005 Paris, France (e-mail: [email protected]; [email protected]).
J. Polesel-Maris is with the CEA, IRAMIS, Service de Physique et Chimie des Surfaces et Interfaces, F-91191 Gif-sur-Yvette, France (e-mail: [email protected]).
R. Braive is with the LPN-CNRS, Laboratoire de Photonique et de Nanostruc-tures, 91460 Marcoussis, France, and also with the Universit´e Denis Diderot, 75205 Paris, France (e-mail: [email protected]).
This paper has supplementary downloadable material available at http://ieeexplore.ieee.org.
Color versions of one or more of the figures in this paper are available online at http://ieeexplore.ieee.org.
Digital Object Identifier 10.1109/TRO.2013.2280831
120 IEEE TRANSACTIONS ON ROBOTICS, VOL. 30, NO. 1, FEBRUARY 2014
Fig. 1. Suspended membrane. Dimensions 10×20µm and thickness 200 nm.
integrated circuits for resonant sensing and communications. Research on the subject primarily relies on modeling and analysis; hence, the ac-tual measurements of their mechanical properties are desired in order to better predict and optimize their resonant behavior. Performing these measurements is not trivial as typical methods either involve indenting samples or applying enough force to deflect MEMS sensors. These inherently destructive methods can make the measurement itself unre-liable [2]. Furthermore, they do not truly allow the mapping of several points on a single sample, as the mechanical properties of the sample are potentially modified after each measurement. More delicate force measurements in the pico-Newton range have been achieved, by com-plementing the tip of classical probes and observing the deflection of carbon nanotubes, rather than the cantilever, under a scanning electron microscope (SEM) [3]. In this study, we propose a self-sensing probe, using an SEM only to identify samples and position the nanorobotic system. The probe being self-sensing readily allows the automation of the whole nanorobotic measurement process. This automation is not only the end goal of the measurement process but brings the duration of experiments down to achievable levels for research purposes as well. Indeed, manipulation has to be conducted by nanometric steps lest the samples be damaged (see Fig. 2), which is excessively time-consuming if entirely handled by unassisted human operators. Virtual reality is an-other useful tool that makes planning trajectories and performing safe manipulation easier and faster. This study uses both of these tools with a 9-degree-of-freedom (dof) nanorobotic system to demonstrate a proof of concept for stiffness cartography measurements on fragile microstructures. Herein, the stiffness of suspended InP membranes is locally measured by contact at several points of their surface, using a self-sensing quartz tuning fork probe controlled in frequency modula-tion. Experiments are conductedin situthrough the robotic nanoma-nipulation system implemented in an SEM. Section II summarizes the state of the art in microrobotics, virtual reality, and the measurement of mechanical properties relevant to this study. Section III details the equipment and manipulation setup. Section IV describes the stiffness measurement method and the experimental results thereby obtained.
II. STATE OF THEART
A. MicroRobotic Manipulation and Virtual Reality System
Nowadays, micromanipulation experiments are often performed un-der SEMs rather than optical microscopes, due to the increased room
Fig. 2. (Top) Destroyed hinge (left) or destroyed suspension pads (right) due to electrostatically induced collisions between the tip of the probe and a sample. (Bottom) Consequences of careless manipulation of the local probe.
for manipulation, depth of field, and field of view they offer. They have thus been used in the electrical or mechanical characterization of nanoobjects [4], as well as the mechanical characterization of biological samples like cells [5]. The use of a SEM implies the implementation of the experiment in a vacuum chamber, which requires compatible materials and heat dissipation, as well as its operation under an elec-tron beam, for which tools and samples must be conductive to prevent charging. Current-generation SEMs may allow more leeway regarding these requirements. However, a high-quality vacuum is also beneficial to the sensitivity of resonating sensors such as the probe used in this study (see Section IV). As for micromanipulation setups, commercially available actuators offer sufficient nanoscale resolutions to operate on fragile samples. Delicate micromanipulation also greatly benefits from being complemented by haptics and virtual reality [6]. Such techniques have, for instance, been employed inside an SEM for the micromanip-ulation of organs and cells [7]. Virtual reality has been widely used in atomic force microscopy (AFM) both for the rendering of images and topographic sensing [8], as well as algorithmically enhancing sensed data. [9] However, virtual reality in this study is used in a very dif-ferent manner: not to render or enhance data obtained by the sensors, but to create a real-time virtual replica of the manipulation system, which is then used to swiftly and safely approach samples with the probe.
B. Membrane Force Sensing
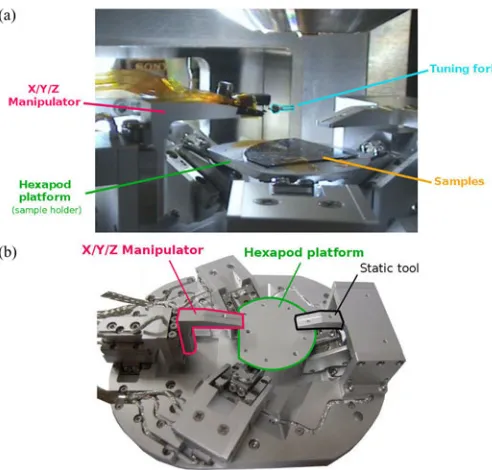
Fig. 3. (a) Full manipulation setup inside the SEM vacuum chamber. (b) Robotic manipulation platform (SmarAct GmbH); dimensions 11×13× 4 cm.
obtained for reference. The approach that has been proposed here is a microscale vibrational method which does not involve any strain or large deflection, using a tuning fork-based self-sensing probe. Tuning forks have notably been used in AFM in the qPlus configuration [13], in which a tip is attached to one prong, and the other is fixed. The high sensitivity and stiffness of these sensors have been exploited in developing noncontact imaging, and they have been admirably used for subatomic resolution AFM [14]. The self-sensing AFM technique can be applied to resonators of various geometries and eigenfrequencies for increased imaging speed or dexterity in manipulation [15]. There are practical advantages to using these self-sensing probes instead of the classical microfabricated cantilevers, not the least of which is the relative simplicity of implementation under an SEM electron beam. Furthermore, the data from these sensors can be directly used for au-tomation. The sensor used in this study does not have a fixed prong and benefits from the high sensitivity and ˚Angstrom-scale oscillation amplitude of the tuning fork for nondestructive operations.
III. MANIPULATIONSETUP
A. Nanorobotic Manipulation System
The nanorobotic manipulation system (see Fig. 3) is implemented in an SEM (Hitachi S-4500). It consists of a 3-DoF Cartesian manipula-tor and a 6-DoF “hexapod” sample holder platform (SmarAct GmbH, custom-built). Both are composed of closed-loop axial stick-slip ac-tuators. The hexapod’s mobility is used to obtain the desired angle between the tool and the sample through its three rotational DoF. The actuators offer an ascertained resolution better than 2 nm over a travel range of 12 mm and are used both for coarse and fine positioning. Their closed-loop resolution is determined by the performance of their optical sensors [16]. The SEM view and depth of field are used to cali-brate the initial positioning of the tool relative to the samples, identify the membrane amongst a batch to operate onin situ, and observe its behavior during experiments. The whole platform can be tilted at an angle up to 45◦to discern and accurately control the point where the tip
Fig. 4. (a) Blender virtual reality system interface. (b) Virtual reality control scheme. Trajectory planning uses a “ghost” of the model, whereas the actual position output from the manipulator system sensors is always displayed by the model itself. Travel speed is modulated by discrete position control.
of the probe touches the sample. The virtual reality interface is a 3-D replica of the manipulation unit that is rendered in the physics engine of the software blender (see Fig. 4). It relies on data from the actuators’ position sensors to calibrate itself and then follows the current state of the system, which can thus be observed even while it is operating inside the vacuum chamber. It was mainly designed as a user-orientated terminal, which allows the planning of position sequences by previsual-izing them on a “ghost” model (see video as Supplementary Material). It faithfully reproduces the kinematic DoFs of the system and is an in-terface from which one can directly drive the system while preventing collisions between elements.
B. Probe Fabrication and Integration
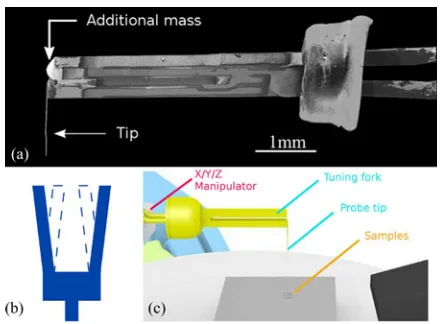
The probe used in this paper was fabricated using a CF308 quartz tuning fork (Citizen America) removed from its canister, with a free resonance frequency of 32.768 kHz. The probe is composed of the tuning fork, with a tungsten probe tip of 1–2 mm length with a tip radius<100 nm (T-4-5 Picoprobe, GGB Industries) manually glued on the side of one prong using conductive silver epoxy (EPO-TEK H21D, Epoxy Technology). The resulting unbalance reduces the quality factor of the tuning fork; therefore, the weight is then compensated by adding a small deposit of epoxy on the other prong [see Fig. 5(a)]. The tip is connected to ground through the electrode of the prong to which it is attached to prevent its electrostatic charging under the electron beam. Its use as a local stiffness sensor is explained in Section IV. The tuning fork is then fixed on the manipulator. [see Fig. 5(c)] The probe is connected to a custom electronic preamplifier adapted for use under the electron beam of the microscope [17] and an oscillation control system (Nanonis OC4-Station, SPECS GmbH), as previously described in [18]. Data from the controller is then used by a computer for automation.
IV. STIFFNESSMEASUREMENTS
A. Principle of Tuning Fork Stiffness Measurement
122 IEEE TRANSACTIONS ON ROBOTICS, VOL. 30, NO. 1, FEBRUARY 2014
Fig. 5. (a) 35◦inclined top view of the tuning fork probe by SEM. During a measurement, the apex of the tip is brought into contact with the samples. (b) Antiphase coupled oscillation of a tuning fork. (c) Probe positioned above samples.
Fig. 6. Spring-mass mechanical models of (a) a free tuning fork [19] and (b) a tuning fork with a probe tip in contact with a sample. Both prongs have the same mass m and stiffness k;kcmodels the coupling between the prongs; the tip and the counterweight have the same massmP ro b e.
Fig. 5(b)]. Dynamic force sensing with a tuning fork can be done in amplitude/phase modulation (AM/PM) or frequency modulation (FM) modes. Here, the tuning fork is used in FM mode to benefit from its high-quality factor. [18] The quality factor Q is related to the tuning fork’s sensitivity, and is considerably higher in a vacuum, as there is no energy loss from friction with air molecules. In a 10−4Pa vacuum, the manufactured sensors have Q ranging from 20 to 60 k (versus 5 to 10 k in the air). The sensor used in this paper has a Q of 30 k, including the tip.
In FM mode, an electrical excitator applies a voltage to the tuning fork to drive it at its resonance frequencyf0and feeds back the resulting current in a preamplifier for regulation by the phase-locked loop (PLL) and an automatic gain control (AGC), analyzing its frequency shift while keeping constant both phase and amplitude. The frequency shifts when the tuning fork tip is interacting with a sample. The relation between frequency shift∆fand sample stiffnessks a m p leis obtained using the coupled oscillators model presented in [19] (see Fig. 6), which, unlike single-cantilever models, takes into account oscillation dynamics as affected by the coupling of the two prongs of the tuning fork—with each prong a harmonic oscillator modeled as a clamped beam. With∆krepresenting the effective stiffness of the combined tip and sample
∆k= 1 1
kt i p +
1 ks a m p l e
. (1)
It is assumed that the tip is much stiffer than the sample, and there-fore,ks a m p le≈∆k. The resolution of this model givesks a m p le
pro-Fig. 7. Frequency shift during a slow measurement operation. The electrostatic and van der Waals interaction forces are observed before reaching the sample: frequency shifts by a few mHz between 150 and 50 nm above the sample (electrostatic pull-in) and by a few dozen mHz below 50 nm (van der Waals pull-in). After taking a measurement, if the probe is withdrawn slowly, a pull-off resistance that result from adhesion forces can be observed.
portional to∆ffactored by the sensor’s sensitivity
ks a m p le=
2kp ro b e
f0
∆f (2)
withkp ro b e the effective elastic constant of the whole tuning fork probe, including the added probe tip and its counterweight. There are several ways to measurekp ro b e. [20] The value used in this paper is 10.7×10³N/m [21] and relies on a geometrical method, which sums up the stiffness of both prongs based on their dimensions and materials, and evaluates the coupling elastic constant at 20–35% of the total. [19]
B. Manipulation Protocol
Fig. 8. InP membranes can be stretched or compressed by 20 nm through their fabrication. Compressed membranes can bend in either direction, the exact resulting shape depending on the geometry and position of the hinges.
the “non-contact zone” very close to the sample, but lowering the probe by one nanometer then leads to true contact and a stable value. The true measurement point that does not affect the sample is therefore the only stable value which can be obtained. These two parts of the measurement process are thus automated through controller data: getting the probe tip in contact with the chosen sample and recording a stable measurement value, after which the probe withdraws automatically. The choice of sample is done using SEM vision, and the majority of the distance that separates the tip from the sample is first cleared instantly thanks to the reference provided by the virtual reality system. The rest of the procedure is automated. A manual measurement which could take us up to 2 h can therefore be conducted automatically within a few minutes.
C. Experiments and Results
Cartography experiments were conducted on dozens of suspended InP membranes 200 nm thin (see Fig. 1). Their fabrication was first de-scribed in [22]. The InP membranes are grown by epitaxy and structured by wet etching. Their shape is rectangular with dimensions 10×20µm, and they are patterned with air holes of diameter less than 200 nm. Each membrane is suspended between two supporting pads and held by four hinges. These hinges are the most fragile components of the structure and are most likely to sever if excessive strain is applied anywhere on the membrane. The samples typically cannot handle being deflected by more than a few nanometers. In comparison, the oscillation amplitude of the tuning fork is nondestructive, as it is estimated under 700 pm using the amplitude calibration procedure described in [23].
While the InP membranes are themselves semiconductive, the sam-ples were fabricated on a nonconductive SiO2 substrate. Thesein situ
conditions account for the strong electrostatic charging effects encoun-tered during lengthy experiments, which sometimes resulted either in the disruption of the frequency shift measurement when the probe touches a charged sample or in destructive electrostatic clamping. The depth performances of electronic microscopy were invaluable in set-ting up and observing the probe and membranes despite these issues, which were mitigated by shortening the duration of experiments to obtain more measurement points. Faster characterization procedures hence motivated the development of automated control tools.
The stiffness values that are obtained by the local measurements are in the range of a few newton per meter. Repeated measurements on the same point were found to fall within 5% standard deviation of the
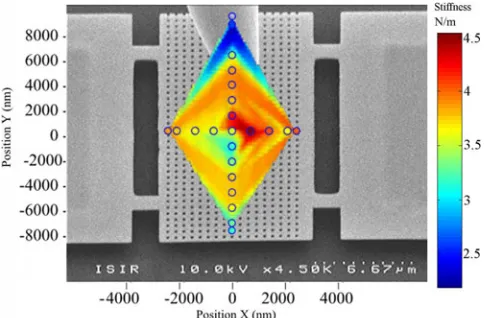
Fig. 9. Local stiffness variations on two stretched flat membranes of the same type. Blue circles mark the points where measurements were taken. The spread colouration is a linear extrapolation for display purposes only.
Fig. 10. Local stiffness variations on a convex membrane. Display conventions are similar to Fig. 9.
hit value on a sample size of a dozen. This repeatability demonstrates that the measurement method itself is nondestructive. Results vary according to the membrane models and whether they are compressed or stretched through their fabrication. Hence, we selected three membrane situations that depend on their curvature:
1) Flat Membranes: Experiments conducted on membranes
stretched by 20 nm provide values with a variation ranging between 5 and 6 N/m across the samples. Fig. 9 lays out the distribution of measurements taken on two similar stretched membrane models. The highest values are obtained near the hinges, which is in agreement with the assumption that the hinges and anchored regions of the sample must be stiffer than the body of the membrane itself. Stiffness gradu-ally decreases when approaching the center or edges of the membrane. Measurements taken on more membranes confirm this tendency.
2) Convex Membranes: In this case, measurements on membranes
compressed by 20 nm provide a slightly wider range of values, as seen in Fig. 10. Unlike the other models, stiffness increases toward the center of the membrane.
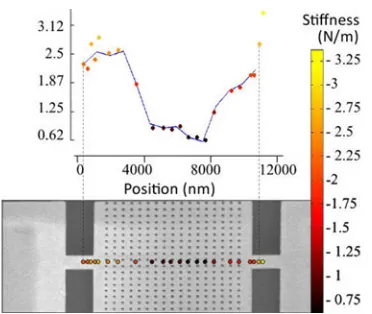
3) Concave Membranes: Measurements between two hinges show
124 IEEE TRANSACTIONS ON ROBOTICS, VOL. 30, NO. 1, FEBRUARY 2014
Fig. 11. Stiffness measurements ranging between two suspensions of a con-cave membrane, taken from left to right. The sample is left undamaged.
on the geometrical models. Fig. 11 shows local stiffness measurements between two hinges of a concave membrane ranging from 0.6 to 3 N/m. The values obtained for these different models indicate consistent stiffness trends. Stretched membranes are stiffer, as could be expected intuitively and through basic models, and exhibit considerably less standard deviation than compressed models. Convex membranes are, interestingly, more stiff at their center—although they are overall no-tably less stiff. Concave membranes have the lowest stiffness values and tend to be less stiff still near their center. All models are stiffer near the hinge nodes, as expected.
V. CONCLUSION
A nondestructive local stiffness measurement method has been im-plemented based on tuning fork AFM. A 9-DoF platform has been used for nanomanipulation, assisted by virtual reality and automation tools for practicality. Measurements were takenin situon membranes amidst a manufactured batch, with over 20 measurement points taken on a sin-gle membrane without altering it. The chosen local-probe approach to measuring the stiffness of MEMS/NEMS mechanical resonator mem-branes has been validated. Such measurements will contribute to the design and optimization of micromembrane resonators, as well as to the understanding of their mechanical behavior.
Future works will include dynamically monitoring the mechanical behavior of membranes resonating under external excitation, as well as applying this sensing technique on newer designs of the membranes. These upcoming samples will present even more fragile structures, as they will be suspended by longer hinges to dramatically elevate their quality factor. Further applications of this sensing method can be derived on samples with fragile surfaces such as graphene films. In those contexts, stable positioning resolutions in the subnanometer range will be required to fully exploit the small oscillation amplitudes of the probes.
REFERENCES
[1] J. F. Rhoads, S. W. Shaw, and K. L. Turner, “Nonlinear dynamics and its applications in micro- and nano-resonators,”J. Dyn. Syst., Meas., Control, vol. 132, no. 3, pp. 34001-1–34001-14, 2010.
[2] L. Qiao and X. Zheng, “Effect of surface stress on the stiffness of micro/nanocantilevers: Nanowire elastic modulus measured by nano-scale tensile and vibrational techniques,”J. Appl. Phys., vol. 113, no. 1, pp. 013 508–013 508–9, Jan. 2013.
[3] F. Arai, M. Nakajima, L. Dong, and T. Fukuda, “Pico-Newton order force measurement using a calibrated carbon nanotube probe by
electromechan-ical resonance,” inProc. IEEE Int. Conf. Robot. Autom., 2003, pp. 300– 305.
[4] X. Ye, Y. Zhang, and Y. Sun, “Robotic pick-place of nanowires for elec-tromechanical characterization,” inProc. IEEE Int. Conf. Robot. Autom., May 2012, pp. 2755–2760.
[5] Y. Shen, M. Nakajima, M. Homma, and T. Fukuda, “Auto nanomanipula-tion system for single cell mechanical property characterizananomanipula-tion inside an environmental SEM,” inProc. IEEE/RSJ Int. Conf. Intell. Robots Syst., Oct. 2012, pp. 646–651.
[6] A. Bolopion, H. Xie, D. Haliyo, and S. R´egnier, “Haptic teleoperation for 3-D microassembly of spherical objects,”IEEE/ASME Trans. Mechatron-ics, vol. 17, no. 1, pp. 116–127, Feb. 2012.
[7] M. Takahashi, H. Ko, T. Ushiki, and F. Iwata, “Interactive nano manip-ulator based on an atomic force microscope for scanning electron mi-croscopy,” inProc. Int. Symp. Micro-NanoMechatron. Human Sci., Nov. 2011, pp. 495–500.
[8] L. Fok, Y. Liu, and W. Li, “Modeling of haptic sensing of nanolithography with an atomic force microscope,” inProc. IEEE Int. Conf. Robot. Autom., 2005, pp. 2446–2451.
[9] M. H. Korayem and S. Esmaeilzadehha, “Virtual reality interface for nano-manipulation based on enhanced images,”Int. J. Adv. Manuf. Technol., vol. 63, nos. 9–12, pp. 1153–1166, Dec. 2012.
[10] Y.-C. Cheng, M.-T. Lin, P. C. Chen, and C.-J. Tong, “Static and dynamic mechanical properties measurement of micro-nano metal thin film using cantilever beam deflection,” inProc. Symp. Design Test Integrat. Packag., May 2010, pp. 203–208.
[11] Y. Shen, M. Nakajima, Z. Yang, M. Homma, and T. Fukuda, “Nano needle with buffering beam for single cell stiffness measurement by nanorobotic manipulators inside ESEM,” inProc. IEEE Conf. Nanotechnol., Aug. 2012, pp. 1–4.
[12] P.-H. Chen, C.-H. Yang, C.-Y. Tsai, T.-L. Chang, W.-C. Hsu, and T.-C. Chen, “Young’s modulus of high aspect ratio Si3N4 nano-thickness membrane,” inProc. IEEE Conf. Nanotechnol., Aug. 2007, pp. 1341– 1344.
[13] F. J. Giessibl, “High-speed force sensor for force microscopy and pro-filometry utilizing a quartz tuning fork,”Appl. Phys. Lett., vol. 73, no. 26, pp. 3956–3958, Dec. 1998.
[14] F. J. Giessibl, S. Hembacher, H. Bielefeldt, and J. Mannhart, “Subatomic features on the silicon (111)-(77) surface observed by atomic force mi-croscopy,”Science, vol. 289, no. 5478, pp. 422–425, Jul. 2000. [15] J. C. Acosta, J. Polesel-Maris, F. Thoyer, H. Xie, S. Haliyo, and S. R´egnier,
“Gentle and fast atomic force microscopy with a piezoelectric scan-ning probe for nanorobotics applications,”Nanotechnol., vol. 24, no. 6, pp. 065502-1–065502-11, Feb. 2013.
[16] Y. L. Zhang, Y. Zhang, C. Ru, B. Chen, and Y. Sun, “A load-lock-compatible nanomanipulation system for scanning electron microscope,” IEEE/ASME Trans. Mechatronics, vol. 18, no. 1, pp. 230–237, Feb. 2013.
[17] J. Polesel-Maris, “Electronic control and amplification device for a local piezoelectric force measurement probe under a particle beam,” WO Patent 2011/092 225 A1, Aug. 2011.
[18] J. C. Acosta, G. Hwang, J. Polesel-Maris, and S. R´egnier, “A tuning fork based wide range mechanical characterization tool with nanorobotic manipulators inside a scanning electron microscope,”Rev. Sci. Instrum., vol. 82, no. 3, pp. 035 116–035 116–8, Mar. 2011.
[19] A. Castellanos-Gomez, N. Agrait, and G. Rubio-Bollinger, “Dynamics of quartz tuning fork force sensors used in scanning probe microscopy,” Nanotechnol., vol. 20, pp. 215502-1–215502-16, Mar. 2010.
[20] H. Xie, J. Vitard, S. Haliyo, S. R´egnier, and M. Boukallel, “Calibration of lateral force measurements in atomic force microscopy with a piezoresis-tive force sensor,”Rev. Sci. Instrum., vol. 79, no. 3, pp. 033 708–033 708–6, Mar. 2008.
[21] B. Sauvet, “Design of a microrobotic platform for the manipulation and characterization of thin films” Ph.D. dissertation, Univ. Pierre et Marie Curie, Paris, France, Mar. 2013.
[22] M. Strassner, J.-L. Leclercq, and I. Sagnes, “Fabrication of ultra-thin InP membranes and their application for high reflective mirrors in tunable vertical-cavity devices,” inProc. Int. Conf. Indium Phosphide Related Mater., Jun. 2004, pp. 221–223.