Degree of Compaction and its effects on Cost and Life of Roads in Brunei Darussalam
by
Dr. S. A. Sultan 1 and Mr.Wee Hong Joo 2
ABSTRACT
The performance of a pavement system involves the interaction of many variables such as material properties, environment, traffic loading, construction practices, maintenance activities, and management constraints. The pavement design process has as its objective, the design and management of a pavement throughout its life time in order to minimize the total cost. This approach, can be used to select an optimum pavement strategy considering the interaction of these many variables.
A comprehensive analysis was carried out using local values of the above mentioned variables in Brunei Darussalam to study the effect of degree of compaction of pavement layers on the optimum pavement management strategy. This analysis was implemented using mechanistic-empirical design approach. Different relationships were developed to find the effect of the degree of compaction on the total cost of the pavement, maintenance cost, the time to the first overlay, and the total life of the road. These effects will be presented into mathematical relationships or models to help the road engineers and contractors in understanding and assessing the required degree of compaction for their pavement layers.
2. INTRODUCTION
2.1 Background
Pavement design is normally a inquisitive process in which the designer assumes a certain combination of thickness of layered materials and subsequently checks the layered systems for adequacy from the points of view of traffic and environmental deterioration, construction and rehabilitation costs, as well as the future seal costs, overlays and routine maintenance (AASHTO, 1986).
In the course of this analysis, a designer may see areas in which he could improve the over-all cost by making modifications in his trial designs.
_____________________________________________________________________________
1
Consultant, Associated Consultant Pte. Ltd., P.O. Box 697, Bandar Seri Begawan BS8671, Brunei Darussalam, e-mail: [email protected]
2
With the variety of materials and thickness available to highway designer, A computer program is normally required to consider between one and two thousands different trial designs. The material properties, the traffic, and environmental factors are combined to predict a time at which the serviceability index of the pavement would drop below an acceptable level (Huang, 1993).
The development of an operational pavement systems model using a computer program called SAMP, System Analysis and Management of Pavement simplified the process, (Lytton et. al., 1975). The SAMP computer program was developed from Flexible Pavement System (FPS) - 4, one of the FPS - series computer programs written for implementation within the Texas Highway Department.
Two structural subsystems, the AASHO Interim Guide flexible pavement equation and the deflection equation, were represented in the FPS series.
The SAMP computer program adopts the view that routine maintenance and future rehabilitation (overlay) are part of the total pavement management process (Sultan and Joo, 2000). Future costs are discounted to the present and the total cost per square meter is used, as the criterion for determining which pavement design is the optimum. Included in the total cost is the users cost, a term for the expense to the traveling public of being delayed while detouring on overlay activity. These costs are weighted equally with actual construction dollars.
The purpose of the Pavement Management System PMS analysis is to design from available input data, a pavement that can be maintained above specified minimum serviceability over the specified design period at a minimum over-all cost. The PMS provides the decision-maker with a set of feasible pavement designs arranged in some priority order- in the present case, that of increasing total cost. The information provided for each alternate design includes (1) initial construction configuration, (2) overlay schedule and (3) cost breakdown. The cost breakdown includes initial construction, overlays, routine maintenance, salvage value, and user’s costs during overlay construction. All costs are discounted to present value using the interest rate selected by the program user. The system was implemented taking into consideration the local construction practices and the magnitude of the input variables in Brunei Darussalam to study the effect of compaction degree of pavement layers. The following procedure was followed (Sultan, 1999a; Sultan 1999b; Sultan, 1999c;Tong, 1997).
2.1.1 The Input Data.
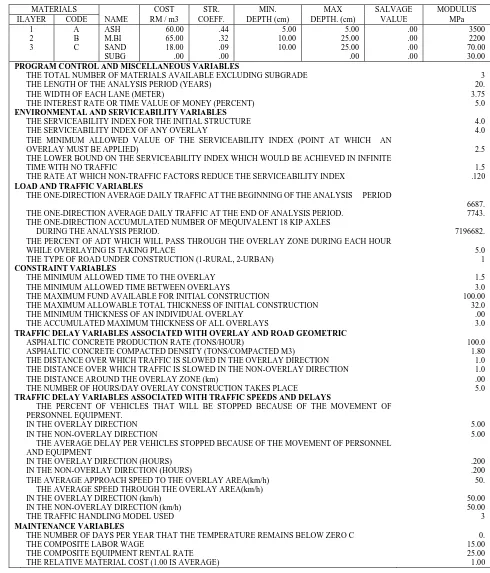
A - Cost of Materials
For the purpose of this analysis, the local market prices were taken for comparison purposes only as shown in Table 1 (Hj Abd Rahman and Sultan, 2000).
B - Material Characterization
In this analysis, four different types of pavement materials were used to design pavement layers as shown in Table 2. Each one of the materials used has its own layer coefficient and other strength properties according to AASHTO design method (AASHTO, 1986).
Table 1: Input Variables for SAMP Analysis.
PROGRAM CONTROL AND MISCELLANEOUS VARIABLES
THE TOTAL NUMBER OF MATERIALS AVAILABLE EXCLUDING SUBGRADE 3
THE LENGTH OF THE ANALYSIS PERIOD (YEARS) 20.
THE WIDTH OF EACH LANE (METER) 3.75
THE INTEREST RATE OR TIME VALUE OF MONEY (PERCENT) 5.0
ENVIRONMENTAL AND SERVICEABILITY VARIABLES
THE SERVICEABILITY INDEX FOR THE INITIAL STRUCTURE 4.0
THE SERVICEABILITY INDEX OF ANY OVERLAY 4.0
THE MINIMUM ALLOWED VALUE OF THE SERVICEABILITY INDEX (POINT AT WHICH AN
OVERLAY MUST BE APPLIED) 2.5
THE LOWER BOUND ON THE SERVICEABILITY INDEX WHICH WOULD BE ACHIEVED IN INFINITE
TIME WITH NO TRAFFIC 1.5
THE RATE AT WHICH NON-TRAFFIC FACTORS REDUCE THE SERVICEABILITY INDEX .120 LOAD AND TRAFFIC VARIABLES
THE ONE-DIRECTION AVERAGE DAILY TRAFFIC AT THE BEGINNING OF THE ANALYSIS PERIOD
6687. THE ONE-DIRECTION AVERAGE DAILY TRAFFIC AT THE END OF ANALYSIS PERIOD. 7743. THE ONE-DIRECTION ACCUMULATED NUMBER OF MEQUIVALENT 18 KIP AXLES
DURING THE ANALYSIS PERIOD. 7196682.
THE PERCENT OF ADT WHICH WILL PASS THROUGH THE OVERLAY ZONE DURING EACH HOUR
WHILE OVERLAYING IS TAKING PLACE 5.0
THE TYPE OF ROAD UNDER CONSTRUCTION (1-RURAL, 2-URBAN) 1
CONSTRAINT VARIABLES
THE MINIMUM ALLOWED TIME TO THE OVERLAY 1.5
THE MINIMUM ALLOWED TIME BETWEEN OVERLAYS 3.0
THE MAXIMUM FUND AVAILABLE FOR INITIAL CONSTRUCTION 100.00
THE MAXIMUM ALLOWABLE TOTAL THICKNESS OF INITIAL CONSTRUCTION 32.0
THE MINIMUM THICKNESS OF AN INDIVIDUAL OVERLAY .00
THE ACCUMULATED MAXIMUM THICKNESS OF ALL OVERLAYS 3.0
TRAFFIC DELAY VARIABLES ASSOCIATED WITH OVERLAY AND ROAD GEOMETRIC
ASPHALTIC CONCRETE PRODUCTION RATE (TONS/HOUR) 100.0
ASPHALTIC CONCRETE COMPACTED DENSITY (TONS/COMPACTED M3) 1.80
THE DISTANCE OVER WHICH TRAFFIC IS SLOWED IN THE OVERLAY DIRECTION 1.0 THE DISTANCE OVER WHICH TRAFFIC IS SLOWED IN THE NON-OVERLAY DIRECTION 1.0
THE DISTANCE AROUND THE OVERLAY ZONE (km) .00
THE NUMBER OF HOURS/DAY OVERLAY CONSTRUCTION TAKES PLACE 5.0
TRAFFIC DELAY VARIABLES ASSOCIATED WITH TRAFFIC SPEEDS AND DELAYS
THE PERCENT OF VEHICLES THAT WILL BE STOPPED BECAUSE OF THE MOVEMENT OF PERSONNEL EQUIPMENT.
IN THE OVERLAY DIRECTION 5.00
IN THE NON-OVERLAY DIRECTION 5.00
THE AVERAGE DELAY PER VEHICLES STOPPED BECAUSE OF THE MOVEMENT OF PERSONNEL AND EQUIPMENT
IN THE OVERLAY DIRECTION (HOURS) .200
IN THE NON-OVERLAY DIRECTION (HOURS) .200
THE AVERAGE APPROACH SPEED TO THE OVERLAY AREA(km/h) 50.
THE AVERAGE SPEED THROUGH THE OVERLAY AREA(km/h)
IN THE OVERLAY DIRECTION (km/h) 50.00
IN THE NON-OVERLAY DIRECTION (km/h) 50.00
THE TRAFFIC HANDLING MODEL USED 3
MAINTENANCE VARIABLES
THE NUMBER OF DAYS PER YEAR THAT THE TEMPERATURE REMAINS BELOW ZERO C 0.
THE COMPOSITE LABOR WAGE 15.00
THE COMPOSITE EQUIPMENT RENTAL RATE 25.00
Table 2: Different Combinations of Pavement Layers used for Analysis.
A1 MATERIAL
In this analysis, an average design period of 15 years was used for comparison purposes, as the life of the road pavement.
D - Traffic Volumes
A typical traffic volume data was taken from an average arterial road for the purpose of analysis as shown in Table 1.This data was converted into 18-kip ESAL (Equivalent Single Axle Load) as required by AASHTO design method.
E - Others
The salvage value of pavement materials was taken as zero according to the local practice (based on local market prices). The other values were taken as averages or as considered by local road industry practice, as shown in Table 1.
F - Summary
For the purpose of this analysis, different degrees of compaction were taken for each of asphalt, base, subbase and subgrade layers to evaluate the effects of degree of compaction using a developed version of SAMP computer program, (Sultan and Lou, 2000).
3. ANALYSIS OF RESULTS.
y=132.556-2.829*x
Fig.1: Relationship between Degree of compaction (Dc) of subgrade soil Tc ($B/m2)
Dc (%)
88 90 92 94 96 98 100 102
11.0 11.5 12.0 12.5 13.0 13.5 14.0 14.5 15.0 15.5
and the Total cost (Tc) of the pavement in $B/m2.
Fig.2 is prepared to show the effect of the degree of compaction of the subgrade soil layer on the resilient modulus and the maximum dry density. It is well known that reducing the degree of compaction of the subgrade soil layer reduces the resilient modulus and the dry density of soil, (AASHTO, 1986), but the relationship which defines the rate of this reduction for a certain environment is not known, (Huang, 1993). The literature review that have been carried out by Tong (1997) laid open that this type of relationship is not available.
Fig.3 shows the effect of the degree of compaction on the total cost of the pavement and the dry density of the subgrade soil.
Fig.4 is prepared to show the effect of the degree of compaction of the subbase layer on the total cost of the pavement. The degree of compaction of the subbase layer has less effect on the total cost of the pavement in comparison with the rest of layers. This can be attributed to the main function of the subbase layer as a non major load carrying layer and it serves mainly as drainage layer.
Fig.5 is prepared to show the effect of the degree of compaction of the base layer on the total cost of the pavement.
Fig.6 is prepared to show the effect of the degree of compaction of the asphalt layer on the total pavement cost. The most important effect on the cost of the pavement by the degree of compaction can be recognized in Fig.6.
90.500 91.581 92.662 93.743 94.824 95.905 96.986 98.067 99.148 100.229 above z=65.17+0.012*x+0.321*y
Modulus (RM), and Degree of Compaction (Dc) of subgrade soil. Fig.2: Relationship for Maximum Dry Density (MDD), Resilient
90.500 91.581 92.662 93.743 94.824 95.905 96.986 98.067 99.148 100.229 above z=96.402+0.015*x+-2.039*y
and Degree of Compaction (Dc) of subgrade soil.
Fig.4: Relationship between Degree of Compaction (Dc) of subbase layer Tc ($B/m2)
Dc (%)
88 90 92 94 96 98 100 102
10.9 11.1 11.3 11.5 11.7 11.9
and the Total cost (Tc) of the pavement.
Fig.5: Relationship between Degree of Compaction (Dc) of base layer Tc ($B/m2)
Dc (%)
88 90 92 94 96 98 100 102
11.0 11.4 11.8 12.2 12.6 13.0
Fig.6: Relationship between Degree of Compaction (Dc) of asphalt layer Tc ($B/m2)
Dc (%)
94.5 95.5 96.5 97.5 98.5 99.5 100.5
11.0 11.6 12.2 12.8 13.4 14.0
and the Total cost (Tc) of pavement.
Fig.7: Relationship between Degree of Compaction (Dc) of asphalt layer To (years)
Dc (%)
95.5 96.0 96.5 97.0 97.5 98.0 98.5 99.0 99.5 100.0
1.6 2.0 2.4 2.8 3.2 3.6 4.0
4. CONCLUSIONS
The importance of the degree of compaction of the pavement layers during construction is not only as a quality controlling measure, but it is also a factor that controls the total cost of the road pavement and its design life. New relationships were developed to define the effect of the degree of compaction on the total pavement cost, life and performance in Brunei Darussalam with high correlation factors for confidence level of 95%. These relationships will help road engineers and contractors to understand and evaluate the negative effects of the reduction of degree of compaction on the total cost and life of road pavement.
References
AASHTO, (1986), AASHTO, “Guide for Design of Pavement Structures”, Washington, D.C., USA.
Hj Abd Rahman, Hj. R., and Sultan, S.A., (2000), “ New Techniques for Design and Quality Control of Pavement Stabilization in Brunei Darussalam.”, Proc. the 10th REAAA Conf., Tokyo, Japan.
Huang, Y. H., (1993), “ Pavement Analysis and Design”, Prentice Hall, Inc., New Jersey, USA, pp.805.
Lytton, R.L., et. al., (1975), “Flexible Pavement Design and Management Systems Approach Implementation”, NCHRP Report 160.
Sultan, S.A., and Lou, C., T., (2000), “ New Approach for Pavement Management System in Borneo Island”, Proc. the 10th REAAA Conf., Tokyo, Japan.
Sultan, S.A., and Joo, W. H., (2000),“ Minimum Maintenance Approach for the Design of Flexible Pavement in The Tropics”, Proc. the 10th REAAA Conf., Tokyo, Japan.
Sultan, S.A., (1999a), “One Day Seminar on Flexible Road Pavement”, The Institution of Engineers, Malaysia, (IEM), Sarawak branch, Kuching, Malaysia.
Sultan, S.A, (1999b), “Two Day Seminar on Road Construction over Peat and New Techniques for Design and Quality Control of Stabilized Pavement”, The Institution of Engineers, Malaysia, (IEM), Sarawak Branch, Kuching, Malaysia.
Sultan, S.A., (1999c), “One Day Seminar on Design and Quality Control of Stabilized Pavements”, The Institution of Engineers Malaysia, (IEM), Sabah branch, Sabah, Malaysia.
Sultan, S.A.,(1999d), “One Day Seminar on Road Maintenance in The Tropics”, Kuching, The Association of Consulting Engineers, Malaysia, (ACEM), Sarawak, Malaysia.