PEAT-CO2
Assessment of CO
2emissions from
drained peatlands in SE Asia
Kajian emisi CO
2dari
lahan gambut yang dikeringkan di Asia Tenggara
1
stedition
December 7, 2006
Authors: Aljosja Hooijer, Marcel Silvius, Henk Wösten, Susan Page
Contact: [email protected]
[email protected]
Translator: Irwansyah Reza Lubis
Indonesian Editor: Yus Rusila Noor
To be cited as:
Summary
Forested tropical peatlands in SE Asia store
at least 42,000 Megatonnes of soil carbon.
This carbon is increasingly released to the
atmosphere due to drainage and fires
associated with plantation development and
logging. Peatlands make up 12% of the SE
Asian land area but account for 25% of
current deforestation. Out of 27 million
hectares of peatland, 12 million hectares
(45%) are currently deforested and mostly
drained. One important crop in drained
peatlands is palm oil, which is increasingly
used as a biofuel in Europe.
In the PEAT-CO2 project, present and
future emissions from drained peatlands were
quantified using the latest data on peat extent
and depth, present and projected land use
and water management practice,
decomposition rates and fire emissions. It
was found that current likely CO
2emissions
caused by decomposition of drained
peatlands amounts to 632 Mt/y (between
355 and 874 Mt/y). This emission will
increase in coming decades unless land
management practices and peatland
development plans are changed, and will
continue well beyond the 21
stcentury. In
addition, over 1997-2006 an estimated
average of 1400 Mt/y in CO2 emissions was
caused by peatland fires that are also
associated with drainage and degradation.
The current total peatland CO
2
emission of
2000 Mt/y equals almost 8% of global
emissions from fossil fuel burning. These
emissions have been rapidly increasing since
1985 and will further increase unless action is
Ringkasan
Lahan gambut tropis berhutan di Asia Tenggara menyimpan setidaknya 42.000 Mton karbon tanah. Tingkat pelepasan karbon ini ke atmostfir terus meningkat akibat kebakaran dan
pengeringan yang terkait dengan kegiatan
perkebunan dan penebangan kayu. Lahan gambut mencakup sekitar 12% dari daratan di Asia Tenggara, akan tetapi 25% dari kegiatan
deforestasi di wilayah ini terjadi di lahan gambut. Dari 27 juta hektar lahan gambut, 12 juta hektar (45%) saat ini mengalami deforestasi dan sebagian besar mengalami pengeringan. Salah satu komoditas perkebunan di lahan gambut adalah minyak dari kelapa sawit, yang saat ini penggunaanya untuk bio fuel/BBM nabati semakin meningkat di Eropa.
Pada proyek PEAT-CO2, emisi saat ini dan mendatang dari lahan gambut yang dikeringkan dihitung berdasarkan data terakhir tentang luasan dan kedalaman gambut, tata guna lahan dan praktek pengelolaan air saat ini dan mendatang serta laju dekomposisi dan emisi dari kebakaran. Diperoleh data bahwa emisi CO2 saat ini dari dekomposisi lahan gambut yang dikeringkan mencapai jumlah 632 Mton/tahun ( antara 355 dan 874 Mton/tahun). Emisi ini akan terus
taken. Over 90% of this emission originates
from Indonesia, which puts the country in 3
rdplace (after the USA and China) in the global
CO2 emission ranking.
It is concluded that deforested and drained
peatlands in SE Asia are a globally significant
source of CO
2
emissions and a major obstacle
to meeting the aim of stabilizing greenhouse gas
emissions, as expressed by the international
community. It is therefore recommended that
international action is taken to help SE Asian
countries, especially Indonesia, to better
conserve their peat resources through forest
conservation and through water management
improvements aiming to restore high water
tables.
yang dilakukan. Lebih 90% emisi ini berasal dari Indonesia, yang memposisikan negara ini pada urutan ke-3 (setelah Amerika Serikat dan Cina) dalam peringkat emisi CO2 dunia.
Contents /
Daftar Isi
1 Introduction / Pendahuluan ...1
1.1 Background / Latar belakang ...1
1.2 This Study and Report / Tentang kajian dan laporan ini ...2
1.3 Acknowledgements / Ucapan terima kasih ...4
2 Analysis approach / Pendekatan analisa ...5
2.1 Analysis area / Wilayah analisa ...5
2.2 Analysis steps / Langkah-langkah analisa ...5
2.3 Data sources / Sumber data ...6
3 Analyses and results / Analisa dan Hasil ...9
3.1 Peatland distribution, thickness and carbon storage / Sebaran lahan gambut, ketebalan dan simpanan karbon... 9
3.2 Current (year 2000) and projected land use on peatlands / Tata guna lahan gambut saat ini (tahun 2000) dan proyeksi mendatang ...10
3.3 Current and projected CO2 emissions from oxidation in drained peatlands / Emisi CO2 saat ini dan proyeksinya dari oksidasi di lahan gambut yang dikeringkan ...25
3.4 CO2 emissions from peatland fires / Emisi CO2 dari kebakaran lahan gambut ...31
4 Discussion of uncertainties / Diskusi mengenai ketidakpastian ...3 5 4.1 Uncertainty sources / Sumber-sumber ketidakpastian ...35
4.2 Assessment of overall uncertainty / Kajian ketidakpastian keseluruhan ...41
4.3 Proposed research activities to reduce uncertainties / Aktivitas penelitian yang diusulkan untuk mengurangi ketidakpastian ...42
5 Conclusions and recommendations / Kesimpulan dan Rekomendasi ...4 5 5.1 Recommendations for improved peatland carbon conservation / Rekomendasi untuk peningkatan konservasi karbon di lahan gambut ...49
1
Introduction
1.1
Background
Peatlands cover 3% (some 4 million km2) of the Earth’s land area (Global Peatlands Initiative, 2002) and store a large fraction of the Worlds terrestrial carbon resources: up to 528,000 Megatonnes (Gorham 1991, Immirzi and Maltby 1992), equivalent to one-third of global soil carbon and to 70 times the current annual global emissions from fossil fuel burning (approximately 7,000 Mt/y in 2006 in carbon equivalents or 26,000 Mt/y in CO2 equivalents).
This carbon store is now being released to the Earth’s atmosphere through two mechanisms:
• Drainage of peatlands leads to aeration of the peat material and hence to oxidation (also called aerobic decomposition). This oxidation of peat material (which consists of some 10% plant remains and 90% water) results in CO2 gas emissions. Much of the dry peat matter is carbon (50% to 60% in SE Asia, depending on peat type). • Fires in degraded peatlands result in
further CO2 gas emissions; fires are extremely rare in non-degraded and non-drained peatlands.
Most rapid peatland degradation presently occurs in SE Asia where the peatlands are being deforested, drained and burnt for development of oil palm and timber plantations, agriculture and logging. Apart from CO2 emissions, these developments are also a threat to the remaining biodiversity in SE Asia as the peatlands are an important habitat for many endangered species, including Orang Utan in Borneo and
Sumatran Tiger in Sumatra. Furthermore, the peat fires cause regional haze (smog) problems that affect public health and economies in the SE Asian region.
1
Pendahuluan
1.1
Latar Belakang
Lahan gambut mencakup 3% (sekitar 4 juta km2)
dari daratan bumi (Global Peatlands Initiative, 2002) dan menyimpan sebagian besar sumber daya karbon terestrial dunia: mencapai 528.000 Mton (Gorham 1991, Immirzi dan Maltby 1992), kurang lebih setara dengan 1/3 dari karbon dalam tanah global dan 70 kali lebih besar dari emisi tahunan global saat ini yang berasal dari pembakaran bahan bakar fosil (sekitar 7.000 Mton/tahun pada tahun 2006 dilihat dari kandungan Karbon saja atau 26.000 juta ton/tahun apabila dilihat dari kandungan CO2).
Pada saat ini, simpanan karbon sedang mengalami pelepasan ke atmosfer melalui dua mekanisme:
• Pengeringan lahan gambut yang mengarah
kepada aerasi bahan gambut dan kemudian menyebabkan terjadinya oksidasi (disebut juga dekomposisi aerobik). Oksidasi material gambut ini (yang tersusun atas 10% sisa tumbuhan dan 90% air) menghasilkan emisi gas CO2. Bahan gambut kering ini sebagian besar adalah Karbon (50% sampai 60% di Asia Tenggara, tergantung kepada tipe gambutnya).
• Kebakaran yang terjadi di lahan gambut
terdegradasi menghasilkan emisi CO2; kebakaran sangat jarang sekali terjadi di kawasan gambut yang tidak terdegradasi atau yang tidak dikeringkan
Degradasi lahan gambut yang paling cepat saat ini terjadi terutama di Asia Tenggara, dimana lahan gambut mengalami deforestasi, dikeringkan dan dibakar untuk pengembangan kebun kelapa sawit, hutan tanaman industri, pertanian dan penebangan kayu. Selain berupa emisi CO2, kegiatan
pengembangan ini juga menjadi ancaman bagi keanekaragaman hayati yang masih tersisa di Asia Tenggara, dimana lahan gambut merupakan habitat penting bagi berbagai jenis terancam, termasuk Orang utan di Kalimantan dan Harimau Sumatra di Pulau Sumatra. Lebih jauh lagi kebakaran gambut telah menimbulkan masalah kabut asap regional yang mempengaruhi kesehatan masyarakat dan
The PEAT-CO2 project (Peatland CO2 Emission Assessment Tool) aims to quantify the CO2 emissions resulting from different water management strategies in peatland. The data for SE Asia used in PEAT-CO2 show that peatlands cover 27.1 Million hectares in SE Asia (defined here as
Indonesia, Malaysia, Brunei and Papua New Guinea), or 10% of the total land area. Over 22.5 Million hectares (83%) of this are in Indonesia, with a further 2 Million hectares in Malaysia and 2.6 Million hectares in Papua New Guinea. Peat thicknesses range from less than 1 to over 12 metres; a significant fraction of peatlands are over 4 metres thick (at least 17% in Indonesia). According to PEAT-CO2 calculations the total carbon store in SE Asian peatlands is at least 42,000 Mt (assuming a carbon content of 60 kg/m3); this estimate is likely to increase when peat thicknesses and peat characteristics are better known.
Scientists have been aware of the link between peatland development and CO2 emissions for some time, but policy makers and peatland managers are still insufficiently aware of the global implications of local and national peatland management strategies and actions. As a result, CO2 emissions from SE Asia’s drained and burning peatlands are not yet recognized in the global climate change debate, and the major coordinated international action required to help these countries to better manage their peatlands has yet to start.
1.2
This Study and Report
The PEAT-CO2 project was started in 2005 by Delft Hydraulics in collaboration with Wetlands International and Alterra, to: A) Demonstrate the causal links between drainage and CO2 emissions (i.e. awareness raising);
B) Quantify the actual emissions caused by peatland drainage (i.e. research), and
Proyek PEAT-CO2 (Peatland CO2 Emission
Assessment Tool) bertujuan untuk menghitung emisi CO2 yang dihasilkan dari berbagai strategi
pengelolaan air di lahan gambut. Data untuk Asia Tenggara yang digunakan dalam PEAT-CO2
menunjukkan bahwa lahan gambut mencakup wilayah seluas 27,1 juta hektar di Asia Tenggara (dalam hal ini maksudnya adalah Indonesia, Malaysia, Brunei, dan Papua Nugini), atau 10% dari seluruh luas
daratannya. Lebih dari 22,5 juta hektar (83%) berada di Indonesia, sementara 2 juta hektar lainnya berada di Malaysia dan 2,6 juta hektar di Papua Nugini. Ketebalan gambut bervariasi mulai dari 1 sampai dengan 12 meter; gambut dengan ketebalan 4 meter cukup signifikan luasannya (setidaknya 17% berada di Indonesia). Menurut perhitungan PEAT-CO2, jumlah total karbon yang tersimpan di lahan gambut Asia Tenggara setidaknya berjumlah 42.000 Mton (dengan mengasumsikan bahwa kandungan karbon adalah sebesar 60kg/m3 ); perkiraan akan dapat lebih besar
angkanya apabila ketebalan dan karakteristik gambut telah lebih banyak diketahui.
Selama ini para ilmuwan telah menyadari hubungan antara pengembangan lahan gambut dan emisi, akan tetapi para pengambil kebijakan dan pengelola lahan basah masih kurang menyadari akan implikasi global dari strategi dan tindakan pengelolan lahan gambut lokal dan nasional mereka. Akibatnya, emisi CO2 dari lahan gambut yang dikeringkan dan terbakar di Asia Tenggara tidak diperhitungkan dalam debat perubahan iklim global, dan belum dimulai adanya suatu aksi besar skala internasional yang terkoordinasi untuk membantu negara-negara tersebut dalam mengelola lahan gambutnya dengan lebih baik.
1.2
Tentang Kajian dan Laporan
Ini
Proyek PEAT-CO2 dimulai sejak tahun 2005 oleh Delft Hydraulics bekerjasama dengan Wetlands International dan Alterra, untuk:
A) Mendemonstrasikan kaitan sebab akibat antara pengeringan (drainase) dan emisi CO2 (terkait dengan peningkatan kesadaran);
C) Develop peatland management support tools with a focus on water management.
In 2005, the PEAT-CO2 project determined global CO2 emissions from drained peatland on a regional basis, and developed a
prototype of a PEAT-CO2 tool for rapid peatland management strategy assessments.
In 2006 the PEAT-CO2 project determined CO2 emissions from SE Asia alone, using more accurate data and improved assessment methods. The results of the latter activity are presented here.
This document is a consultancy report. A scientific paper on approach and results of the study will be published in a special issue of Ecology, in 2007.
C) Mengembangkan perangkat pendukung pengelolaan lahan gambut dengan fokus pada pengelolaan air.
Pada tahun 2005, Proyek PEAT-CO2 telah menghitung emisi CO2 global dari pengeringan lahan gambut dalam skala regional, dan mengembangkan suatu prototipe dari perangkat PEAT-CO2 untuk pengkajian strategi pengelolaan lahan gambut secara cepat.
Pada tahun 2006, Proyek PEAT-CO2 telah
menghitung emisi CO2 khusus untuk Asia Tenggara, dengan menggunakan data yang akurat dan metoda kajian yang telah ditingkatkan. Hasil dari kegiatan terakhir disajikan dalam laporan ini.
Dokumen ini merupakan laporan konsultasi. Suatu makalah ilmiah sedang dalam tahap persiapan dan hasil dari kajian ini akan diterbitkan dalam edisi khusus Ecology pada tahun 2007.
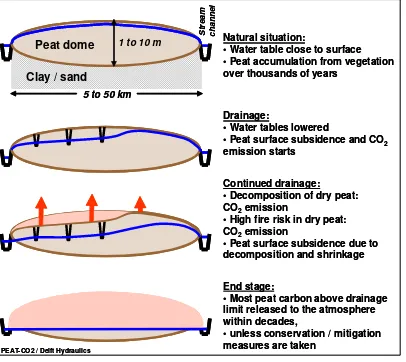
Clay / sand
Peat dome Natural situation:•Water table close to surface
•Peat accumulation from vegetation over thousands of years
S
•Water tables lowered
•Peat surface subsidence and CO2 emission starts
Continued drainage:
•Decomposition of dry peat: CO2emission
•High fire risk in dry peat: CO2emission
•Peat surface subsidence due to decomposition and shrinkage
End stage:
•Most peat carbon above drainage limit released to the atmosphere within decades,
•unless conservation / mitigation measures are taken
PEAT-CO2 / Delft Hydraulics
1.3
Acknowledgements
Within Delft Hydraulics the following persons contributed to the study and to this report:
Jaap Kwadijk, Rinus Vis, Marcel Ververs, Rolf van Buren, Marjolijn Haasnoot and others.
The following other organizations and persons were actively involved in the study presented here:
• Wetlands International (Marcel Silvius). • Alterra (Henk Wösten).
• University of Leicester (Susan Page). • SarVision (Niels Wielaard).
Furthermore, the following organizations and persons are gratefully acknowledged for data and other support:
• Global Carbon Project / CSIRO (Pep Canadell, David Hilbert).
• Global Environment Centre (Faizal Parish).
• Global Forest Watch (Fred Stolle). • Remote Sensing Solutions (Florian
Siegert).
• University of Helsinki (Jyrki Jauhiainen).
The PEAT-CO2 research for SE Asia was financed by Delft Hydraulics from its R&D budget. Complementary budgets were
provided by Wetlands International and WWF Indonesia for production of this report and presentation of results at the UNFCC COP12 in Nairobi, November 2006.
1.3
Ucapan Terima Kasih
Dalam lingkup Delft Hydraulics, individu-individu berikut memberikan kontribusi dalam kajian dan laporan ini :
Jaap Kwadijk, Rinus Vis, Marcel Ververs, Rolf van Buren, Marjolijn Haasnoot dan lainnya.
Organisasi dan individu berikut ini terlibat secara aktif dalam kajian yang disajikan dalam laporan ini:
• Wetlands International (Marcel Silvius).
• Alterra (Henk Wösten).
• University of Leicester (Susan Page).
• SarVision (Niels Wielaard).
Selanjutnya, ucapan terimakasih dihaturkan kepada organisasi-organisasi dan individu-individu berikut atas kontribusi data dan dukungan lainnya:
• Global Carbon Project / CSIRO (Pep Canadell,
David Hilbert).
• Global Environment Centre (Faizal Parish).
• Global Forest Watch (Fred Stolle).
• Remote Sensing Solutions (Florian Siegert).
• University of Helsinki (Jyrki Jauhiainen).
2
Analysis approach
2.1
Analysis area
The current analysis pertains to lowland peatlands in SE Asia:
• For the purpose of this study, 4 countries in SE Asia are included which have major peat resources: Indonesia, Malaysia, Papua New Guinea and Brunei. Smaller peatland areas are found in Thailand,
Vietnam, Cambodia and the
Philippines. However, these are less well studied and equivalent in area and carbon volume to only a few percent of the region included. They are therefore excluded from the analysis.
• The study includes only lowland peatlands, defined as peatlands under 300m above Sea level. Some peatland areas exist in higher areas in SE Asia, however the area of these peatlands was found to be less than 3% of the peatland area, mostly in Papua (formerly Irian Jaya, in Indonesia) and Papua New Guinea, and probably represents less than 1% of the peatland carbon store as the peat deposits typically have only limited thickness.
2.2
Analysis steps
The present and future CO2 emissions from drained peatlands in SE Asia were
determined in a number of steps:
A) Develop a peatland distribution map (Figure 2).
B) Develop a peatland land use map for the year 2000 (Figure 4, Figure 5). C) Calculate peatland areas under
different land uses, by Province, State and Country, in 2000 (Table 1).
2
Pendekatan Analisa
2.1
Wilayah Analisa
Analisa saat ini diterapkan untuk lahan gambut dataran rendah di Asia Tenggara:
• Untuk keperluan studi ini, kajian dilakukan
untuk 4 negara di Asia Tenggara yang memiliki sumber daya gambut terbesar: Indonesia, Malaysia, Papua Nugini dan Brunei. Sebenarnya lahan gambut lebih kecil dapat ditemukan di Thailand, Vietnam, Kamboja dan Filipina. Akan tetapi oleh karena kecilnya persentasi luasan dan volume karbon dan masih sedikitnya kajian, maka negara-negara tersebut tidak
disertakan dalam analisa ini.
• Studi ini hanya menyertakan lahan gambut
di dataran rendah, yang didefinisikan sebagai lahan gambut yang berada dibawah 300 meter di atas permukaan laut.
Beberapa wilayah lahan gambut berada di dataran tinggi Asia Tenggara, akan tetapi luasannya kurang dari 3% keseluruhan wilayah lahan gambut, sebagian besar berada di Papua (dahulu disebut Irian Jaya, di Indonesia) dan Papua Nugini, dan kemungkinan hanya mewakili kurang dari 1% simpanan karbon lahan gambut karena deposit gambutnya pada umumnya hanya memiliki ketebalan yang terbatas.
2.2
Langkah-langkah analisa
Emisi CO2 saat ini dan mendatang dari lahan gambut yang dikeringkan di Asia Tenggara ditentukan melalui beberapa langkah:
A) Mengembangkan peta sebaran lahan (Gambar 2).
B) Mengembangkan suatu peta tata guna lahan gambut untuk tahun 2000.
D) Determine trends in land use in peatlands, by Province (Indonesia), State (Malaysia) and Country (Brunei, PNG) (Figure 11, Table 2, Table 3, Figure 6).
E) Determine drainage depths for land use types and determine the relation between drainage depth and CO2 emission (Table 5, Figure 12). F) Determine CO2 emissions from
oxidation in drained peatlands by Province, State and Country, in 2000 and in the future (Figure 13, Figure 14).
G) Estimate additional CO2 emissions from degraded and drained peatlands (Figure 16).
The basic method of analysis enabled determination of the presence of relevant parameters (presence of peat, thickness of peat, presence of drainage, depth of drainage, rate of change in drainage, etc) in GIS maps with a resolution of 1km. The Arc-GIS package was used for this. The results were than summarized in Tables by geographic analysis units, and further calculations were performed using these Tables.
2.3
Data sources
Data were obtained from several sources, including preliminary results of studies that have yet to be published.
2.3.1 Peat extent and thickness
• Peat extent and peat thickness data for Kalimantan and Sumatra, collected in field surveys over 1990-2002, were provided by Wetlands International. These data are an improvement over the FAO soil data used in earlier analyses, which has lower accuracy and detail and no thickness information. However, numbers can still be improved especially for peat thickness.
D) Menentukan kecenderungan tata guna lahan di lahan gambut, per propinsi (Indonesia), per negara bagian (Malaysia) dan Negara (Brunei dan Papua Nugini) (Gambar 11, Tabel 2, Tabel 3, Gambar 6).
E) Menentukan kedalaman drainase untuk berbagai tipe tata guna lahan dan
menentukan hubungan antara kedalaman drainase dan emisi CO2 (Tabel 5, Gambar 12).
F) Menentukan emisi CO2 yang berasal dari oksidasi di lahan gambut yang dikeringkan per propinsi, negara bagian dan negara, untuk tahun 2000 dan masa mendatang (Gambar 13, Gambar 14).
G) Memperkirakan emisi CO2 tambahan dari lahan gambut yang terdegradasi dan dikeringkan (Gambar 16).
Metoda dasar dari analisa yang digunakan mampu menentukan keberadaan paramater-parameter yang relevan (keberadaan gambut, kedalaman gambut, keberadaan drainase, kedalaman drainase, tingkat perubahan drainase, dan lain sebagainya) pada peta GIS dengan resolusi sampai 1 km. Paket perangkat lunak Arc-GIS digunakan untuk kebutuhan ini. Hasil-hasilnya disarikan dalam tabel menurut unit-unit analisa geografis, dan perhitungan selanjutnya dilakukan dengan menggunakan tabel-tabel tersebut.
2.3
Sumber data
Data diperoleh dari berbagai sumber, termasuk dari berbagai kajian awal yang belum dipublikasikan.
2.3.1 Sebaran dan ketebalan gambut
• Data sebaran dan ketebalan gambut untuk
• For the remaining areas, the FAO Digital Soil Map of the World was used to determine peat percentage in soil classes, using decision rules supplied by the International Soil Reference and Information Centre (ISRIC). Peat thickness data for Papua / Irian Jaya were provided by Wetlands International. Peat thickness in other areas was estimated as described later.
2.3.2 Land use
• SE Asia land use data for the year 2000 were obtained from the GLC 2000 global land cover classification, an EU-JRC product derived from SPOT
VEGETATION satellite data at a 1km resolution.
• Indonesian forest cover data for the years 1985 and 1997, and plantation concession data, were provided by the World Resources Institute (Global Forest Watch).
• Analysis results for land cover datasets (based on satellite data) over the years 2000-2005 were provided by SarVision.
2.3.3 Drainage and CO2 emission
• Numbers for typical drainage intensity and drainage depth for different land use classes (‘cropland’, ‘mosaic cropland + shrubland’, ‘shrubland’) were estimated in consultation with the experts involved in the study presented here, all of whom have considerable field experience in peatlands in SE Asia.
• The relation between average drainage depth and CO2 emission was provided by Dr Henk Wösten of Alterra, and is supported by a literature review (the review received additional inputs from Dr Jyrki Jauhiainen of the University of Helsinki). The relation is a simplification
• Untuk daerah-daerah lainnya, digunakan peta
tanah digital FAO dari Map of the World untuk menentukan persentasi gambut dalam kelas-kelas tanah, dengan menggunakan aturan pengambilan keputusan yang diberikan oleh the International Soil Reference and Information
Centre (ISRIC). Data ketebalan gambut Papua
disediakan oleh Wetlands International.
Ketebalan gambut untuk daerah-daerah lainnya diperkirakan, dimana lebih jelasnya akan dikemukakan kemudian.
2.3.2 Tata guna lahan
• Data tata guna lahan Asia Tenggara untuk tahun
2000 diperoleh dari klasifikasi tutupan lahan global GLC 2000, produk dari EU-JRC yang dikembangkan menggunakan data satelit SPOT vegetation pada resolusi 1 km.
• Data tutupan hutan Indonesia untuk tahun 1985
dan 1997, dan data konsesi perkebunan,
diperoleh dari World Resources Institute (Global Forest Watch).
• Hasil analisa untuk data tutupan lahan
(berdasarkan data satelit) sepanjang tahun 2000-2005 diperoleh dari SarVision.
2.3.3 Pengeringan dan emisi CO2
• Angka-angka untuk intensitas drainase umum
dan kedalaman drainase untuk kelas-kelas tata guna lahan yang berbeda (“lahan tanaman pangan’, ‘mosaik lahan tanaman pangan + lahan bersemak’, ‘lahan bersemak’) dihitung melalui konsultasi dengan para ahli yang terlibat dalam kajian ini, kesemua ahli tersebut telah memiliki pengalaman lapangan yang memadai di lahan gambut di Asia Tenggara.
• Relasi antara kedalaman drainase rata-rata dan
and needs to be further developed, but is considered applicable for a drainage depth range between 0.5m and 1m, which is the most common drainage depth range in the analysis area.
2.3.4 Emissions from peatland fires
• Data on 1997-2006 hotspot counts in Borneo were provided by Dr Florian Siegert of Remote Sensing Solutions; these data will be published separately.
• Analysis of CO2 emissions during the 1997 peatland fires in Indonesia,
published by Dr Susan Page (NATURE, 2002), is the basis for defining average CO2 emissions over 1997-2006.
• Preliminary results on the relation between land use and fire frequency were provided by Dr Allan Spessa of the Max Planck Institute.
penyederhanaan dan masih memerlukan pengembangan selanjutnya, tetapi dianggap dapat diterapkan pada kedalaman drainase antara 0,5 m dan 1 m, dimana kedalaman tersebut umum ditemukan di wilayah analisa.
2.3.4 Emisi dari kebakaran di lahan
gambut
• Data Titik api tahun 1997-2006 di pulau
Kalimantan diperoleh dari Dr Florian Siegert dari Remote Sensing Solutions; data tersebut akan dipublikasikan secara terpisah.
• Analisa emisi CO2 selama kebakaran lahan
gambut tahun 1997 di Indonesia, yang
dipublikasikan oleh Dr Susan Page (NATURE, 2002), menjadi dasar bagi penentuan emisi CO2 rata-rata selama tahun 1997-2006.
• Hasil-hasil awal mengenai relasi antara tata
3
Analyses and
results
3.1
Peatland distribution,
thickness and carbon
storage
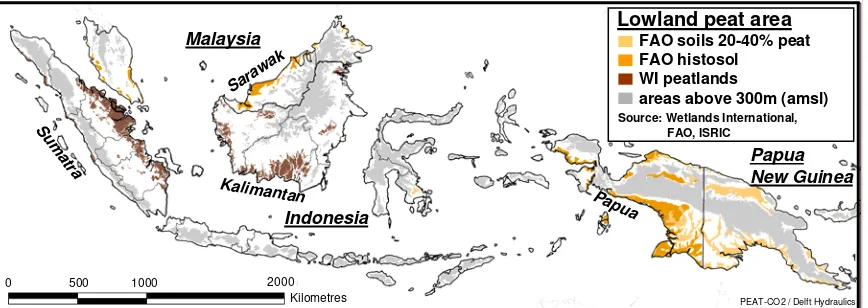
Peatland distribution in SE Asia is shown in Figure 2. The total peatland area in SE Asia is calculated at 27.1 million hectares, or 271,000 km2 (Table 2). To put this in perspective: this is 10% of the SE Asian land area and approximately equal to the land area of the British Isles. Indonesia alone has 22.5 million hectares, which is 12 percent of its land area and 83% of the SE Asian peatland area.
Peat thickness in Indonesia (Sumatra,
Kalimantan and Papua) ranges from less than 1 metre to over 12 metres, as shown in Figure 3. While 42% of the peatland area in
Indonesia is over two metres thick, these thicker peat deposits store 77% of the total peat (and carbon, approximately) deposits. It is expected similar distributions apply for the remaining peatlands of SE Asia. Peat
thicknesses outside Indonesia were estimated conservatively: an average thickness of 3m was assumed for Malaysia and Brunei
(assumed similar to neighbouring Kalimantan), a thickness of 1.5 metres was assumed for Papua New Guinea (assumed similar to neighbouring Papua).
Carbon storage in peatlands depends on the type of peat deposits. In SE Asia, almost all lowland peat is derived from forest vegetation and has a high wood content, however the degree of decomposition varies from peatland to peatland and within peatlands. Most studies (e.g. Page et al, 2002) consider a value in the order of 60 kgC/m3 to be representative for SE Asian peatlands in general. Using this figure, the peat extent- and thickness data used in the current study yield a total approximate carbon storage in SE Asian peatlands of 42,000 Megatons.
3
Analisa dan hasil
3.1
Sebaran lahan gambut,
ketebalan dan simpanan
karbon
Sebaran lahan gambut di Asia Tenggara disajikan pada Gambar 2. Luas total lahan gambut di Asia Tenggara mencapai 27,1 juta hektar, atau 271.000 km2 (Tabel 2). Dengan kata lain: sebanding dengan
10% dari luas daratan di Asia Tenggara dan kurang lebih sama dengan luas daratan the British Isles. Indonesia sendiri memiliki 22,5 juta hektar, atau 12% dari seluruh luas daratannya dan 83% dari keseluruhan lahan gambut di Asia Tenggara.
Ketebalan gambut di Indonesia (Sumatra, Kalimantan dan Papua) berada pada rentang kurang dari 1 meter sampai dengan lebih dari 12 meter, seperti yang ditunjukkan dalam Gambar 3. Sementara 42% dari lahan gambut Indonesia memiliki kedalaman lebih dari 2 meter, deposit gambut-tebal tersebut menyimpan 77% dari simpanan gambut (dan karbon) total. Diperkirakan sebaran yang sama berlaku untuk daerah-daerah lahan gambut lainnya di Asia Tenggara. Ketebalan gambut diluar Indonesia diperkirakan secara konservatif: dengan ketebalan rata-rata 3 m untuk Malaysia dan Brunei (diasumsikan sama dengan wilayah Kalimantan di wilayah Indonesia), ketebalan 1,5 meter diasumsikan untuk lahan gambut di Papua Nugini (dengan asumsi yang sama untuk Papua).
Simpanan karbon di lahan gambut bergantung kepada tipe deposit gambutnya. Di Asia Tenggara, hampir keseluruhan gambut dataran rendah berasal dari vegetasi hutan dan memiliki kandungan kayu yang tinggi, namun demikian tingkat dekomposisi berbeda antar satu lahan gambut dengan lahan gambut lainnya dan di dalam lahan gambut itu sendiri. Kebanyakan kajian (misalnya Page et. al, 2002) menganggap nilai sebesar 60 kgC/m3 cukup mewakili lahan gambut
Asia Tenggara pada umumnya. Dengan
Lowland peat area
FAO soils 20-40% peat FAO histosol
WI peatlands
areas above 300m (amsl)
Source: Wetlands International, FAO, ISRIC
PEAT-CO2 / Delft Hydraulics
S
0 500 1000 2000 Kilometres
Peat depth class (m)
Peat
Source: Wetlands International
0
Peat depth class (m)
C
Source: Wetlands International
Figure 2 Lowland peat extent in SE Asia. The Wetlands International data have higher detail and accuracy than the FAO data.
Figure 3 Peat depth/thickness classes by area. Large areas of peatland are in excess of 3 metres deep (Data: Wetlands International 2003, 2004
3.2
Current (year 2000) and
projected land use on
peatlands
3.2.1 Distribution of forest cover and land use types on peatlands
Land use in the base year 2000 was derived from the GLC 2000 global land use / land cover spatial dataset. This dataset consists of (approximately) 1km cells which have been assigned specific land use classes; cells within geographic analysis units (Provinces, States and Countries) were added up by class to derive total areas for each class within each unit. This was done separately for the entire area and for lowland peatlands (under 300m elevation), by ‘masking’ the land use data with the peat area dataset described
3.2
Tata guna lahan gambut
saat ini (tahun 2000) dan
proyeksi mendatang
3.2.1 Sebaran tutupan hutan dan tipe tata
guna lahan di lahan gambut
earlier. The results of this analysis are shown in Table 1.
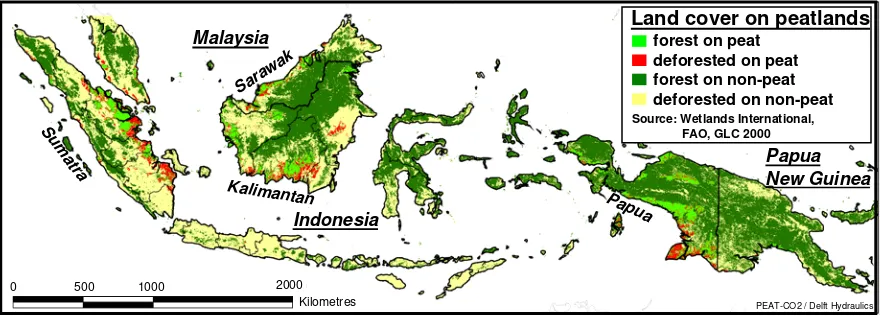
In 2000, 61% of peatlands in SE Asia (that is, the countries included in the analysis: Indonesia, Malaysia, Papua New Guinea and Brunei) were covered in forest according to the GLC 2000 classification (Table 1). The same figure of 61% forest cover in 2000 applies to Indonesia. Within Indonesia, Papua had the highest remaining forest cover on peatlands (72%), Sumatra the lowest (52%).
dengan dataset wilayah gambut yang telah dijelaskan sebelumnya. Hasil analisa ini disajikan dalam Tabel 1.
Pada tahun 2000, seluas 61% lahan gambut di Asia Tenggara (Indonesia, Malaysia, Papua Nugini dan Brunei) masih tertutup oleh hutan menurut
klasifikasi GLC 2000 (Tabel 1). Angka yang sama sebesar 61% tutupan hutan juga berlaku untuk Indonesia. Di Indonesia, Papua memiliki tutupan hutan paling luas di atas lahan gambut (72%) sementara Sumatra terendah (52%).
PEAT-CO2 / Delft Hydraulics
S
um
atra
Kalimantan Sara
wak
Papua
Indonesia Malaysia
Papua New Guinea Land cover 2000
Forest
Shrubland (inc burnt areas) Mosaic Cropland + Shrub Cropland
Source: GLC 2000 (JRC, EU)
0 500 1000 2000 Kilometres
PEAT-CO2 / Delft Hydraulics
Su
m
atra
Kalimantan Sara
wak
Papua
Indonesia Malaysia
Papua New Guinea Land cover on peatlands
forest on peat deforested on peat forest on non-peat deforested on non-peat
Source: Wetlands International, FAO, GLC 2000
0 500 1000 2000 Kilometres
Figure 4 Land use in SE Asia as determined from GLC 2000 dataset.
Forest Shrubland + burnt Mosaic: crop+shrub Cropland
Source: GLC 2000
y = 0.2392x - 3.0027
Non-forest cover in peatland area (%)
C
PEAT-CO2 / Delft Hydraulics
y = 0.6932x - 1.8322
Non-forest cover in peatland area (%)
C
PEAT-CO2 / Delft Hydraulics
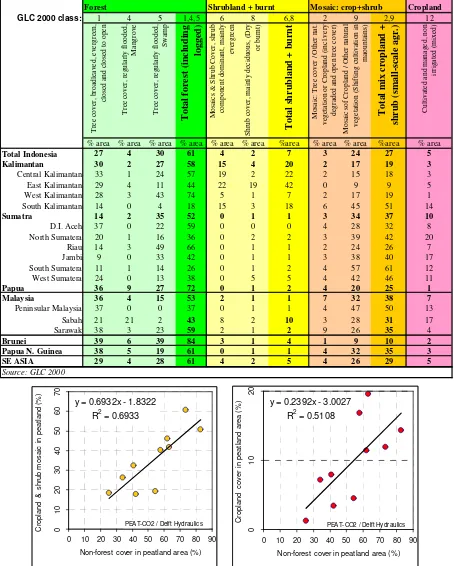
Figure 6 Comparison of peatland land use in Indonesian Provinces yields insight in land use development trends. Areas are expressed as a percentage of total peat area by Province, as in Table 1.
Left: the area of ‘cropland & shrubland mosaic’ (i.e. small-scale agriculture, more or less) increases proportionally with the total deforested area.
Right: the area of ‘cropland’ (i.e. large-scale agriculture, more or less) also increases with the total deforested area, but the fraction cropland increases faster than other land uses.
3.2.2 Trends and projections in land use changes on peatlands
Deforestation rate on peatlands
The tropical peat swamp forests are under tremendous pressure from agriculture/ silviculture development and logging. Trends in forest cover in SE Asia were derived from changes between 1985 (World Resources Institute data) and 2000 (GLC 2000 data), as shown in Table 2. Over this period, peatlands were deforested at rate of 1.3% per year on average; the highest value is found in East Kalimantan (2.8%/y), the lowest in Papua (0.5%/y). As the 1985 data were only available for Indonesia, trend analysis for the other countries is based on comparison with Indonesia and results are less accurate. Trends for SE Asia were also verified for 2000-2005 using tentative SarVision data (Table 3); it
appears the average deforestation rate in peatlands in SE Asia over 2000-2005 is 1.5%/y (of forest cover in 2000). Allowing for the difference in reference years (1985 and 2000), these percentages are very similar and suggest that deforestation on peatlands has continued at a high rate over the past 20 years.
According to Table 2, 10.6 million hectares (39%) of peatland in SE Asia was
deforested in 2000. Accounting for
continued deforestation at a rate of 1.5%/y, the deforested peatland area in 2006 is around 45% of total peatland area, or 12.1 million hectares.
3.2.2 Kecenderungan dan proyeksi
perubahan tata guna lahan di lahan gambut
Laju deforestasi di lahan gambut
Hutan rawa gambut tropis sedang mengalami tekanan berat dari kegiatan pengembangan pertanian/silvikultur dan penebangan.
Kecenderungan penutupan lahan di Asia Tenggara dikembangkan dari perubahan antara tahun 1985 (data World Resource Institute) dan 2000 (data GLC 2000), seperti disajikan padaTabel 1. Selama periode ini, lahan gambut mengalami laju deforestasi rata-rata sebesar 1,3% per tahun; nilai tertinggi ditemukan di Kalimantan Timur (2,8%/tahun), terendah di Papua (0,5%/tahun). Oleh karena data tahun 1985 hanya tersedia untuk Indonesia, analisa kecenderungan untuk negara-negara lain didasarkan kepada perbandingan dengan Indonesia dan hasilnya agak sedikit tidak akurat. Kecenderungan pada tahun 2000-2005 untuk Asia Tenggara juga diverifikasi menggunakan data tentatif SarVision (Tabel 2); nampaknya rata-rata laju deforestasi lahan gambut di Asia Tenggara selama tahun 2000-2005 adalah 1,5 % / tahun (berdasarkan tutupan hutan tahun 2000). Sehubungan dengan perbedaan tahun referensi (1985 dan 2000), persentase tersebut menunjukkan angka yang mirip dan menunjukkan bahwa deforestasi di lahan gambut terus berlangsung dengan laju yang cepat selama 20 tahun belakangan ini.
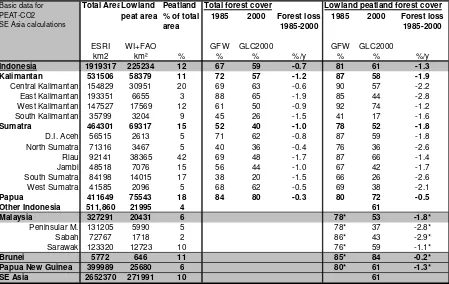
Table 2 Basic data for PEAT-CO2 calculations, including the rate of deforestation in lowland peatlands.
Note that the Global Forest Watch forest cover data for 1997 (not shown) indicate lower forest cover than the GLC 2000 data used in the analysis. The rate of deforestation used in PEAT-CO2 analyses is therefore considered conservative.
Basic data for Total AreaLowland Peatland Total forest cover Lowland peatland forest cover
PEAT-CO2 SE Asia calculations
peat area % of total area
1985 2000 Forest loss 1985-2000
1985 2000 Forest loss 1985-2000
ESRI WI+FAO GFW GLC2000 GFW GLC2000
km2 km² % % % %/y % % %/y
Indonesia 1919317 225234 12 67 59 -0.7 81 61 -1.3 Kalimantan 531506 58379 11 72 57 -1.2 87 58 -1.9
Central Kalimantan 154829 30951 20 69 63 -0.6 90 57 -2.2
East Kalimantan 193351 6655 3 88 65 -1.9 85 44 -2.8
West Kalimantan 147527 17569 12 61 50 -0.9 92 74 -1.2
South Kalimantan 35799 3204 9 45 26 -1.5 41 17 -1.6
Sumatra 464301 69317 15 52 40 -1.0 78 52 -1.8
D.I. Aceh 56515 2613 5 71 62 -0.8 87 59 -1.8
North Sumatra 71316 3467 5 40 36 -0.4 76 36 -2.6
Riau 92141 38365 42 69 48 -1.7 87 66 -1.4
Jambi 48518 7076 15 56 44 -1.0 67 42 -1.7
South Sumatra 84198 14015 17 38 20 -1.5 66 26 -2.6
West Sumatra 41585 2096 5 68 62 -0.5 69 38 -2.1
Papua 411649 75543 18 84 80 -0.3 80 72 -0.5 Other Indonesia 511,860 21995 4 61
Malaysia 327291 20431 6 78* 53 -1.8*
Peninsular M. 131205 5990 5 78* 37 -2.8*
Sabah 72767 1718 2 86* 43 -2.9*
Sarawak 123320 12723 10 76* 59 -1.1*
Brunei 5772 646 11 85* 84 -0.2* Papua New Guinea 399989 25680 6 80* 61 -1.3* SE Asia 2652370 271991 10 61
* Estimated
Comparison of forest cover and trends on peatlands and non-peatlands
The year 2000 forest cover on peatlands in SE Asia is similar to that in non-peatlands
(according to the GLC 2000 dataset): 61% vs 59% in Indonesia, 51% vs 56% in Malaysia, 82 vs 80% in Papua New Guinea (Table 1). However, the deforestation rate in peatlands over 1985-2000 was almost double that in non-peatlands: 1.3%/y vs 0.7%/y in Indonesia (Table 2). Tentative findings by SarVision suggest that the deforestation rate in peatlands is stable since 2000 to 1.5%/y (Table 3, Figure 7), while that in non-peatlands is lower
(0.85%/y) and has decreased in recent years. As a result, deforestation of peatlands
amounted to 25% of all deforestation in SE Asia in the year 2005 (Table 3).
Perbandingan antara tutupan hutan dan kecenderungannya di lahan gambut dan non-gambut
Data tutupan hutan di lahan gambut pada tahun 2000 di Asia Tenggara menunjukkan angka yang serupa dengan data untuk lahan non-gambut (menurut dataset GLC 2000): 61% vs 59% untuk Indonesia, 51% vs 56% untuk Malaysia, 82% vs 80% untuk Papua Nugini (Tabel 1). Namun demikian, laju deforestasi di lahan gambut selama tahun 1985-2000 hampir dua kali lipat dibandingkan di lahan non-gambut: 1,3%/tahun vs 0,7%/tahun untuk Indonesia (Tabel 1). Temuan sementara dari SarVision menujukkan bahwa laju deforestasi di lahan gambut adalah stabil sejak tahun 2000 yaitu sebesar 1,5%/ tahun Tabel 2, Gambar 4), sementara untuk wilayah non-gambut angkanya lebih rendah (0,85% / tahun) dan terus menurun pada tahun-tahun belakangan ini. Sebagai hasil, deforestasi di lahan gambut berjumlah sekitar 25% dari seluruh deforestasi di Asia
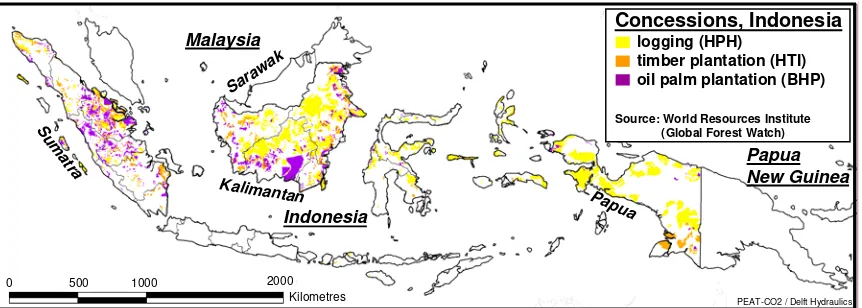
In relative terms, a greater oil palm and timber plantation area is planned on peatlands than on non-peatlands: 27% of concessions are planned on the 12% land surface that is peatland in Indonesia. No concession data were available for Malaysia at the time of this study, but the percentage of oil palm plantations on peatlands in Sarawak may be even greater (Figure 8).
Land use developments within deforested areas
Projections of land use change within deforested areas were based on the analysis of the relative areas of GLC 2000 classes (‘cropland’, ‘cropland + shrubland’ and ‘shrubland’) within the deforested areas of Indonesian Provinces (Figure 6). Linear relations derived as shown in Figure 6 were applied to the deforested area in the projections, at 5-year time steps. The advantage of this approach is transparency, the drawback is that once 100% of the peatland within a Province or Country is deforested, its land use is fixed. The area of ‘cropland’, interpreted as large-scale agriculture which has the highest drainage density and the deepest drainage, will not exceed 21% of the total area. The maximum area of ‘mosaic cropland + shrubland’, interpreted as small-scale agriculture with lower drainage density and depth, is 68% of the total deforested area. In actual fact the very large-scale and intensively drained palm oil and timber plantations concessions alone already cover 27% of the peatland area in Indonesia; a similar percentage may apply in Malaysia). The approach is therefore considered conservative: the future drainage intensity in deforested areas is probably
underestimated.
No projections were developed for the degree of degradation within forest areas, due to logging (legal and illegal) and due to
Secara relatif, lebih luas areal perkebunan kelapa sawit dan hutan industri direncanakan dibuka di lahan gambut daripada non-gambut: 27% lahan konsesi direncanakan pada 12 % luas daratan yang merupakan gambut di Indonesia. Tidak ada data konsesi tersedia untuk Malaysia pada saat kajian ini dilakukan, tetapi persentasi perkebunan kelapa sawit di lahan gambut di Sarawak diduga malah lebih besar (Gambar 5).
Pengembangan tata guna lahan di kawasan yang terdeforestasi
Proyeksi perubahan tata guna lahan di kawasan yang terdeforestasi dilakukan berdasarkan analisa kawasan relatif dari kelas-kelas GLC 2000 (‘lahan kebun’, ‘lahan kebun + lahan bersemak’ dan ‘lahan bersemak’) pada kawasan terdeforestasi di berbagai propinsi Indonesia (Gambar 6). Hubungan linear yang diperoleh sebagaimana disajikan dalam Gambar 6 diaplikasikan terhadap kawasan deforestasi pada proyeksi, dengan jarak setiap 5 tahun.Keuntungan dari pendekatan ini adalah transparansi,
kekurangannya adalah apabila 100% wilayah lahan gambut dalam suatu propinsi atau negara telah terdeforestasi, maka tata guna lahannya tidak akan berubah. Kawasan ‘lahan tanaman pangan’, di interpretasikan sebagai pertanian skala besar yang memiliki kerapatan drainase tertinggi dan drainase terdalam, tidak akan melebihi 21 % dari total area. Luasan maksimum ‘mosaik lahan tanaman pangan + lahan bersemak’ yang di interpretasikan sebagai pertanian skala kecil dengan kerapatan dan kedalaman drainase yang lebih rendah adalah 68% dari total kawasan yang terdeforestasi. Pada
faktanya kebun kelapa sawit dan hutan industri skala besar dengan drainase intesif sendiri telah mencakup kawasan seluas 27% dari luas lahan gambut di Indonesia (angka yang sama kemungkinan diperoleh juga untuk Malaysia). Oleh karena itu, dapat dikatakan bahwa pendekatan yang diambil adalah bersifat konservatif: intensitas drainase di masa depan pada areal terdeforestasi kemungkinan lebih kecil dari angka yang sebenarnya.
regional drainage impacts of plantations, for lack of data on this issue. This degradation is known to be rapidly increasing and to be accompanied by drainage and fires, and hence by CO2 emissions. Not including forest degradation in the PEAT-CO2 assessment inherently leads to a further underestimation of drained area in peatlands in this study.
regional drainase di perkebunan. Degradasi ini diketahui terus meningkat secara cepat dan diiringi oleh pengeringan dan kebakaran, dan tentu saja dengan emisi CO2. Tidak disertakannya degradasi hutan dalam kajian PEAT-CO2 ini, dengan
sendirinya mengarah kepada bertambahnya dugaan bahwa luasan daerah yang dikeringkan di lahan gambut dalam kajian ini sebenarnya lebih rendah dibandingkan dengan angka yang sebenarnya.
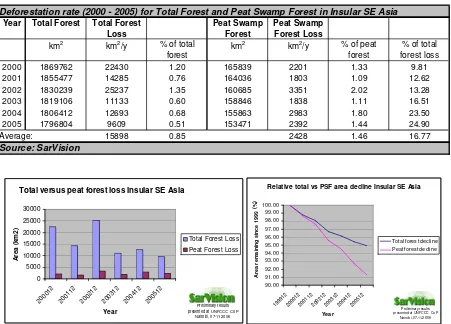
Table 3 Recent deforestation rates on peatland and non-peatland, for SE Asia, as determined by SarVision.
These are tentative results, for Insular South East Asia, of a systematic forest cover monitoring system for tropical forest regions developed by SarVision. The system uses SPOT Vegetation satellite images (work on integration of MODIS and MERIS is ongoing) and provides forest cover updates on a 3-monthly basis since 1999. Results have been overlain on the peat extent maps used in the PEAT-CO2 SE Asia study, to identify trends after the year 2000 (the PEAT-CO2 trend analysis covers the years 1985 and 2000).
Note that the forest determined by SarVision are somewhat different from the ones used in the current study, because SarVision has included part of Thailand and the Philippines in the analysis. This hardly affects the forest cover on peatlands, but it does affect the total forest area. Also, the definition of ‘forest cover’ used by SarVision appears to be somewhat different from the GLC 2000 definition.
Deforestation rate (2000 - 2005) for Total Forest and Peat Swamp Forest in Insular SE Asia
Year Total Forest Total Forest Loss
Peat Swamp Forest
Peat Swamp Forest Loss
2000 1869762 22430 1.20 165839 2201 1.33 9.81
2001 1855477 14285 0.76 164036 1803 1.09 12.62
2002 1830239 25237 1.35 160685 3351 2.02 13.28
2003 1819106 11133 0.60 158846 1838 1.11 16.51
2004 1806412 12693 0.68 155863 2983 1.80 23.50
2005 1796804 9609 0.51 153471 2392 1.44 24.90
Average: 15898 0.85 2428 1.46 16.77
Source: SarVision
Relative total vs PSF area decline Insular SE Asia
90.00
Total forest decline Peat forest decline
Preliminary results presented at UNFCCC CoP
Nairobi, 07-11-2006
(%
)
Total versus peat forest loss Insular SE Asia
0
Total Forest Loss Peat Forest Loss
Preliminary results presented at UNFCCC CoP
Nairobi, 07-11-2006
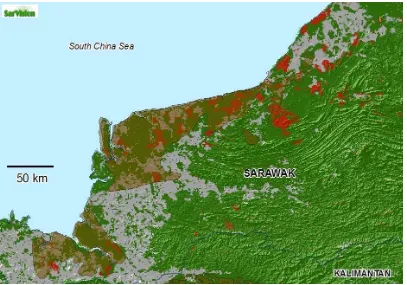
Figure 8 Deforestation data for Sarawak (provided by SarVision) show that around 50% of forest lands cleared from 1999 to June 2006 (red areas) are located on peat lands (brown areas). Field observations and rapid assessment of satellite data suggest that many of these areas are cleared for large scale oil palm plantations.
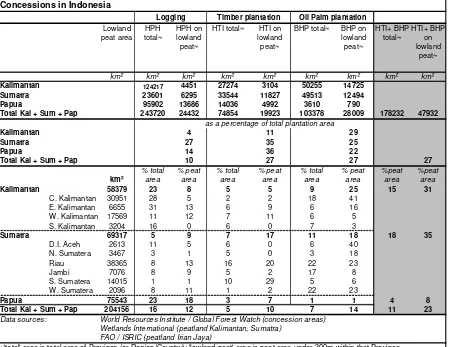
3.2.3 Timber and oil palm plantation concessions on peatlands
Knowing the area of concessions on peatlands is important for quantification of potential future CO2 emissions from peatlands.
There are three main types of concessions in SE Asian peatlands: logging concessions (HPH in Indonesia), timber plantation concessions much of which is acacia pulp wood plantations for paper production (HTI in Indonesia), and oil palm plantation concessions (BHP in Indonesia). Of these, especially the timber and oil palm plantation concessions on peatlands require intensive drainage.
Logging in peatlands (legally in HPH concessions, and illegally) is often
accompanied by construction of transport canals, which also drain the peatlands. This
3.2.3 Konsesi kayu dan kelapa sawit di
lahan gambut
Mengetahui daerah konsesi di lahan gambut adalah sangat penting untuk menghitung emisi CO2 potensial dari lahan gambut di masa mendatang.
Ada 3 macam tipe konsesi utama di lahan gambut Asia Tenggara: konsesi penebangan kayu (HPH di Indonesia), Hutan Tanaman Industri dengan komoditi sebagian besar kayu akasia untuk kebutuhan industri kertas (HTI di Indonesia) dan perkebunan kelapa sawit (BHP di Indonesia). Diantara ketiganya, Hutan industri dan perkebunan kelapa sawit di lahan gambut yang paling
memerlukan drainase intensif.
drainage is often less deep than in plantation areas, causing less CO2 emission unless accompanied by fires by unit area, but total emissions may still be significant as the areas involved are vary large.
No concession data were available for Malaysia and Papua New Guinea.
Concession data for the main peatland areas in Indonesia (Sumatra, Kalimantan and Papua), provided by the World Resources Institute, were available to determine the planned or potential areas of various land uses on peatlands (Table 4). These data cover both existing and planned
developments.
According to the concession data available, 27% of both timber and oil palm concession areas in Indonesia are on peatlands. The total oil palm concession area on peatlands is 28,009 km2 (2.8 million hectares), the total timber concession area 19,923 km2 (2 million hectares). Both concession types are
concentrated in Sumatra and Kalimantan, with only a small oil palm concession area in Papua. Oil palm plantation concessions cover 14% of the total peatland area, oil palm + timber plantation concessions 23% (Table 2). This is not including state-owned and co-operative plantations, other (not BHP or HTI) agricultural developments (e.g. the Mega Rice Project in Central Kalimantan) and drainage schemes for logging purposes (legal and illegal). In addition to the plantation concessions, 12% of peatlands is earmarked as logging concession (HPH).
There are indications that the concession data are not very accurate: overlays between 2 or even 3 concession types are found in some areas. Also, it should be noted that these concession data represent only part of the total current + planned oil palm and timber plantations; co-operative plantations and state plantations appear not to be included. It is concluded that the concession data provide a useful estimate of the planned area of timber and oil palm plantations on peatlands, but better data are needed.
gambut. Umumnya saluran-saluran tersebut tidak sedalam di perkebunan, dapat menyebabkan emisi CO2 yang lebih sedikit kecuali jika disertai dengan kebakaran, tetapi emisi total tetap signifikan karena luasan yang digunakan biasanya sangat luas sekali.
Tidak ada data konsesi tersedia untuk Malaysia dan Papua Nugini. Data konsesi untuk lokasi-lokasi utama lahan gambut di Indonesia (Sumatra, Kalimantan dan Papua) disediakan oleh World Resources Institute, yang digunakan untuk menentukan berbagai daerah yang direncanakan atau potensial dari berbagai tipe tata guna lahan di lahan gambut (Tabel 4). Dtaa tersebut mencakup baik pengembangan yang ada saat ini maupun yang direncanakan.
Sesuai dengan data konsesi yang tersedia, 27% dari praktek hutan industri maupun perkebunan kelapa sawit di Indonesia berada di lahan gambut. Total luasan perkebunan kelapa sawit di lahan gambut adalah seluas 28.009 km2 (2,8 juta hektar),
sedangkan total luas Hutan Tanaman Industri adalah 19.923 km2 (2 juta hektar). Kedua konsesi
terkonsentrasi lokasinya di Sumatra dan Kalimantan, sedangkan di Papua hanya sedikit sekali terdapat perkebunan kelapa sawit. Konsesi perkebunan kelapa sawit meliputi 14% dari total luasan lahan gambut, konsesi perkebunan kelapa sawit + hutan tanaman industri mencakup 23% (Tabel 2). Angka diatas tidak termasuk perkebunan milik pemerintah dan koperasi, pengembang
pertanian lain (non BHP atau HTI, misalnya Proyek PLG di Kalimantan Tengah) dan skema drainase untuk kegiatan penebangan kayu (legal dan ilegal). Selain dijadikan konsesi perkebunan, 12% dari lahan gambut telah ditandai sebagai konsesi kayu tebangan (HPH).
Ada beberapa indikasi yang mengisyaratkan bahwa data konsesi tersebut tidak terlalu akurat; tumpang tindih antara 2 atau bahkan 3 konsesi ditemukan di beberapa daerah. Patut pula diketahui bahwa data konsesi ini hanya mewakili sebagian dari total perkebunan kelapa sawit saat ini + yang
direncanakan; perkebunan milik pemerintah dan koperasi nampaknya belum disertakan. Memang dapat disimpulkan bahwa data konsesi menyediakan suatu perkiraan yang berguna bagi daerah-daerah lahan gambut yang direncanakan untuk
With the concession data available it is not possible to precisely determine the current areas of these land uses. However until better data are available we can only assume that the percentage of oil palm and timber plantations currently on peatlands is similar to the planned percentages. We therefore assume that some 25% of current oil palm and timber plantations are on peatlands. The current percentage in Indonesia may be higher: tentative inspection of satellite images of the Province of Riau indicates that at least 50%, and probably more than 75% of the 800,000 ha of oil palm concession in that Province Figure 10) is already
developed. Assuming 75% is developed, these 600,000 hectares of existing oil palm plantations alone represent 15-20% of the present total palm plantation area in the country (3.5 to 4 million hectares according to most estimates).
An interesting assessment of the expected rate of development of oil palm plantations is provided in a report by the Indonesian Ministry of Forestry in co-operation with the European Union (Sargeant, 2001): “The world demand for palm oil is forecast to increase from its present 20.2 million tonnes a year to 40 million tonnes in 2020. If this demand is to be met, 300 000 ha of new estates will need to be planted in each of the next 20 years. We predict that by far the largest slice of this new land will come from within Indonesia where labour and land remain plentiful. And we expect that Sumatra, with its relatively well-developed infrastructure and nucleus of skilled labour, will absorb 1.6 million hectares of this expansion. It is inevitable that most new oil palm will be in the wetlands, as the more ‘desirable’ dry lands of the island are now occupied. We expect that of the new areas, half will be developed by estates and half by smallholders” There are two important aspects to this assessment:
Dengan keterbatasan data konsesi yang tersedia, belum memungkinkan untuk secara tepat menentukan luasan saat ini dari berbagai tata guna lahan ini. Namun demikian, sampai dimilikinya data yang lebih baik, dapat diasumsikan bahwa persentasi wilyah perkebunan kelapa sawit dan hutan tanaman di lahan gambut saat ini sama dengan yang telah direncanakan. Oleh karena itu kami mengasumsikan bahwa sekitar 25% kebun kelapa sawit dan hutan tanaman berada di lahan gambut. Persentasi sebenarnya di Indonesia mungkin lebih besar: analisa sementara dari citra satelit di Propinsi Riau menunjukkan bahwa setidaknya 50%, dan kemungkinan lebih 75% dari 800.000 hektar konsesi kelapa sawit di propinsi tersebut sudah dikembangkan (Gambar 7). Dengan asumsi 75% telah dikembangkan, berarti sama dengan 600.000 hektar yang telah ada di propinsi ini merepresentasikan 15 -20% dari total seluruh perkebunan kelapa sawit di Indonesia (seluas 3,5 sampai dengan 4 juta hektar menurut sebagian besar perkiraan).
Suatu kajian menarik tentang harapan laju
pengembangan kebun kelapa sawit disajikan dalam sebuah laporan Departemen Kehutanan Republik Indonesia yang bekerja sama dengan Uni-Eropa (Sargeant, 2001): “Kebutuhan dunia akan minyak kelapa sawit diperkirakan akan meningkat dari saat ini sebesar 20.2 juta ton per tahun menjadi 40 juta ton pada tahun 2020. Apabila kebutuhan ini akan dipenuhi, maka harus dikembangkan perkebunan baru seluas 300.000 hektar setiap tahunnya selama 20 tahun mendatang. Kami menduga bahwa lahan yang akan dikembangkan tersebut akan dibuka di berbagai daerah Indonesia dimana tenaga kerja dan ketersediaan lahan masih tersedia. Dan kami menduga bahwa Sumatra, dengan infrastrukturnya yang yang telah dibangun dengan baik dan potensi tenaga ahli yang ada, akan menyerap 1,6 juta hektar dari
pengembangan ini. Tidak dapat dielakkan bahwa hampir seluruh perkebunan sawit baru akan dikembangkan di lahan basah,
dikarenakan lahan-lahan kering yang sebenarnya lebih diharapkan, telah terlebih dahulu dikuasai. Kami perkirakan bahwa perkebunan-perkebunan baru ini akan dikembangkan sebagian oleh swasta dan
sebagian lagi oleh UKM.” Ada dua aspek penting
1. It suggests that over 50% of oil palm plantations, at least in Sumatra (but similar considerations apply in parts of Kalimantan), will be developed on peatlands. This is more than is suggested by concession data available to the study.
2. It suggests that half of the plantations will be developed by smallholders, which may not be represented in the concession data.
As projections for global oil palm demand have been rising in recent years, with biofuel as an increasingly important use, the
assessment above should probably be considered conservative at present (5 years later). It is concluded that a figure of 25% oil palm plantations may be a realistic estimate for current conditions, but is a conservative estimate for future conditions.
1. Mengisyaratkan bahwa lebih dari 50% perkebunan sawit, setidaknya di Sumatra (mungkin juga berlaku untuk Kalimantan), akan dikembangkan di lahan gambut. Persentasi ini lebih besar dari pada persentasi yang ditunjukkan dari data konsesi yang tersedia untuk studi ini.
2. Sebagian dari perkebunan ini akan dibangun oleh UKM, yang kemungkinan tidak terwakili dalam data konsesi.
Oleh karena proyeksi kebutuhan minyak kelapa sawit global telah meningkat pada tahun-tahun belakangan ini, dimana bahan bakar nabati makin meningkat penggunaannya, kajian diatas
sebaiknya dianggap konservatif untuk saat ini (5 tahun atau lebih). Dapat disimpulkan bahwa angka perkebunan kelapa sawit sebesar 25% adalah perkiraan realistis untuk saat ini, tetapi perkiraan konservatif untuk kondisi mendatang.
Table 4 Concessions on peatland in Indonesia.
Concessions in Indonesia
Lowland
Kalimantan 124217 4451 27274 3104 50255 14725
Sumatra 23601 6295 33544 11827 49513 12494
Papua 95902 13686 14036 4992 3610 790
Total Kal + Sum + Pap 243720 24432 74854 19923 103378 28009 178232 47932
as a percentage of total plantation area
Kalimantan 4 11 29
Sumatra 27 35 25
Papua 14 36 22
Data sources: World Resources Institute / Global Forest Watch (concession areas) Wetlands International (peatland Kalimantan, Sumatra)
FAO / ISRIC (peatland Irian Jaya)
~'total' area is total area of Province (or Region/Country); 'lowland peat' area is peat area under 300m within that Province
PEAT-CO2 / Delft Hydraulics
Su m
atra
Kalimantan
Sara wak
Papua
Indonesia Malaysia
Papua New Guinea
Concessions, Indonesia logging (HPH)
timber plantation (HTI) oil palm plantation (BHP)
Source: World Resources Institute (Global Forest Watch)
0 500 1000 2000
Kilometres
Figure 9 Concessions in Indonesia (Source: World Resources Institute / Global Forest Watch).
Figure 10 Plantation concessions (i.e. planned and existing plantations) on peatlands in the Province of Riau (Sumatra). Based on concession data provided by the Riau Plantation Service (2004). According to these data, 37.7% (801,555 ha) of existing plus planned oil palm plantations in Riau are located on peat lands. Logging concessions (HPHs) are not shown but cover much of the area marked as ‘remaining forest outside concessions). It should be noted that the data provided by the Riau Plantation Service are
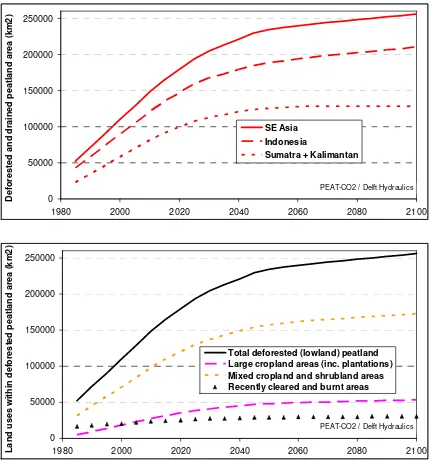
3.2.4 Result: land use projections for SE Asian peatlands
Projections of deforestation rate were developed by simply continuing the rate of forest loss between 1985 and 2000 into the future, until all peatland is fully deforested, per Province (Indonesia) or country. The numbers were then added up to derive overall deforestation projections for larger
geographic units, as shown in Figure 11.
Predicting future land use developments by projecting past trends is a crude simplification of actual developments of course, but it can be argued in this case that it is realistic, even conservative in some respects, to assume current rates of deforestation and drainage to continue:
• Deforestation rates have continued at a constant rate (on average) for 20 years, as indicated by comparison between deforestation rates over 1985-2000 and over 2000-2005.
• The rate of deforestation in peatlands was shown to be almost twice that in non-peatlands. With non-peatland lowland areas being largely deforested in most of Indonesia, the remaining forested peatlands and mountain ranges are increasingly important sources of timber. Of these, peatlands are the more attractive as they are more easily accessible and are seen to allow agricultural development.
• No policy has been implemented to specifically conserve and protect peatlands forests. The Indonesian Presidential Decree No. 32/1990, stipulates that peat areas deeper than 3 meters should not be developed, but this decree has generally not been enforced. Moreover, this policy warrants review as it would allow reclamation and drainage of the outer zone of a
3.2.4 Hasil: proyeksi tata guna lahan
untuk lahan gambut Asia Tenggara.
Proyeksi laju deforestasi dikembangkan dengan meneruskan laju kehilangan hutan antara tahun 1985 dan 2000 ke masa mendatang, sampai seluruh lahan gambut telah terdeforestasi seluruhnya, per propinsi (Indonesia) atau per negara. Angka-angka yang diperoleh kemudian dijumlah untuk
mendapatkan proyeksi deforestasi keseluruhan untuk unit geografis yang lebih luas, seperti yang disajikan dalam Gambar 8.
Menduga penggunaan lahan dimasa mendatang dengan cara memproyeksikan kecenderungan di masa lalu tentu saja adalah suatu penyederhanaan kasar dari arah pengembangan yang sebenarnya, meskipun demikian untuk kasus ini dapat di katakan bahwa hal ini tetaplah realistik, bahkan dalam beberapa hal dapat dikatakan cukup konservatif, untuk mengasumsikan laju deforestasi dan drainase yang saat ini terus berlangsung:
• Laju deforestasi terus berlanjut dengan
laju yang konstan (rata-ratanya) selama 20 tahun, sebagaimana diindikasikan oleh perbandingan antara laju deforestari 1985-2000 dan 1985-2000-2005.
• Laju deforestasi di lahan gambut
menunjukkan angka hampir dua kali lipat dibandingkan dengan di lahan non-gambut. Berhubung wilayah dataran rendah non-gambut telah mengalami deforestasi secara luas di hampir seluruh wilayah Indonesia, maka hutan gambut dan daerah pengunungan menjadi sumber daya kayu yang semakin penting. Oleh karena itu, lahan gambut akan lebih aktraktif karena lebih mudah diakses dan berpontensi untuk dikembangkan menjadi lahan pertanian.
• Tidak ada kebijakan yang dikembangkan
peat dome with a depth of less than 3 meters. This would lead to subsidence of the deeper parts of the dome, a process that could continue until the entire dome would be lower than 3 meters and thus “eligible” for reclamation (Silvius & Suryadiputra, 2005).
• The area of gazetted conservation reserves in peatlands is unclear but is estimated at less than 10 or even 5% of the total peatland area. Moreover, all peatland conservation areas in western Indonesia are being subject to degradation from logging, drainage and fires (e.g. Berbak and Sembilang National Parks in Sumatra, Tanjung Putting and Sebangau National Parks in Central Kalimantan). Almost all remaining peat swamp forests in Malaysia have been subject to degradation from logging and often also drainage.
As noted earlier (Section 3.2.2), the current baseline and projection method limit the area of large intensively drained croplands
(including plantations) to 21% of the peatland area after deforestation is completed. We also found that the concession area of timber and oil palm plantations alone covers 23% of peatlands in Indonesia, and that additional plantations outside these concessions exist and more are planned. The projected cropland area should thus be considered conservative.
luar kubah gambut yang memiliki kedalaman kurang dari 3 meter. Padahal kegiatan ini akan dapat menyebabkan terjadinya subsiden pada bagian gambut dalam di kubahnya, suatu proses yang akan terus berlangusng hingga keseluruhan kubah akan lebih rendah dari 3 meter sehingga akhirnya “layak” untuk direklamasi. (Silvius & Suryadiputra, 2005).
• Daerah yang dicanangkan sebagai daerah
konservasi di lahan gambut masih belum jelas tetapi diperkirakan jumlahnya kurang dari 10% atau bahkan hanya 5% dari keseluruhan luas lahan gambut. Lebih jauh lagi, seluruh kawasan perlindungan gambut di Indonesia bagian barat sedang mengalami degradasi akibat penebangan, drainase dan kebakaran (misalnya Taman Nasional Sembilang dan Taman Nasional Berbak di Sumatra, Taman Nasional Tanjung Puting dan Taman Nasional Sebangau di Kalimantan Tengah). Hampir seluruh hutan rawa gambut yang tersisa di Malaysia sudah mengalami degradasi dari penebangan dan juga drainase.
Seperti yang telah dicatat sebelumnya (bagian 3.2.2), data dasar dan metode proyeksi saat ini membatasi luasan lahan tanaman yang luas dan didrainase secara intensif (termasuk perkebunan) menjadi 21% dari luasan lahan gambut setelah deforestasi
berhenti. Kami juga menemukan bahwa luasan konsesi perkebunan sawit dan hutan tanaman sendiri mencakup 23% dari lahan gambut di Indonesia, dan masih ada banyak perkebunan yang ada di luar konsesi ini dan masih banyak pula yang
0 50000 100000 150000 200000 250000
1980 2000 2020 2040 2060 2080 2100
D
e
fo
re
s
ted a
nd dr
a
ine
d pea
tl
a
nd
ar
e
a
(
k
m
2
)
SE Asia Indonesia
Sumatra + Kalimantan
PEAT-CO2 / Delft Hydraulics
0 50000 100000 150000 200000 250000
1980 2000 2020 2040 2060 2080 2100
L
a
n
d
u
ses w
it
h
in
d
ef
o
rest
ed
p
eat
lan
d
ar
e
a (
k
m
2
)
Total deforested (lowland) peatland Large cropland areas (inc. plantations) Mixed cropland and shrubland areas Recently cleared and burnt areas
PEAT-CO2 / Delft Hydraulics
Figure 11 Current trends and future projections of deforestation in lowland peatlands in SE Asia.