Hasil Univariat
Umur Responden
Frequency
Percent
Valid Percent
Cumulative Percent
Valid
< 45
32
76,2
76,2
76,2
> 45
10
23,8
23,8
100,0
Total
42
100,0
100,0
Pendidikan Terakhir Responden
Frequency
Percent
Valid Percent
Cumulative Percent
Valid
SD
8
19,0
19,0
19,0
SLTP
9
21,4
21,4
40,5
SLTA
25
59,5
59,5
100,0
Total
42
100,0
100,0
Status Perkawinan Responden
Frequency
Percent
Valid Percent
Cumulative
Percent
Valid
KAWIN
25
59,5
59,5
59,5
BELUM KAWIN
17
40,5
40,5
100,0
Total
42
100,0
100,0
Frequency
Percent
Valid Percent
Jenis Pekerjaan yang dilakukan responden
Frequency
Percent
Valid Percent
Cumulative
Jenis Tugas Kategorik
Frequency
Percent
Valid Percent
Cumulative
Percent
Valid
STANDAR
20
47,6
47,6
47,6
Jenis Tugas Kategorik
Frequency
Percent
Valid Percent
Cumulative
Percent
Valid
STANDAR
20
47,6
47,6
47,6
MELEBIHI
22
52,4
52,4
100,0
Total
42
100,0
100,0
Tingkat Kelelahan Kategorik
Frequency
Percent
Valid Percent
Cumulative
Percent
Valid
LELAH
15
35,7
35,7
35,7
SANGAT LELAH
27
64,3
64,3
100,0
Hasil Bivariat
Case Processing Summary
Cases
Valid Missing Total
N Percent N Percent N Percent
tingkat kelelahan kategorik * jenis tugas kategorik
42 100,0% 0 ,0% 42 100,0%
tingkat kelelahan kategorik * waktu lembur kategorik
42 100,0% 0 ,0% 42 100,0%
tingkat kelelahan kategorik * jenis tugas kategori
Crosstab
jenis tugas kategorik
STANDAR MELEBIHI
tingkat kelelahan kategorik LELAH Count 11 4
% within tingkat kelelahan kategorik
73,3% 26,7%
% within jenis tugas kategorik
55,0% 18,2%
LELAH % within tingkat kelelahan kategorik
33,3% 66,7%
% within jenis tugas kategorik
45,0% 81,8%
Total Count 20 22
% within tingkat kelelahan kategorik
47,6% 52,4%
% within jenis tugas kategorik
100,0% 100,0%
Crosstab
Total
tingkat kelelahan kategorik LELAH Count 15
% within tingkat kelelahan kategorik
100,0%
% within jenis tugas kategorik 35,7%
SANGAT LELAH Count 27
% within tingkat kelelahan kategorik
100,0%
% within jenis tugas kategorik 64,3%
Total Count 42
% within tingkat kelelahan kategorik
100,0%
Chi-Square Tests
Value df
Asymp. Sig. (2-sided)
Exact Sig. (2-sided)
Exact Sig. (1-sided)
Pearson Chi-Square 6,185a 1 ,013 Continuity Correctionb 4,686 1 ,030
Likelihood Ratio 6,360 1 ,012
a. 0 cells (,0%) have expected count less than 5. The minimum expected count is 7,14. b. Computed only for a 2x2 table
tingkat kelelahan kategorik * waktu lembur kategorik
Crosstab
waktu lembur kategorik
< 3 jam/hari > 3 jam/hari
tingkat kelelahan kategorik
LELAH Count 13 2
% within tingkat kelelahan kategorik
86,7% 13,3%
% within waktu lembur kategorik
54,2% 11,1%
LELAH % within tingkat kelelahan kategorik
40,7% 59,3%
% within waktu lembur kategorik
45,8% 88,9%
Total Count 24 18
% within tingkat kelelahan kategorik
57,1% 42,9%
% within waktu lembur kategorik
100,0% 100,0%
Crosstab
Total
tingkat kelelahan kategorik LELAH Count 15
% within tingkat kelelahan kategorik
100,0%
% within waktu lembur kategorik
35,7%
SANGAT LELAH Count 27
% within tingkat kelelahan kategorik
100,0%
% within waktu lembur kategorik
64,3%
Total Count 42
% within tingkat kelelahan kategorik
Crosstab
Total
tingkat kelelahan kategorik LELAH Count 15
% within tingkat kelelahan kategorik
100,0%
% within waktu lembur kategorik
35,7%
SANGAT LELAH Count 27
% within tingkat kelelahan kategorik
100,0%
% within waktu lembur kategorik
64,3%
Total Count 42
% within tingkat kelelahan kategorik
100,0%
% within waktu lembur kategorik
100,0%
Chi-Square Tests
Value df
Asymp. Sig. (2-sided)
Exact Sig. (2-sided)
Exact Sig. (1-sided)
Likelihood Ratio 9,085 1 ,003
a. 0 cells (,0%) have expected count less than 5. The minimum expected count is 6,43. b. Computed only for a 2x2 table
jenis pekerjaan * tingkat kelelahan kategorik Crosstabulation
tingkat kelelahan kategorik
Total
LELAH SANGAT LELAH
jenis pekerjaan PEMBESIAN Count 8 4 12
% within jenis pekerjaan 66.7% 33.3% 100.0%
% within tingkat kelelahan kategorik
53.3% 14.8% 28.6%
% of Total 19.0% 9.5% 28.6%
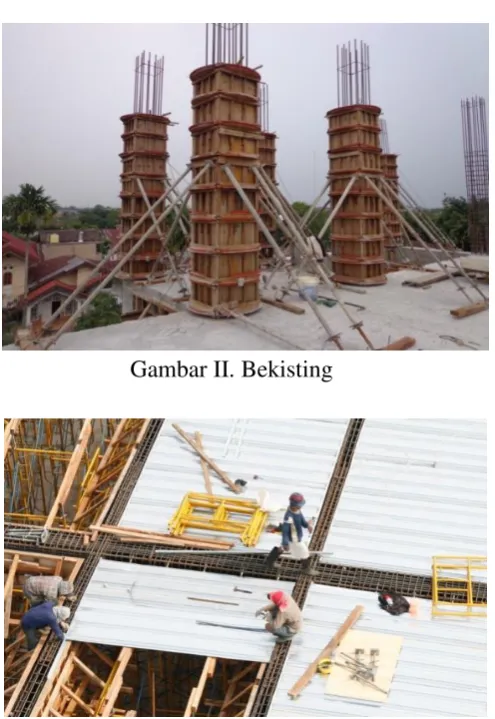
BEKISTING Count 5 9 14
% within jenis pekerjaan 35.7% 64.3% 100.0%
% within tingkat kelelahan kategorik
33.3% 33.3% 33.3%
% of Total 11.9% 21.4% 33.3%
COR Count 2 14 16
% within tingkat kelelahan kategorik
13.3% 51.9% 38.1%
% of Total 4.8% 33.3% 38.1%
Total Count 15 27 42
% within jenis pekerjaan 35.7% 64.3% 100.0%
% within tingkat kelelahan kategorik
100.0% 100.0% 100.0%
% of Total 35.7% 64.3% 100.0%
Chi-Square Tests
Value df Asymp. Sig. (2-sided)
Pearson Chi-Square 8.763a 2 .013
Likelihood Ratio 9.165 2 .010
Linear-by-Linear Association 8.495 1 .004
N of Valid Cases 42
Hasil Multivariat
Case Processing Summary
Unweighted Casesa N Percent
Selected Cases Included in Analysis 42 100,0
Missing Cases 0 ,0
Total 42 100,0
Unselected Cases 0 ,0
Total 42 100,0
a. If weight is in effect, see classification table for the total number of cases.
Dependent Variable Encoding
Original Value Internal Value
Lelah 0
Sangat lelah 1
Block 0: Beginning Block
Classification Tablea,b
Observed
Predicted tingkat kelelahan kategorik
Percentage
Classification Tablea,b
Observed
Predicted tingkat kelelahan kategorik
Percentage
Overall Percentage 64,3
a. Constant is included in the model. b. The cut value is ,500
Variables in the Equation
B S.E. Wald df Sig. Exp(B)
Step 0 Constant ,588 ,322 3,332 1 ,068 1,800
Variables not in the Equation
Score df Sig.
Step 0 Variables JTK 6,185 1 ,013
WKLKAT 8,305 1 ,004
Overall Statistics 9,038 2 ,011
Block 1: Method = Backward Stepwise (Likelihood Ratio
Omnibus Tests of Model Coefficients
Step 1 Step 9,885 2 ,007
a. A negative Chi-squares value indicates that the Chi-squares value has decreased from the previous step.
Model Summary
Step -2 Log likelihood Cox & Snell R Square Nagelkerke R Square
1 44,862a ,210 ,288
2 45,662a ,195 ,267
a. Estimation terminated at iteration number 5 because parameter estimates changed by less than ,001.
Classification Tablea
Observed
Predicted tingkat kelelahan kategorik
Percentage Correct LELAH
SANGAT LELAH Step 1 tingkat kelelahan
kategorik
LELAH 11 4 73,3
SANGAT LELAH 7 20 74,1
Step 2 tingkat kelelahan kategorik
LELAH 13 2 86,7
SANGAT LELAH 11 16 59,3
Overall Percentage 69,0
a. The cut value is ,500
Variables in the Equation
B S.E. Wald df Sig. Exp(B)
Variables in the Equation
a. Variable(s) entered on step 1: JTK, WKLKAT.
Model if Term Removed
Variable Model Log Likelihood
Change in -2 Log
Likelihood df Sig. of the Change
Step 1 -22,831 ,800 1 ,371
WKLKAT -24,194 3,525 1 ,060
Step 2 WKLKAT -27,374 9,085 1 ,003
Variables not in the Equation
Score df Sig.
Step 2a Variables JTK ,817 1 ,366
Overall Statistics ,817 1 ,366