International Accounting Standards and Accounting Quality
Mary E. Barth* Graduate School of Business
Stanford University
Wayne R. Landsman and Mark H. Lang Kenan-Flagler Business School
University of North Carolina
March 2006
* Corresponding author: Graduate School of Business, Stanford University, 94305-5015,
[email protected]. We appreciate helpful comments from Ole-Kristian Hope, Steve Young, T.J. Wong, Ray Ball (editor), an anonymous referee, workshop participants at Southern
Methodist University, the 2005 Pennsylvania State University Accounting Research Conference, and the 2005 Joint Journal of Accounting Research-London Business School Conference on International Financial Reporting Standards, research assistance of Yang Gui, Yaniv
International Accounting Standards and Accounting Quality
Abstract
We compare characteristics of accounting amounts for firms that apply International Accounting Standards (IAS) to a matched sample of firms that do not to investigate whether applying IAS is associated with higher accounting quality and lower equity cost of capital. We find that firms applying IAS evidence less earnings management, more timely loss recognition, and more value relevance of accounting amounts than do those applying domestic GAAP. Firms applying IAS have higher variance of the change in net income, a higher ratio of the variances of the change in net income and change in cash flows, a significantly less negative correlation between accruals and cash flows, and a lower frequency of small positive net income. They have a significantly higher frequency of large negative net income and generally higher value relevance of
accounting amounts. Differences between firms applying IAS and those applying domestic GAAP in the period before IAS firms adopt IAS do not explain the differences in accounting quality. Firms applying IAS generally exhibit higher accounting quality than when they previously applied domestic GAAP. The increase in accounting quality for IAS firms is
1.
Introduction
We assess characteristics of accounting amounts resulting from application of
International Accounting Standards (IAS) to determine whether reporting under IAS is
associated with higher accounting quality and lower cost of capital. In particular, we investigate
whether applying IAS is associated with less earnings management, more timely loss
recognition, higher value relevance of accounting amounts, and a lower cost of capital than
applying domestic Generally Accepted Accounting Principles (GAAP). We first compare
characteristics of accounting amounts for firms that apply IAS and a matched sample of firms
that do not in the period after the IAS firms adopt IAS. Our results suggest that firms that apply
IAS have higher accounting quality than firms that do not. We next determine whether IAS
firms increase accounting quality after applying IAS. Our results suggest that applying IAS is
associated with improvement in accounting quality. Firms that do not apply IAS do not exhibit
such improvements to the same extent over the same period. Results from analogous
comparisons for equity cost of capital suggest consistent, although weaker, inferences, i.e.,
applying IAS may be associated with lower cost of capital. In light of the impending changes to
IAS promulgated by the International Accounting Standards Board (IASB), our findings support
the prospect of improvement in financial reporting as more countries and firms adopt
international accounting standards.1
A primary goal of the IASB is to develop, “in the public interest, a single set of high
quality, understandable and enforceable global accounting standards that require transparent and
1
comparable information in general purpose financial statements.”2 In this regard, the IASB has
taken steps to remove allowable alternative accounting practices, and to require accounting
measurements that better reflect a firm’s economic position and performance. The IASB
believes both of these actions should increase accounting quality. Accounting quality could
increase if removing alternatives and increasing the extent to which accounting measurements
reflect economic position limit management’s discretion to report accounting amounts that are
less reflective of the firm’s economic position and performance, e.g., by managing earnings.
Thus, we predict that accounting amounts determined in accordance with IAS are of higher
quality than those determined in accordance with firms’ domestic GAAP. However, because a
firm’s regulatory, enforcement, and attestation environment also affects accounting quality (Ball,
Robin, and Wu, 2003), whether application of IAS results in higher quality accounting amounts
is an open empirical question.
We interpret earnings that exhibit less earnings management as being of higher quality.
Following prior research, our metrics of earnings management are based on the variance of the
change in net income, the ratio of the variance of the change in net income to the variance of the
change in cash flows, the correlation between accruals and cash flows, and the frequency of
small positive net income. We interpret higher variance of the change in net income, higher ratio
of the variances of the change in net income and change in cash flows, less negative correlation
between accruals and cash flows, and a lower frequency of small positive net income as evidence
of less earnings management. When developing our metrics, we include controls for factors that
prior research identifies as being associated with firms’ decisions to adopt IAS to mitigate the
effects of self-selection.
2
We also interpret earnings that reflect losses on a more timely basis as being of higher
quality. Our metric is the frequency of large negative net income, after controlling for potential
confounding factors. We interpret a higher frequency of large negative net income as evidence
of more timely loss recognition. Finally, we interpret accounting amounts that are more value
relevant as being of higher quality. Our metrics for value relevance are the explanatory powers
of income and equity book value for prices, and stock return for earnings. We interpret higher
explanatory power as evidence of more value relevance.
Finally, we provide evidence on the relation between application of IAS and firms’ equity
cost of capital. Standard setters view cost of capital reduction as an anticipated benefit of
applying IAS.3 If firms applying IAS have higher quality accounting amounts and there is a link
between accounting quality and equity cost of capital, then firms applying IAS will enjoy a lower
cost of capital. We estimate equity cost of capital based on the three-factor model of Fama and
French (1993).
We find that in the period following adoption of IAS, i.e., the post-adoption period, firms
applying IAS evidence less earnings management, more timely loss recognition, and more value
relevance of accounting amounts than do firms not applying IAS. In particular, firms applying
IAS have a higher variance of the change in net income, a higher ratio of the variances of change
in net income and change in cash flow, a significantly less negative correlation between accruals
and cash flows, and a lower frequency of small positive net income. In addition, they have a
significantly higher frequency of large negative net income, significantly higher value relevance
3
For example, in discussing adoption of IFRS, Bob Herz, chairman of the FASB notes, “It’s about lowering the cost of capital, lowering the cost of preparation and lowering the cost of using information”
of earnings and equity book value for share prices, and higher value relevance of earnings for
good news stock returns.
Differences in our accounting quality metrics between firms applying IAS and firms that
do not in the period before adoption by the firms that apply IAS, i.e., the pre-adoption period, do
not explain the differences in the post-adoption period. In the pre-adoption period, quality
metrics for firms that later apply IAS generally either insignificantly differ from those for firms
that do not apply IAS or are consistent with lower quality. In addition, firms applying IAS
generally exhibit higher accounting quality in the post-adoption period than they do in the
pre-adoption period. Moreover, their increase in accounting quality is generally greater than that for
firms that do not apply IAS, indicating that the increase in quality for firms applying IAS is not
attributable to economy-wide changes between the pre- and post-adoption periods. Consistent
with these findings relating to accounting quality, we also find weak supportive evidence that
application of IAS is associated with a lower cost of equity capital.
There is little large-sample empirical evidence on whether applying IAS improves
accounting quality. In contrast to prior research, we use a broad sample of firms in 23 countries
that adopted IAS between 1994 and 2003. Prior research typically focuses on particular
countries, e.g., China and Germany, and uses data from more limited time periods. There are
advantages and disadvantages associated with focusing on particular countries and using shorter
time periods relative to using more expansive sampling criteria. For example, focusing on a
particular country removes the need to control for potentially confounding effects of
country-specific factors. However, doing so makes it difficult to extrapolate to other countries inferences
Existing evidence comparing the quality of accounting amounts based on applying IAS
and domestic GAAP is mixed. This lack of consensus could be because such studies often use
different metrics to compare accounting quality (e.g., value relevance or earnings smoothing),
draw data from somewhat different time periods, and use different control variables. In contrast,
we use an array of metrics drawn from a common time period and use a common set of control
variables. Using a more expansive sample and an array of metrics consistently derived permits
us to draw more general and reliable inferences about whether applying IAS is associated with
higher accounting quality.
The remainder of our paper is organized as follows. The next section develops our
hypotheses. Section three explains our research design. Section four describes our sample and
data. Sections five and six present our results relating to accounting quality and equity cost of
capital. Section seven offers our summary and concluding remarks.
2.
Hypothesis Development
2.1 IAS AND ACCOUNTING QUALITY
The first IAS was published in 1975 by the International Accounting Standards
Committee (IASC), which was formed in 1973. Since then, the process for setting international
accounting standards has undergone substantial evolution, culminating in the 2001 restructuring
of the IASC into the IASB. As of January 1, 2005, all publicly listed companies in the European
Union are required to prepare financial statements in accordance with International Financial
Reporting Standards (IFRS), and the International Organization of Securities Commissions
cross-border offerings.4 In addition, the Financial Accounting Standards Board has embarked on a
comprehensive project aimed at convergence between IFRS and US GAAP.
Continuing the work of the IASC, a primary goal of IASB is to develop a single set of
high quality, global accounting standards that are accepted worldwide for general purpose
financial statements. To achieve this goal, the IASB limits allowable alternative accounting
practices and provides a consistent approach to accounting measurement for the purpose of
having a firm’s recognized amounts faithfully represent its underlying economics. The IASB
believes that limiting alternatives increases accounting quality because it limits management’s
opportunistic discretion in determining accounting amounts. The IASB also believes that
accounting measurement that reflects a firm’s underlying economics increases accounting quality
because it provides investors with information to aid them when making investment decisions.
These two sources of higher accounting quality are related in that, all else equal, limiting
opportunistic discretion by managers increases the extent to which the accounting amounts
reflect a firm’s underlying economics. Consistent with this line of reasoning, Ewert and
Wagenhofer (2005) develops a rational expectations model that shows that accounting standards
that limit opportunistic discretion result in accounting earnings that are more reflective of a
firm’s underlying economics and, therefore, are of higher quality. Thus, we predict that
accounting amounts determined in accordance with IAS are of higher quality than those
determined in accordance with firms’ domestic GAAP.5
4
IFRS are the standards issued by the IASB. They include standards issued by the current standard setting body (the IASB) and standards issued by its predecessor (the IASC), some of which have been amended by the IASB. Because our sample period predates the effective dates of standards issued by the IASB, throughout the paper we refer to our sample firms’ usage of IAS rather than the IFRS currently in place.
5
Although we predict that applying IAS improves accounting quality, the inherent
flexibility IAS principles-based standards afford can allow firms to manage earnings, thereby
decreasing accounting quality. This flexibility has long been a concern of securities markets
regulators (e.g., Breeden, 1994). Even if IAS are high quality accounting standards, Cairns
(1999), Street and Gray (2001), and Ball, Robin, and Wu (2003) suggest that lax enforcement
can result in limited compliance with the standards, thereby limiting their effectiveness. Cairns
(1999) and Street and Gray (2001) find substantial noncompliance with IAS among firms
purportedly applying IAS. In particular, Street and Gray (2001) examines the 1998 financial
statements for 279 firms that refer to application of IAS in their financial statements. The study
examines disclosed accounting policies for consistency with major IAS pronouncements and
finds that, in many cases, disclosed accounting policies are inconsistent with IAS. Ball, Robin,
and Wu (2003) examines timely loss recognition for firms in Hong Kong, Malaysia, Singapore,
and Thailand. In these countries, accounting standards are largely derived from common law
and, therefore, are similar to IAS. Ball, Robin, and Wu (2003) finds that timely loss recognition
for firms in these countries is no better than it is for firms in code law countries. Ball, Robin,
and Wu (2003) attributes this finding to differing incentives of managers and auditors.
Findings in Bradshaw and Miller (2005) suggest that the regulatory and litigation
environment is important to the application of accounting standards. In particular, Bradshaw and
Miller (2005) studies non-US firms that assert that their domestic GAAP accounts are in
accordance with US GAAP. Bradshaw and Miller (2005) finds that, although firms claiming to
comply with US GAAP report accounting data more similar to US firms, the characteristics of
the domestic GAAP accounting amounts often differ from those of US firms. Consistent with
Bradshaw and Miller (2005), findings in Lang, Raedy, and Wilson (2005) suggest that a similar
litigation and regulation environment does not ensure accounting amounts of similar quality. In
particular, Lang, Raedy, and Wilson (2005) examines characteristics of accounting amounts for
firms that cross-list on US markets and finds that cross-listed firms’ US GAAP earnings exhibit
significantly more evidence of earnings management than US firms. Lang, Raedy, and Wilson
(2005) finds this result despite the fact that cross-listed firms are required to use US GAAP and
technically face a regulatoryand litigation environment similar to US firms.
Studies comparing IAS to domestic GAAP accounting amounts in particular countries
report mixed evidence on the quality of IAS relative to domestic GAAP. Comparing IAS and
German GAAP, Van Tendeloo and Vanstraelen (2005) finds that German firms applying IAS do
not exhibit differences in earnings management when compared to firms applying German
GAAP; Daske (2006) finds no evidence of a reduction in cost of capital for German firms that
apply IAS; Hung and Subramanyam (2004) finds that accounting amounts based on IAS
reconciliations and German GAAP do not differ in value relevance. In contrast, Bartov,
Goldberg, and Kim (2004) provides evidence that accounting earnings based on IAS are more
value relevant than those based on German GAAP. Comparing IAS and Chinese GAAP, Eccher
and Healy (2003) finds that accounting amounts based on IAS are not more value relevant than
those based on Chinese GAAP for firms that can be owned by foreign investors. However,
accounting amounts based on IAS are less value relevant than those based on Chinese GAAP for
firms that can only be owned by domestic investors. The authors posit that one reason for the
modest performance of IAS may be the lack of effective controls and infrastructure to monitor
application of IAS. Another possible explanation for the mixed findings in this research is that
accounting in domestic GAAP to avoid reconciling items (Lang, Raedy, and Yetman, 2003).
Consistent with a gradual transition, Hung and Subramanyam (2004) finds relatively few
reconciling items related to earnings management, such as hidden reserves, which is surprising
because the existence of such earnings management items is a common concern with German
GAAP.
Taken together, these studies suggest that whether applying IAS improves accounting
quality is an open question. They also suggest that determining the answer to the question is
complicated by the need to control for the effects of factors beyond accounting standards,
including regulation, enforcement, and attestation that can affect the quality of accounting
amounts. As noted above, findings from studies examining whether application of IAS improves
accounting quality are mixed, which could be attributable to differential effects of these factors.
As described in section three, we develop empirical procedures, including matching sample and
control firms and the use of multiple regression, to mitigate the effects on our inferences of
regulation, enforcement, and attestation.
2.2 MEASURES OF ACCOUNTING QUALITY
Following prior research, we operationalize accounting quality using earnings
management, timely loss recognition, and value relevance metrics. We predict firms with higher
quality earnings exhibit less earnings management, more timely loss recognition, and higher
value relevance of earnings and equity book value.
We examine two manifestations of earnings management, earnings smoothing and
managing towards positive earnings. We expect IAS earnings to be less managed than domestic
GAAP earnings because IAS limit management’s discretion to report earnings that are less
research, we assume that firms with less earnings smoothing exhibit more earnings variability
(Lang, Raedy, and Yetman, 2003; Leuz, Nanda, and Wysocki, 2003; Lang, Raedy, and Wilson,
2005). We predict that firms applying IAS exhibit more variable earnings than those applying
domestic GAAP. Our prediction is supported by two studies. First, Ewert and Wagenhofer
(2005) shows that applying accounting standards that limit management’s discretion should
result in higher variability in accounting earnings. Second, Leuz, Nanda, and Wysocki (2003)
finds that earnings smoothing is less pronounced in common law countries. IAS are based on a
conceptual framework similar to that found in common law countries. To test our prediction, we
use two measures of earnings variability, variability of change in net income and variability of
change in net income relative to variability of change in cash flow.
We also assume that firms with less earnings smoothing exhibit a more negative
correlation between accruals and cash flows (Lang, Raedy, and Yetman, 2003; Leuz, Nanda, and
Wysocki, 2003; Lang, Raedy, and Wilson, 2005). Because accruals reverse over time, accruals
and cash flows are generally negatively correlated. Land and Lang (2002) and Myers and
Skinner (2002), among others, interpret a more negative correlation as indicating earnings
smoothing because managers respond to poor cash flow outcomes by increasing accruals. Thus,
we predict that firms applying IAS exhibit a less negative correlation between accruals and cash
flows than those applying domestic GAAP.
Prior research identifies positive earnings as a common target of earnings management.
Evidence of managing towards positive earnings is a larger frequency of small positive earnings
(Burgstahler and Dichev, 1997; Leuz, Nanda, and Wysocki, 2003). The notion underlying this
We expect that firms applying IAS report small positive earnings with lower frequency than
those applying domestic GAAP.
Regarding timely loss recognition, we expect higher quality earnings exhibit a larger
frequency of large losses. This is consistent with Ball, Kothari, and Robin (2000), Lang, Raedy,
and Yetman (2003), Leuz, Nanda, and Wysocki (2003), and Lang, Raedy, and Wilson (2005)
that suggest that one characteristic of higher quality earnings is that large losses are recognized
as they occur rather than being deferred to future periods. This characteristic is closely related to
earnings smoothing in that if earnings are smoothed, large losses should be relatively rare. Thus,
we predict that firms applying IAS report large losses with higher frequency than those applying
domestic GAAP.
Turning lastly to value relevance, we expect firms with higher quality earnings have a
higher association between stock prices and earnings and equity book value because higher
quality earnings better reflect a firm’s underlying economics (Barth, Beaver, and Landsman,
2001). First, higher quality earnings are the product of applying accounting standards that
require recognition of amounts that are intended to faithfully represent a firm’s underlying
economics. Second, higher quality earnings are less subject to opportunistic managerial
discretion. These two features of higher quality earnings are linked together by Ewert and
Wagenhofer (2005), which shows that accounting standards that limit opportunistic discretion
result in accounting earnings that have higher value relevance. Prior empirical research also
suggests that higher quality earnings are more value relevant (Lang, Raedy, and Yetman, 2003;
that firms applying IAS exhibit higher value relevance of earnings and equity book value than
firms applying domestic GAAP.6
We examine whether firms applying IAS have higher quality earnings (and equity book
value in the value relevance tests) than those applying domestic GAAP by conducting several
tests relating to earnings management, timely loss recognition, and value relevance. We infer
that IAS firms have higher quality earnings based on a consistent pattern of evidence provided
by the portfolio of tests. An advantage of using a portfolio approach is that each test is based on
different assumptions and, therefore, offers evidence that complements the others. For example,
we expect that IAS firms have less discretion to smooth earnings, which should manifest as
higher earnings variability relative to those firms applying domestic GAAP. However, IAS
firms also have less discretion to use earnings management tools that result in higher earnings
variability. One example of such a tool is taking a “big bath” in earnings to take advantage of
features of the manager’s compensation contract (Healy, 1985). Thus, it remains an empirical
question whether IAS firms have greater earnings variability than those applying domestic
GAAP.
However, assuming that investors can see through earnings management, the value
relevance tests provide evidence about earnings quality even if the earnings management tests
are inconclusive. Thus, for example, it is possible that IAS firms have less variable earnings, but
the value relevance tests indicate that IAS firms have higher quality earnings. It also is possible
6
that IAS firms exhibit more variable earnings that the market deems to be of lower quality, as
indicated by the value relevance tests. For example, IAS requires recognition of many financial
instruments at fair value that may be difficult to estimate, which is reflected as noise in earnings.
We would interpret this mixed evidence as being inconclusive regarding earnings quality for IAS
firms.
3.
Research Design
To test our predictions, we first compare firms that apply IAS, “IAS firms,” to a matched
sample of firms that instead only apply domestic GAAP, “NIAS firms,” in the period after the
IAS firms adopt IAS, i.e., in the post-adoption period. This permits us to test whether IAS firms
evidence higher accounting quality than NIAS firms. We predict that they do. However, it is
possible that despite our matching procedure described below, IAS and NIAS firms exhibit
differences in accounting quality in the post-adoption period because they differ before the IAS
firms adopt IAS, i.e., in the pre-adoption period. To determine whether this is the case, we
compare IAS and NIAS firms’ accounting quality in the pre-adoption period.
To assess whether application of IAS is associated with changes in accounting quality,
we next compare accounting quality for IAS firms in the pre-adoption and post-adoption periods.
We predict that IAS firms have higher quality accounting amounts in the post-adoption period
than they do in the pre-adoption period. Finally, findings in Land and Lang (2002) suggest that
accounting quality may be improving worldwide. It also is possible that changes in general
economic factors, including enforcement and attestation, could account for improvement in
accounting quality for IAS firms. To assess whether changes in accounting quality for IAS firms
IAS firms between the pre-adoption and post-adoption periods to those of NIAS firms. We
predict that accounting quality for IAS firms increases more than for NIAS firms.
Consistent with Lang, Raedy, and Yetman (2003) and Lang, Raedy, and Wilson (2005)
but modified to our context, we identify each IAS firm’s country, industry (i.e., three-digit SIC
code) and adoption year. We then identify all firms that have not adopted IAS in any sample
year. We select the non-adopting firm whose equity market value is closest to the IAS firm’s at
the end of its adoption year to serve as the matched NIAS firm. Once a non-adopting firm is
selected as a match, it is not considered as a potential match for other IAS firms. In a few cases,
potential matching firms do not have market value of equity available in the adoption year. In
those cases, we consider market value of equity for the two years before and after the adoption
year.7 Our analyses include all firm-years for which the IAS firm and its matched NIAS firm
both have data. For example, if the IAS firm has data from 1994 through 2000, and its matched
NIAS firm has data for 1995 through 2002, then our analysis includes data from 1995 through
2000 for the IAS firm and its matched NIAS firm.
Similar to studies examining differences between cross-listed and other firms (e.g., Lang,
Raedy, and Yetman, 2003; Lang, Raedy, and Wilson, 2005), it is possible that firms’ decisions to
adopt IAS are associated with underlying firm characteristics that are not controlled by our
matching procedure. Thus, failure to control for a firm’s tendency to adopt IAS can lead to
endogeneity bias when we compare accounting quality differences of firms that apply IAS and
those that do not. Our research design contains two additional features beyond using a matched
sample that mitigate the effects of this endogeneity bias. First, we include controls for factors
7
that could be associated with firms’ IAS adoption decisions, e.g., growth and leverage.8 Second,
we use each firm as its own control when we compare characteristics of IAS firms’ accounting
amounts before and after IAS adoption.
3.1EARNINGS MANAGEMENT
Our first earnings management measure is based on the variability of the change in net
income scaled by total assets, ΔNI (Lang, Raedy, and Wilson, 2005).9 A smaller variance of the change in net income is interpreted as evidence of earnings smoothing. However, net income is
likely to be sensitive to a variety of factors related to firms’ incentives to adopt IAS that are
unrelated to earnings smoothing. Although our matching procedure mitigates the confounding
effects of these factors, some effects may remain. Therefore, our measure of earnings variability
is the variance of the residuals from the regression of change in net income on control variables
identified in prior research (Ashbaugh, 2001; Pagano, Röell, and Zehner, 2002; Lang, Raedy,
and Yetman, 2003; Lang, Raedy, and Wilson, 2005; Tarca, 2005), ΔNI*:
SIZE is the natural logarithm of end of year market value of equity, is percentage
change in sales, is percentage change in common stock, LEV is end of year total
liabilities divided by end of year equity book value, is percentage change in total
liabilities, TURN is sales divided by end of year total assets, CF is annual net cash flow from GROWTH
EISSUE
DISSUE
8
Inferences are not sensitive to the inclusion of the controls. 9
operating activities, AUD is an indicator variable that equals one if the firm’s auditor is PwC,
KPMG, Arthur Andersen, E&Y, or D&T, and zero otherwise, NUMEX is the number of
exchanges on which a firm’s stock is listed, XLIST is an indicator variable that equals one if the
firm is listed on any US stock exchange and WorldScope indicates that the US exchange is not
the firm’s primary exchange, and CLOSE is the percentage of closely held shares of the firm as
reported by WorldScope. Equation (1) also includes country and industry fixed effects, as do
equations (2) through (8).
We estimate equation (1) pooling observations that are relevant to the particular
comparison we test. For example, when comparing IAS and NIAS firms in the post-adoption
period, we pool all sample years in the post-adoption period. For this comparison, the variability
of ΔNI* is the cross-sectional variance of IAS and NIAS firms’ respective residuals from
equation (1) in the post-adoption period. When comparing IAS firms in the post- and
pre-adoption periods, we pool all sample years for IAS firms. For this comparison, the variability of
ΔNI* is the respective cross-sectional variance of residuals for IAS firms in the post- and
pre-adoption periods. We test for differences in these variances using a variance ratio F-test. We
compare the difference in the variability of ΔNI* between the pre- and post-adoption periods for
IAS and NIAS firms as the difference between the resulting measures for IAS and NIAS firms.
Our second measure of earnings smoothing is based on the ratio of the variability of the
change in net income, , to the variability of the change in operating cash flows, .
Firms with more volatile cash flows typically have more volatile net income, and our second
measure controls for this. If firms use accruals to manage earnings, the variability of the change
in net income should be lower than that of operating cash flows. As with NI
Δ ΔCF
NI
Δ , is likely to
be sensitive to a variety of factors related to firms’ incentives to adopt IAS that are unrelated to CF
earnings smoothing. Therefore, we also estimate an equation similar to equation (1), but with
as the dependent variable: CF
As with equation (1), we pool observations appropriate for the particular comparison. The
variability of ΔCF* is the cross-sectional variance of groups of residuals from equation (2),
where the composition of the groups depends on the particular comparison we test. Our resulting
second measure is the ratio of the variability of ΔNI* to variability of ΔCF*. As in Lang, Raedy,
and Wilson (2005), we do not test the differences between IAS and NIAS firms’ ratios of
variances because we are unaware of any statistical test for differences in them.
Our third measure of earnings smoothing is based on the Spearman correlation between
accruals and cash flows. As with the two variability measures based on equations (1) and (2),
because our matching procedure may not eliminate the sensitivity of the accruals and cash flows
correlation to factors unrelated to earnings smoothing, we compare correlations of residuals from
equations (3) and (4), CF* and ACC*, rather than correlations between CF and ACC directly. As
with the equations (1) and (2), both CF and ACC are regressed on the control variables, but
We test for differences in the correlations between CF* and ACC* based on the squared
correlation as derived in Cramer (1987).
Our measure of managing towards positive earnings is the coefficient on small positive
net income, SPOS, in equations (5) and (6). When comparing IAS firms and NIAS firms in the
post-adoption (pre-adoption) period, we estimate equation (5) pooling observations from the
post-adoption (pre-adoption) period.
IAS is an indicator variable that equals one for IAS firms and zero for NIAS firms, and
is an indicator variable that equals one if net income scaled by total assets is between 0
and 0.01 (Lang, Raedy, and Yetman, 2003). A negative coefficient on suggests that
NIAS firms manage earnings toward small positive amounts more frequently than do IAS firms.
We use the coefficient on SPOS from equation (5) rather than directly comparing the IAS and
NIAS firms’ percentages of small positive income to assess whether IAS firms are less likely to
manage earnings because the matching procedure may not eliminate differences in economic
factors associated with firms adopting IAS. SPOS
SPOS
When comparing IAS firms in the post-adoption and pre-adoption periods, we estimate
equation (6) pooling IAS firm observations from all sample years.
it
POST(0,1) is an indicator variable that equals one for observations in the post-adoption period
toward small positive amounts more frequently in the pre-adoption period than they do in the
post-adoption period.10
3.2TIMELY LOSS RECOGNITION
We measure timely loss recognition as the coefficient on the percentage of large negative
net income, LNEG, in equations (7) and (8) (Lang, Raedy, and Yetman, 2003; Lang, Raedy, and
Wilson, 2005). When comparing IAS firms and NIAS firms in the post-adoption (pre-adoption)
period, we estimate equation (7) pooling observations from the post-adoption (pre-adoption)
period.
LNEG is an indicator variable that equals one for observations for which annual net income
scaled by total assets is less than −0.20, and zero otherwise. A positive coefficient on LNEG
suggests that IAS firms recognize large losses more frequently than NIAS firms. As with
equation (5), we use the coefficient on LNEG from equation (7) rather than directly comparing
IAS and NIAS firms’ percentages of large losses to assess whether IAS firms are less likely to
manage earnings.
When comparing IAS firms in the post-adoption and pre-adoption periods, we estimate
equation (8) pooling IAS firm observations from all sample years.
it
A positive coefficient on LNEG suggests that IAS firms recognize large losses more frequently
in the post-adoption period than they do in the pre-adoption period. For SPOS and LNEG, we
test for differences between the SPOS and LNEG coefficients for IAS and NIAS firms based on
equations (6) and (8) by pooling all observations, permitting each variable in the two equations
to differ for IAS and NIAS firms.
3.3VALUE RELEVANCE
The first value relevance measure is based on the explanatory power from a regression of
stock price on earnings and equity book value. To obtain a measure of value relevance that is
unaffected by differences in value relevance across countries and industries, we first regress
stock price, P, on country and industry fixed effects. We regress the residuals from this
regression, P*, on equity book value per share, BVEPS, and net income per share, NIPS,
separately for IAS and NIAS firms in both the post- and pre-adoption periods, i.e., we estimate
four regressions. Following prior research, to ensure accounting information is in the public
domain, we measure P six months after fiscal year-end (Lang, Raedy, and Yetman, 2003; Lang,
Raedy, and Wilson, 2005). Our first value relevance measure is the adjusted R2 from equation
(9).
it it it
it BVEPS NIPS
P* =β0 +β1 +β2 +ε (9)
We test for significance in difference of R2s in all value relevance tests based on the Cramer
(1987) test.
Our second and third value relevance measures are based on the explanatory power from
regressions of net income per share on annual stock return. Ball, Kothari, and Robin (2000)
predicts that accounting quality differences will be most pronounced for “bad news” because
the earnings-returns relation separately for positive and negative return subsamples. Because we
partition firms based on the sign of the return, we estimate two “reverse” regressions with
earnings as the dependent variable, where one is for good news firms and the other is for bad
news firms. As with the first value relevance measure, to obtain good and bad news value
relevance measures that are unaffected by differences in value relevance across countries and
industries, we first regress net income per share, NI/P, on country and industry fixed effects. We
regress the residuals from this regression, NI/P*, on annual stock return, RETURN, the
twelve-month stock return commencing nine twelve-months before fiscal year end and ending three twelve-months
after fiscal year end (Lang, Raedy, and Wilson, 2005). Our second and third value relevance
measures are the R2s from equation (10) estimated for good news and bad news firms.
it it
it RETURN
P
NI/ ]* =β0+β1 +ε
[ (10)
As with equation (9), we estimate equation (10) separately for IAS and NIAS firms in both the
post- and pre-adoption periods.
4. Data
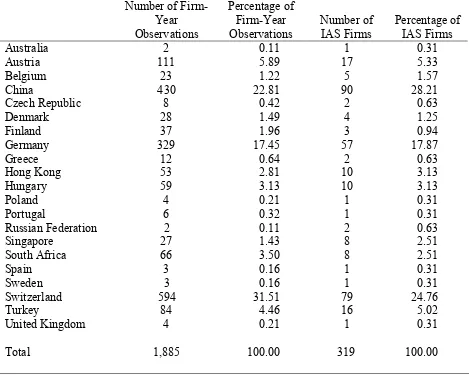
Our sample comprises1,885firm year observations for 319 firms that adopted IAS
between 1994 and 2003 for which DataStream data are available from 1990 through 2003.
Obtaining data beginning in 1990 provides us with a minimum of four years of pre-adoption
period data. We obtain our sample of IAS firms from Worldscope, and gather financial and
accounting data from DataStream. The sample size reflects our having winsorized at the 5%
level all variables used to construct our metrics to mitigate the effects of outliers on our
inferences.
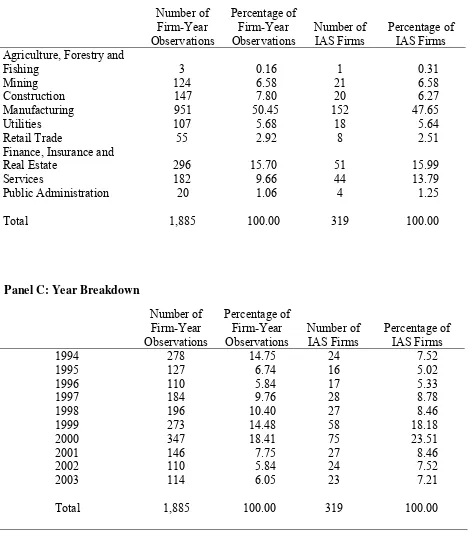
Table 1, panel A, presents the country breakdown of our sample. In general, the sample
Germany.11 Panel B of table 1 presents the sample industry breakdown. The sample comprises
a range of industries, with most in manufacturing, finance, insurance and real estate, or services.
Our matching procedure is designed to control for industry differences. Panel C of table 1
presents a sample breakdown by IAS adoption year, and reveals variation across years.
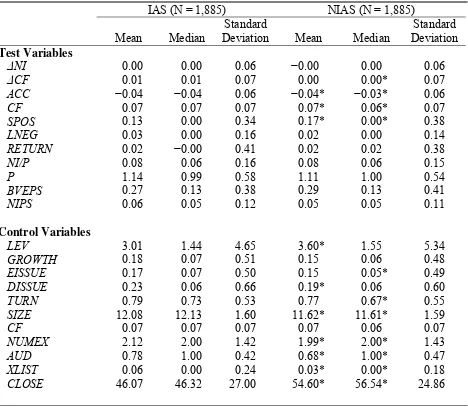
Table 2 presents descriptive statistics relating to variables used in our analyses. Table 2
reveals that IAS firms have significantly fewer incidents of small positive earnings and
insignificantly more incidents of large negative earnings than do NIAS firms.12 Although these
descriptive statistics do not control for other factors, they suggest that IAS firms are less likely
than NIAS firms to manage earnings towards a target and more likely to recognize losses in a
timely manner. In terms of control variables, although IAS firms have higher growth than do
NIAS firms, the difference is not significant. Despite the size match, IAS firms are significantly
larger than NIAS firms. Further, there is some evidence that IAS firms are more likely to issue
debt (mean but not median difference is significant), more likely to issue equity (median but not
mean difference is significant), and are less highly levered (mean but not median difference is
significant). Relating to the last four control variables, on average, IAS firms trade on more
exchanges than NIAS firms, are more likely to be audited by one of the large auditing firms, are
more likely to list on a US stock exchange, and have a smaller percentage of closely held shares.
All of these differences are significant.
11
Our sample of Chinese and German firms includes some firms that are required to apply IAS. These include Chinese B share firms and German New Market firms. We perform all of our comparisons omitting these firms. None of the inferences differs from those obtained from the tabulated results. The table 1, panel A, country classification includes firms from the listed country that are incorporated off-shore, e.g., in Bermuda. The off-shore incorporation permits these firms to use IAS rather than domestic GAAP. For example, four UK firms are
headquartered and operate in the UK, but are incorporated in Bermuda. 12
5.
Results
5.1 POST-ADOPTION PERIOD
Table 3 presents results comparing quality of accounting amounts for IAS and NIAS
firms in the post-adoption period. It reveals that firms applying IAS evidence less earnings
management, more timely loss recognition, and more value relevance of accounting amounts
than do firms not applying IAS.
5.1.1EARNINGS MANAGEMENT
The first finding relating to earnings management indicates that IAS firms exhibit higher
variability of change in net income, ΔNI*, 0.0025 versus 0.0021, although the difference is not
significant. The second finding is consistent with the first in that it indicates that the ratio of the
variance of change in net income, ΔNI*, to the variance of change in cash flow, ΔCF*, is higher
for IAS firms than for NIAS firms. In particular, the ratios are 1.1076 and 1.0392 for IAS and
NIAS firms, suggesting that the difference in net income variability is not solely a result of a
difference in cash flow variability. Consistent with the first two measures, the third finding
indicates that the correlation between accruals, ACC*, and cash flow, CF*, for IAS firms,
–0.5518, is significantly less negative than for NIAS firms, –0.5697. This finding suggests that
IAS firms smooth earnings less than NIAS firms. Finally, the coefficient on SPOS, −0.0431, is
negative, although not significantly so, which suggests that NIAS firms more frequently report
small positive earnings, consistent with managing earnings towards an earnings target.
5.1.2TIMELY LOSS RECOGNITION
The next finding in table 3 relates to timely loss recognition. The significantly positive
coefficient on LNEG, 0.1424, suggests that, controlling for other factors, IAS firms recognize
NIAS firms smooth earnings by delaying the effects of large negative outcomes. In particular,
one interpretation of the results relating to SPOS and LNEG is that managers of NIAS firms
smooth away from large negative earnings and toward small positive earnings, resulting in less
timely recognition of losses.
5.1.3VALUE RELEVANCE
The final set of findings in table 3 relates to value relevance of accounting amounts.
First, regressions of price on earnings and equity book value for IAS and NIAS firms reveal that
the R2 for IAS firms is significantly greater than that for NIAS firms, 40.23% versus 30.35%.
Untabulated regression summary statistics indicate that, as expected, the coefficients on earnings
and equity book value are significantly positive for both IAS and NIAS firms, and that both
coefficients are smaller for NIAS firms. These findings also are consistent with accounting
amounts being more value relevant for IAS than for NIAS firms. Consistent with predictions,
R2s for IAS firms are greater for good news firms (4.90% versus 2.14%), although the difference
is not significant. Contrary to predictions, the R2s for bad news IAS firms are lower than for bad
news NIAS firms (6.22% versus 7.39%), although the difference is not significant.13
5.2PRE-ADOPTION PERIOD
Table 4 presents findings for earnings management, timely loss recognition, and value
relevance for IAS and NIAS firms in the pre-adoption period. It reveals that differences in our
accounting quality metrics between IAS and NIAS firms in the pre-adoption period do not
explain the post-adoption period differences in table 3.
13
5.2.1EARNINGS MANAGEMENT
The first finding relating to earnings management indicates that IAS firms exhibit a
significantly lower variance of the change in net income, ΔNI*, than NIAS firms in the
pre-adoption period, 0.0016 versus 0.0018. This finding contrasts with that from the post-pre-adoption
period in which IAS firms have an insignificantly higher variance of . This result suggests
that the higher ΔNI
*
NI
Δ
*
variance for IAS firms in table 3 in the post-adoption period is not a result of
higher ΔNI* variance for IAS firms in the pre-adoption period. The second finding indicates that
the ratio of the variance of change in net income, ΔNI*, to the variance of the change in cash
flow, ΔCF*, is higher for NIAS firms than for IAS firms, 0.6661 versus 0.6194. This result
suggests that IAS firms evidence more earnings smoothing than NIAS firms in the pre-adoption
period. This finding is in contrast to the finding for the post-adoption period, in which NIAS
firms have a lower ratio of the two variances, indicating that IAS firms evidence less earnings
smoothing in the post-adoption period. This difference indicates that the higher ratio of the
variances of ΔNI* to ΔCF* in table 3 in the post-adoption period is not a result of a higher ratio
for IAS firms in the pre-adoption period. The third finding indicates that the correlations
between accruals, ACC*, and cash flow, CF*, are significantly more negative for IAS firms than
for NIAS firms, –0.6073 versus –0.5726, which also indicates that IAS firms evidence more
earnings smoothing than NIAS firms in the pre-adoption period.
Finally, the coefficient on SPOS, −0.0713, is insignificantly different from zero in the
pre-adoption period, which suggests that NIAS and IAS firms report small positive earnings with
5.2.2TIMELY LOSS RECOGNITION
The next finding in table 4 relates to timely loss recognition. It indicates that the LNEG
coefficient, 0.3094, is significantly larger for IAS than NIAS firms. The result provides evidence
that IAS firms recognize losses more frequently even in the pre-adoption period.
5.2.3VALUE RELEVANCE
The final set of findings in table 4 relates to value relevance. Regressions of price on
earnings and equity book value for IAS and NIAS firms reveal that the R2 for IAS firms is
significantly larger than that for NIAS firms, 28.03% versus 27.18%, in the pre-adoption period.
Thus, it is possible that the higher value relevance in the post-adoption period evidenced by price
regressions for IAS firms is attributable to their having higher value relevance before applying
IAS. The R2 from a regression of earnings on returns for good news IAS firms, 2.24%, is
significantly smaller than that for good news NIAS firms, 2.99%. This finding suggests that the
higher value relevance for good news IAS firms in the post-adoption period is not attributable to
differences in the pre-adoption period. In contrast, the R2 for bad news IAS firms, 4.64%, is
significantly higher than that for NIAS firms, 1.84%. We interpret this finding in connection
with the findings in tables 5 and 6.
5.3COMPARISON OF POST- AND PRE-ADOPTION PERIODS FOR IASFIRMS
Overall, results for the pre-adoption period provide little evidence that the results in the
post-adoption period were also in evidence prior to the application of IAS. To investigate more
associated with applying IAS, we conduct an analysis of changes in our measures before and
after the IAS firms adopt IAS.14
Table 5 presents a comparison of findings for earnings management, timely loss
recognition, and value relevance for IAS firms in the pre- and post-adoption periods. Tests for
all measures suggest improvements in accounting quality with application of IAS. In particular,
variability of net income increases significantly from 0.0017 to 0.0024, and variability of net
income relative to that of cash flow also increases from 0.7442 to 0.9980. In addition, the
correlation between accruals and cash flows after adoption, −0.5549, is significantly less
negative than before adoption, −0.5726. Similarly, as indicated by the SPOS coefficient of
−0.0645, the proportion of small positive net income decreases after adoption, although this
decrease is insignificant.
Regarding timely loss recognition, as indicated by the significant LNEG coefficient of
0.1805, the proportion of large negative earnings is significantly higher post-adoption than
pre-adoption. The R2s from the price level regressions and from the good and bad news returns
regressions also increase significantly from 28.20%, 2.24%, and 4.64% in the pre-adoption
period to 40.23%, 4.90%, and 6.22% in the post-adoption period.
5.4DIFFERENCE IN CHANGES FOR IAS AND NIASFIRMS
A limitation of the analysis in table 5 is that it is difficult to infer whether the
improvement in accounting quality we observe for IAS firms is the result of applying IAS, or
14
whether NIAS firms experienced similar improvement in accounting quality over the same time
period. The results in table 6 generally support the hypothesis that IAS firms experience a
greater improvement in accounting quality than NIAS firms between the pre- and post-adoption
periods. In particular, differences in changes for three of the four earnings management
measures and two of the R2 measures are in the predicted direction. The difference in changes
for the variability of change in ΔNI* is significant. Only managing to a target, timely loss
recognition, and bad news R2 differences in changes results are contrary to predictions.
6. Applying IAS and Equity Cost of Capital
Next we consider whether applying IAS is associated with lower equity cost of capital.
Findings from the information economics literature provide theoretical links between accounting
information and the cost of capital arising from information asymmetry. Easley and O’Hara
(2004) develops an asset pricing model in which both public and private information affect asset
returns, thereby linking a firm’s information structure to its cost of capital. A key result of the
model is that firms can influence their cost of capital by affecting the precision and quantity of
information available to investors. In particular, the authors note “this can be accomplished by a
firm’s selection of its accounting standards, as well as through its corporate disclosure policies.”
Relatedly, Amihud and Mendelson (1986) develops an asset pricing model in which investors
require a liquidity premium to compensate them for the costs of trading in a firm’s securities. In
addition, several studies, relying on somewhat different assumptions, link information and cost
of capital by suggesting that increased information provided by financial disclosure can reduce
estimation risk, thereby lowering cost of capital (Klein and Bawa, 1977; Barry and Brown, 1985;
Other studies provide empirical evidence linking accounting quality and equity cost of
capital. Botosan (1997) and Botosan and Plumlee (2002) provide evidence that proxies for
expected cost of equity capital are negatively related to the voluntary disclosure level as
measured by AIMR corporate disclosure scores. Francis, et al. (2004) relates measures of
earnings quality to proxies for equity cost of capital. Bhattacharya, Daouk, and Welker (2003)
finds a link between three earnings quality measures (earnings aggressiveness, loss avoidance,
and earnings smoothing) and a proxy for equity cost of capital in country-level tests. Barth,
Konchitchki, and Landsman (2006) provides evidence that a timely measure of accounting
quality is significant incremental to the Fama-French factors in a returns prediction model, and is
correlated with expected equity cost of capital constructed from a three-factor Fama-French
approach similar to the one used here.
Collectively, the theoretical and empirical research linking accounting quality and equity
cost of capital leads us to predict that applying IAS is associated with lower equity cost of
capital. We test this prediction by comparing our estimate of expected equity cost of capital for
IAS firms in the pre- and post-adoption periods, using NIAS firms to control for intertemporal
changes in expected equity cost of capital unrelated to applying IAS.
6.1ESTIMATION OF EXPECTED EQUITY COST OF CAPITAL
Botosan and Plumlee (2002) infers cost of capital from share price and earnings forecasts.
Because we do not have earnings forecasts for most sample firms, we follow the approach in
Griffin (2002), Ang and Liu (2004), and Massa, Peyer, and Tong (2004) in estimating expected
equity cost of capital using the Fama and French (1993) three-factor model. That model
function of the excess return of the market portfolio, RM −Rf , and the return on the high minus
low book-to-market (HML) and small-minus-big (SMB) factor mimicking portfolios.
Our procedure for estimating expected equity cost of capital has two steps. First, we
estimate the sensitivity of each firm i’s return to each of the three Fama-French factors by
estimating firm by firm the following monthly time-series regression:
m
Second, we estimate the expected annual factor returns by first calculating each factor’s
average monthly return over the 60 months prior to month m, and then compounding the
resulting average monthly returns over the twelve months prior to the beginning of firm i’s fiscal
year.16 We obtain our estimate of the annual expected equity cost of capital, ECC, for firm i and
year t (based on data available at the beginning of year t) by multiplying the expected factor
returns by their respective estimated factor loadings:
t
Data availability limits the number of firms for which there are 60 months of data. Therefore, we require a minimum of 24 monthly returns to estimate equation (11).
16
where Rf,t is the expected annual risk-free rate for year t + 1 and [RM −Rf]t, [HML]t, and
t
SMB]
[ are the expected annual factor returns for year t + 1.
6.2EXPECTED EQUITY COST OF CAPITAL RESULTS
Table 7 presents expected equity cost of capital results.17 Panels A and B tabulate ECC
summary statistics for IAS and NIAS firms in the pre- and post-adoption periods. Panel A
indicates that both IAS and NIAS firms have essentially the same, and statistically
indistinguishable, mean ECC in the pre-adoption period, 11.48% and 11.42%. However,
consistent with predictions, it also reveals that mean ECC for IAS firms is 0.77% lower than that
for NIAS firms in the post-adoption period, 5.67% vs. 6.44%, although the difference is not
significant because of the large standard errors of the estimates. Panels C and D, which tabulate
ECC statistics separately for IAS and NIAS firms, indicate that mean ECC is significantly
smaller for both groups of firms in the post-adoption period than in the pre-adoption period. Yet,
the decrease in ECC is greater in magnitude (albeit insignificantly so) for IAS firms.
7.
Summary and Concluding Remarks
Our results suggest that application of International of Accounting Standards is
associated with improvement in accounting quality. In particular, firms that apply IAS generally
show less evidence of earnings smoothing, less evidence of managing earnings towards a target,
more timely recognition of losses, and a higher association of accounting amounts with share
prices and returns. Our results are based on three comparisons of accounting quality. The first
17
compares accounting quality for firms applying IAS to that for firms that do not apply IAS in the
period after the IAS firms adopt IAS. The second compares accounting quality for IAS firms to
that for themselves in the periods before and after they adopt IAS. The third compares
differences in changes in accounting quality for IAS firms and for firms that do not apply IAS
between the period before and after the IAS firms adopt IAS. We also find weak evidence that
REFERENCES
Amihud, Y., and H. Mendelson. 1986. Asset Pricing and the Bid-Ask Spread. Journal of
Financial Economics 17: 223-249.
Ang, A., and J. Liu. 2004. How to Discount Cash Flows with Time-Varying Expected Returns.
Journal of Finance 59: 2745-2783.
Ashbaugh, H. 2001. Non-U.S. Firms’ Accounting Standard Choices. Journal of Accounting and
Public Policy 20: 129-153
Ashbaugh, H., and P. Olsson. 2002. An Exploratory Study of the Valuation Properties of
Cross-listed Firms’ IAS and U.S. GAAP Earnings and Book Values. The Accounting Review 77:
107-126.
Ashbaugh, H., and M. Pincus, 2001. Domestic Accounting Standards, International Accounting
Standards, and the Predictability of Earnings, Journal of Accounting Research 39: 417-434.
Ball, R., S.P. Kothari, and A. Robin. 2000. The Effect of International Institutional Factors on
Properties of Accounting Earnings. Journal of Accounting and Economics 29: 1-51.
Ball, R.; A. Robin, and J.S. Wu. 2003. Incentives versus Standards: Properties of Accounting
Income in Four East Asian Countries. Journal of Accounting and Economics 36: 235-270.
Barry, C. B., and S. J. Brown. 1985. Differential Information and Security Market Equilibrium.
Journal of Financial and Quantitative Analysis 20: 407-422.
Barth, M.E., W.H. Beaver, and W.R. Landsman. 2001. The Relevance of the Value Relevance
Literature for Accounting Standard Setting: Another View. Journal of Accounting and
Barth, M.E., Y. Konchitchki, and W.R. Landsman. 2006. Cost of Capital and Financial
Statement Transparency. Working paper, Stanford University and University of North
Carolina.
Bartov, E., S. Goldberg, and M. Kim. 2004. Comparative Value Relevance among German, U.S.
and International Accounting Standards: A German Stock Market Perspective. Working
paper, New York University.
Bhattacharya, U., H. Daouk, and M. Welker. 2003. The World Price of Earnings Opacity.
Working paper, Queen’s University.
Botosan, C.A. 1997. Disclosure Level and the Cost of Equity Capital. The Accounting Review 7:
323-349.
Botosan, C.A., and M. Plumlee. 2002.A Re-examination of Disclosure Level and Expected
Cost of Equity Capital. Journal of Accounting Research 40: 21-40.
Bradshaw, M.T., and G.S. Miller. 2005. Will Harmonizing Accounting Standards Really
Harmonize Accounting? Evidence from Non-U.S. Firms Adopting US GAAP. Working
paper, Harvard Business School.
Breeden, R. 1994. Foreign Companies and U.S. Markets in a Time of Economic
Transformation. Fordham International Law Journal 17.
Burgstahler, D., and I. Dichev. 1997. Earnings Management to Avoid Earnings Decreases and
Losses. Journal of Accounting and Economics 24: 99-126.
Cairns, D. 1999. Degrees of Compliance. Accountancy International (September): 68-69.
Clarkson, P., and R. Thompson. 1990. The Empirical Estimates of Beta when Investors Face
Coles, J. and U. Loewenstein. 1988. Equilibrium Pricing and Portfolio Composition in the
Presence of Uncertain Parameters. Journal of Financial Economics: 279-303.
Covrig, V., M. DeFond and M. Hung. 2005. Cross-Border Investment and the Voluntary
Adoption of International Accounting Standards. Working paper, University of Southern
California.
Cramer, J.S. 1987. Mean and Variance of R2 in Small and Moderate Samples. Journal of
Econometrics 35: 253-266.
Daske, H. 2006. Economic Benefits of Adopting IFRS or US-GAAP - Have the Expected Costs
of Equity Capital Really Decreased? Journal of Business Finance and Accounting,
forthcoming.
Easley, D., and M. O’Hara. 2004. Information and the Cost of Capital. Journal of Finance 59:
1,553-1,583.
Eccher, E. and P. Healy, 2003. The Role of International Accounting Standards in Transitional
Economies: A Study of the People's Republic of China. Working paper,Massachusetts
Institute of Technology.
Ewert, R., and A. Wagenhofer. 2005. Economic Effects of Tightening Accounting Standards to
Restrict Earnings Management. The Accounting Review 43: 1,101-1,124.
Fama, E.F., and K.R. French. 1993. Common Risk Factors in the Returns of Stocks and Bonds.
Journal of Financial Economics 33: 3-56.
Francis, J., R. LaFond, P. Olsson, and K. Schipper. 2004. Costs of Equity and Earnings
Attributes. The Accounting Review 79: 967-1,010.
Griffin, J.M. 2003. Are the Fama and French Factors Global or Country Specific? Review of
Financial Studies 15: 723-750.
Handa, P., and S. Linn. 1993. Arbitrage Pricing with Estimation Risk. Journal of Financial
Economics: 81-100.
Harris, M., and K. Muller. 1999. The Market Valuation of IAS versus US GAAP Accounting
Measures Using Form 20-F Reconciliations. Journal of Accounting and Economics 26:
285-312.
Healy, P.M. 1985. The Effect of Bonus Schemes on Accounting Decisions. Journal of
Accounting and Economics 7: 85-107.
Hung, M. and K.R. Subramanyam. 2004. Financial Statement Effects of Adopting International
Accounting Standards: The Case of Germany. Working paper, University of Southern
California.
Klein, R., and V. Bawa. 1976. The Effect of Estimation Risk on Optimal Portfolio Choice.
Journal of Financial Economics 3: 215-231.
Land, J., and M. Lang. 2002. Empirical Evidence on the Evolution of International Earnings. The
Accounting Review 77: 115-134.
Lang, M., J. Raedy, and M. Yetman. 2003. How Representative are Firms that are Cross Listed
in the United States? An Analysis of Accounting Quality. Journal of Accounting Research
41: 363-386.
Lang, M., J. Raedy, and W. Wilson. 2005. Earnings Management and Cross Listing: Are
Reconciled Earnings Comparable to US Earnings? Journal of Accounting and Economics,
Leuz, C. 2003. IAS Versus U.S. GAAP: Information Asymmetry-based Evidence from
Germany’s New Market. Journal of Accounting Research 41: 445-427.
Leuz, C.; D. Nanda; and P. Wysocki. 2003. Earnings Management and Investor Protection: An
International Comparison. Journal of Financial Economics 69: 505-527.
Massa, M., U. Peyer, and Z. Tong. 2004. Limits of Arbitrage and Corporate Financial Policies.
Working Paper, INSEAD.
Myers, L.A., and D.J. Skinner. 2002. Earnings Momentum and Earnings Management. Working
paper, University of Michigan.
Pagano, M.; A. Röell; and J. Zehner. 2002. The Geography of Equity Listings: Why do
Companies List Abroad? Journal of Finance 57: 2,651-2,694.
Street, D. and S. Gray. 2001. Observance of International Accounting Standards: Factors
Explaining Non-Compliance. ACCA Research Report No. 74.
Tarca, A. 2004. International Convergence of Accounting Practices: Choosing between IAS and
US GAAP. Journal of International Financial Management and Accounting 15: 60-91.
Van Tendeloo, B. and A. Vanstraelen. 2005. Earnings Management under German GAAP versus
IFRS. European Accounting Review 14: 155-180.
Wysocki, P. 2005. Assessing Earnings and Accruals Quality: US and International Evidence.
TABLE 1
Descriptive Statistics Relating to Application of IAS
Panel A: Country Breakdown
Number of
Firm-Year Observations
Percentage of Firm-Year Observations
Number of IAS Firms
Percentage of IAS Firms
Australia 2 0.11 1 0.31
Austria 111 5.89 17 5.33
Belgium 23 1.22 5 1.57
China 430 22.81 90 28.21
Czech Republic 8 0.42 2 0.63
Denmark 28 1.49 4 1.25
Finland 37 1.96 3 0.94
Germany 329 17.45 57 17.87
Greece 12 0.64 2 0.63
Hong Kong 53 2.81 10 3.13
Hungary 59 3.13 10 3.13
Poland 4 0.21 1 0.31
Portugal 6 0.32 1 0.31
Russian Federation 2 0.11 2 0.63
Singapore 27 1.43 8 2.51
South Africa 66 3.50 8 2.51
Spain 3 0.16 1 0.31
Sweden 3 0.16 1 0.31
Switzerland 594 31.51 79 24.76
Turkey 84 4.46 16 5.02
United Kingdom 4 0.21 1 0.31
TABLE 1
Descriptive Statistics Relating to Application of IAS
Panel B: Industry Breakdown
Number of Agriculture, Forestry and
Fishing 3 0.16 1 0.31
Mining 124 6.58 21 6.58
Construction 147 7.80 20 6.27
Manufacturing 951 50.45 152 47.65
Utilities 107 5.68 18 5.64
TABLE 2
Descriptive Statistics Relating to Variables used in Analyses
IAS (N = 1,885) NIAS (N = 1,885)
Mean Median
Standard
Deviation Mean Median
Standard
* Significantly different from IAS and NIAS at the 0.05 levels respectively (two-tailed).
Sample of firms that adopted International Accounting Standards (IAS) between 1994 and 2003 (IAS firms) and matched sample of firms that did not (NIAS firms). Tabulated statistics are from the years after IAS firms adopted IAS, i.e., the post-adoption period, which ends in 2003.
ΔNI is the change in annual earnings, where earnings is scaled by end-of-year total assets; ΔCF is the change in annual net cash flow, CF, where cash flow is scaled by end-of-year total assets;
months after the firm’s fiscal year end; P is price as of six months after fiscal year-end; NI/P is earnings per share scaled by beginning of year price; BVEPS is book value of equity per share;
NIPS is net income per share.
LEV is end-of-year total liabilities divided by end-of-year book value of equity, GROWTH is annual percentage change in sales; EISSUE is annual percentage change in common stock;
DISSUE is annual percentage change in total liabilities; TURN is sales divided by end-of-year total assets; SIZE is the natural logarithm of market value of equity in millions of dollars as of the end of the year; NUMEX is number of exchange listings; AUD is an indicator that equals 1 if the auditor is one of the large international accounting firms; XLIST is an indicator that equals 1 if the firm is listed on any US stock exchange and WorldScope indicates that the US exchange is not the primary exchange; CLOSE as the percentage of closely held shares as reported by