Int. J. Production Economics 96 (2005) 355–365
A structural equation model of supplychain quality
management and organizational performance
Chinho Lin
a,, Wing S. Chow
b, Christian N. Madu
c, Chu-Hua Kuei
c, Pei Pei Yu
a aDepartment of Industrial and Information Management & Institute of Information Management, College of Management Science, National Cheng Kung University, Tainan, Taiwan, ROC
b
Department of Finance and Decision Sciences, Hong Kong Baptist University, Hong Kong
c
Department of Management and Management Science, Lubin School of Business, Pace University, 1 Pace Plaza, NY 10038, USA
Received 1 April 2003; accepted 29 May2004 Available online 8 October 2004
Abstract
In this paper, we identifythrough the use of empirical data collected from Taiwan and Hong Kong, the factors that influence supplychain qualitymanagement. The data was collected from practicing managers. The findings for the two sets of data were consistent. The data showed that QualityManagement (QM) practices are significantlycorrelated with the supplier participation strategyand this influences tangible business results, and customer satisfaction levels. The data also showed that QM practices are significantlycorrelated with the supplier selection strategy. The empirical results presented could be used to improve the management of supplychain networks in the economies studied.
r2004 Elsevier B.V. All rights reserved.
Keywords:Supplychain qualitymanagement; Organizational performance; Structural equation model
1. Introduction
There is a growing attention on global supply chain management. Supplychain management is a holistic and a strategic approach to demand, operations, procurement, and logistics process management (Kuei et al., 2002). Cross-country activities are normal and to be expected. These
activities are often influenced bya supplychain’s social and technical components. Traditionally, the focus of supplychains was on specific functionalities such as purchasing, manufacturing, and shipping to support logistics operations. The competitive environment of the 21th century requires the deliveryof cost, efficiency, high service levels, rapid response, and high qualityof products and services. The effective management of tech-nologyand qualityis the keyto increased quality and enhanced competitive position in today’s global environment. Kuei et al. (2002) suggest that supplychain qualitymanagement should be www.elsevier.com/locate/dsw
0925-5273/$ - see front matterr2004 Elsevier B.V. All rights reserved. doi:10.1016/j.ijpe.2004.05.009
Corresponding author. Tel.: +2757575-53137.
E-mail addresses:[email protected] (C. Lin), [email protected] (W.S. Chow),
distinguished from supplychain technologyman-agement. The former deals with the social compo-nents of the supplychain while the latter addresses concerns of technical systems in managing supply chains. Of interest in this studyis the influence of competitive factors in supplychain qualityman-agement. Supplychain qualityis a keycomponent in achieving competitive advantage.
Kuei and Madu (2001) defined supplychain qualitymanagement (SCQM) with three simple equations where each equation represents the letters that make up SCQM. The definition is as follows:
SC=a production–distribution network; Q=meeting market demands correctly, andachieving customer satisfaction rapidlyand profitably; and
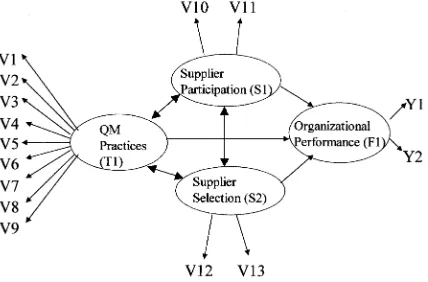
M=enabling conditions and enhancing trust for supplychain quality.Although there has been a trend towards SCQM, the essential features that lead to achiev-ing it have not been fullyexplored. A conceptual framework is developed in this studyto postulate causal links between SCQM and organizational performance. This enables the use of statistical models to evaluate and identifySCQM factors or activities that mayinfluence organizational per-formance. Structural equation modeling (SEM) techniques are used to test the framework. Implications for successful SCQM are derived from the statistical applications.
2. Research background
Today’s global marketplace offers significant opportunities to conduct import and export operations. Bowersox et al. (2002) noted that successful international logistics operations de-pend on global firms’ capabilities in dealing with the local operating environment and the diversity in work practices. Further, qualityand operational efficiencyare known as the two greatest supply chain challenges. To make high-qualitysupply chains a reality, those challenges must be resolved. For more than a decade, the Kellogg Company
Taiwan, a Deming Prize winner, was the first non-Japanese companyto win the Japan Quality Medal (Evans and Lindsay, 2002). Based on a surveyof 131 manufacturing and 109 service companies in Taiwan, Solis et al. (1998) found that Taiwanese manufacturing companies were more advanced in terms of QM practices when compared with Taiwanese service companies. Further, manufacturing managers perceived a more positive association between TQM practices and business results.
Kuei and Madu (2001) note that the focus of quality-based paradigm has shifted from the traditional company-centered setting to complete supplychain systems. Levy(1998)referred to the phenomenon of total qualityrelationship in the supplychain as a paradigm shift. In the traditional paradigm, firms are concerned with company-centered issues such as price, product quality, and deliverytime. In the new supplychain quality paradigm, supplier–customer relationships and co-making qualityproducts have evolved as the major issues. A number of articles offer insights on the critical success factors in a traditional qualityor a broader supplychain qualitycontext.Saraph et al. (1989), for example, reported that eight critical factors could be used for traditional QM assess-ment. These factors are the role of top manage-ment leadership, the role of the quality department, training, product/service design, sup-plier qualitymanagement, process management, qualitydata and reporting, and employee rela-tions. Kannan et al. (1998) laid emphasis on supplier evaluation, supplier involvement, and the decentralization of purchasing to enhance supply chain quality. Krause et al. (1998) identified five factors for supplier selection: quality, delivery, cost, flexibility, and innovation. In these studies, however, theydid not formallytest causal linkages or anyform of association between those critical factors and organizational performance. Wong et al. (1999)conducted an empirical studyof practi-cing managers in Hong Kong and used structural equation modeling to studythe interactions between manufacturers and suppliers. Theyfound that factors such as cooperation, trust, and long-term relationships enhance qualityamong supply chain members. Chow and Liu (2003) used a
structural analysis approach to investigate TQM measurement items in information system (IS) function. Theysuggested that strategies for QM in the area of IS must center on the following: top management and qualitypolicy, training, IS product/service design, qualityinformation report-ing, and customer orientation.Krause et al. (2000) reported that suppliers’ performance would deter-mine the long-term success of the purchasing firms. Manypurchasing firms have also indicated that the critical supplier improvement areas include quality, delivery, cost reduction, new technology adoption, financial health, and product design. Kuei and Madu (2001) conducted a field studyin Taiwan to investigate the relevant variables that impacted the effectiveness of supplychains in the qualitycontext. Three performance groups were identified through cluster analyses based on customer satisfaction levels, productivityindica-tors, and tangible financial results. It is observed that the ‘‘best performance group’’ tends to emphasize supplier relationship, IT-driven change, and customer focus. In another study,Kuei et al. (2002) reported that the organizational perfor-mance of enterprises could be differentiated bythe following quality-related variables: process man-agement, supplier selection, and training on statistical methods. Traceyand Vonderembse (1998) also confirm that improved supplier per-formances on deliverytime, shipping damage, and inbound component qualityhave positive impacts on manufacturing performances. Their results indicate that the levels of QM practices and supplier involvement do relate to the organiza-tional performance.
Based on this literature review, the critical factors (or variables) for SCQM are identified as follows: QM practices, supplier participation, and supplier selection. To the best of our knowledge, no study has examined these critical factors for SCQM and their causal linkages to organizational performance. Such linkage is examined in this study.
3. The conceptual model—research hypotheses
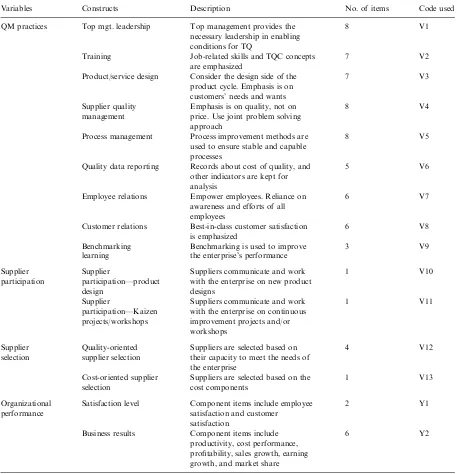
conceptual model, each unobserved (latent) vari-able comprises a number of constructs. For example, QM practice is represented bythe following nine constructs: top management leader-ship, training, product/service design, supplier qualitymanagement, process management, quality data reporting, employee relations, customer relations and benchmarking learning. Each con-struct consists of a set of measurement items (see Table 1). Supplyparticipation strategyconsists of product design collaboration and joint kaizen projects/workshops (Kannan et al., 1998; Wong et al., 1999;Tan, 2001;Kuei et al., 2002). Supplier selection strategyconsists of qualityand cost considerations (Krause et al., 1998; Tracyand Vonderembse, 1998; Kuei and Madu, 2001). Organizational performances are grouped into two categories: intangible and tangible business results (Madu et al., 1995, 1996;Kuei et al., 1997; Samson and Terziovski, 1999; Kuei and Madu, 2001).
For the purpose of this study, QM practices, supplier participation, and supplier selection are considered as latent-independent (exogenous) vari-ables, while organizational performance is used as latent-dependent (endogenous) variables. From this conceptual model, a number of hypotheses can be developed.
Flynn et al. (1994) suggested that supplier participation is an integral part of QM.Curkovic et al. (2000)reported that supplier participation is one of the keyquality-related action programs.
Kuei and Madu (2001)also reported that supplier participation is an imperative part of SCQM. Thus,
H1: QM practices and supplier participation are significantlycorrelated.
Traceyand Tan (2001) argued that supplier involvement relates to the customer satisfaction level and firm’s performances. Kuei and Madu (2001) noted that supplier participation separates ‘‘good performing’’ organizations from ‘‘not-so-good performing’’ units.Traceyand Vonderembse (1998) and Krause et al. (1998) noted a similar relationship between supplier participation and organizational performances. Therefore,
H2: The level of supplier participation practice positivelyinfluences the degree of organizational performance.
Saraph et al. (1989) contended that suppliers should be selected based on their practices in the area of quality.Kuei et al. (2001)reported that supplier selection is one of the critical success factors in managing supplychain quality. There-fore,
H3: QM practices and supplier selection are significantlycorrelated.
Tan et al. (1998) contended that supplier evaluation practices relates to the performances of firms.Kuei et al. (2001, 2002)also reported that supplier selection separates ‘‘good performing’’ firms from ‘‘not-so-good performing’’ organiza-tions. As a result,
H4: The level of supplier selection practice positivelyinfluences the degree of organizational performance.
Tan et al. (1998) noted a relationship between firms’ operational qualityapproaches and their performance. Their empirical results, however, show that QM practices and supplychain manage-ment practices must be implemanage-mented conjointlyto realize superior financial and business results.Kuei Fig. 1. Conceptual model—structural equation modeling
and Madu (1995) used step-wise discriminant analysis to identify QM practices that separate ‘‘good performing’’ organizations from
‘‘not-so-good performing’’ units.Madu et al. (1995)found a relationship between the qualitydimensions and organizational performances through the use of Table 1
Multivariate scales of supplychain qualitymanagement
Variables Constructs Description No. of items Code used
QM practices Top mgt. leadership Top management provides the 8 V1 necessaryleadership in enabling
conditions for TQ
Training Job-related skills and TQC concepts 7 V2
are emphasized
Product/service design Consider the design side of the 7 V3 product cycle. Emphasis is on
customers’ needs and wants
Supplier qualityEmphasis is on quality, not on 8 V4 management price. Use joint problem solving
approach
Process management Process improvement methods are 8 V5 used to ensure stable and capable
processes
Qualitydata reporting Records about cost of quality, and 5 V6 other indicators are kept for
analysis
Employee relations Empower employees. Reliance on 6 V7 awareness and efforts of all
employees
Customer relations Best-in-class customer satisfaction 6 V8 is emphasized
Benchmarking Benchmarking is used to improve 3 V9
learning the enterprise’s performance
Supplier Supplier Suppliers communicate and work 1 V10
participation participation—product with the enterprise on new product
design designs
Supplier Suppliers communicate and work 1 V11
participation—Kaizen with the enterprise on continuous projects/workshops improvement projects and/or
workshops
Supplier Quality-oriented Suppliers are selected based on 4 V12 selection supplier selection their capacityto meet the needs of
the enterprise
Cost-oriented supplier Suppliers are selected based on the 1 V13 selection cost components
Organizational Satisfaction level Component items include employee 2 Y1
performance satisfaction and customer
satisfaction
Business results Component items include 6 Y2
empirical studies.Traceyand Vonderembse (1998) postulated a similar relationship between QM practices and organizational performances. Thus,
H5: The degree of QM practice positively influences the degree of organizational perfor-mance.
Vonderembse and Tracey(1999), and Tracey and Tan (2001) argued that supplier-related practice consists of two important constructs: supplier selection criteria and supplier involve-ment. Together, theycan improve firms’ perfor-mance level. As a consequence,
H6: Supplier participation and supplier selection are significantlycorrelated.
A multivariate statistical technique, namely, the SEM was then used to empiricallytest the proposed hypotheses.
4. Empirical assessment
Structural questionnaires with cover letters were used to collect data through a mail surveyin Hong Kong. The telephone interview was adopted to follow up to those respondents who did not reply within four weeks after the questionnaires were posted. Two hundred and fiftypotential respon-dents were randomlyselected from http:// www.tradtrade.com, which provided a compre-hensive list of supplychain firms. Telephone calls were made to confirm their SCQM status. One hundred and nine replies were received, which constituted a response rate of 43.6%. The respon-dents were from deliveryservices (including air cargo services), freight, transportation, wholesales, trading, and logistics firms. About 80% of respondents were holding a managerial position; with 19.3% being top-level managers. In Taiwan, a total of 600 questionnaires were mailed to practi-cing managers drawn from a list of Taiwan’s top 1000 companies. The selected firms were contacted bytelephone calls and letters to solicit their participation. In the end, 103 firms participated in this project. Thus, the effective response rate
was 17%. Participating firms were further con-tacted bytelephone to confirm their engagements in the areas of qualityand supplychains.
Kuei et al.’s (2002) instrument was used to measure constructs for all latent variables, namely, QM practices, supplier participation, supplier selection, and organizational performance. QM practices, for example, were measured bynine constructs. Each construct contains a set of indicators. Respondents were presented with 73 measurement items grouped under different con-struct headings (see Table 1). A 7-point interval rating scale system was used in the survey, with 7 equaling the highest extent or degree. A reliability and validitytest was then applied to examine these predetermined constructs. Specifically, Cronbach’s
a reliabilityestimate test and within-scale factor
analysis (Nunnally, 1967;Flynn et al., 1995;Kuei et al., 1997;Kuei and Madu, 2001) were applied. The former was used to assess the internal consistencyof the constructs, while the latter was used to measure the extent to which all indicators in a construct measure the same multivariate construct. When applying those tests, we removed the measurement item that might be noted as not being part of our predetermined constructs. Table 2 presents the summaryof loading ranges and areliabilityestimates for each construct used
in this study. It is observed from this table that almost all of our research constructs are with Cronbach’s a larger than 0.8, and all of them are
with Cronbach’s a larger than 0.64, which reveal
high reliabilityof our measurements. Further, all the factor loading scores are higher than 0.5, indicating acceptable validitylevel. In the con-cluding section of measurement, the mean was then taken for each multivariate construct.
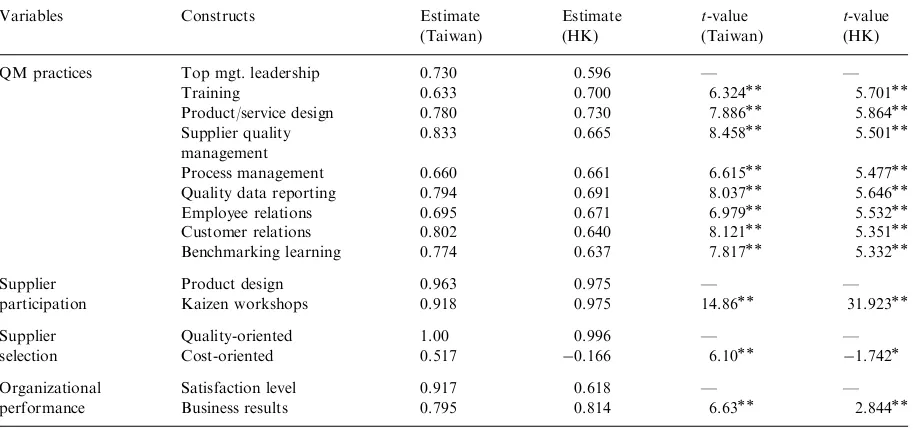
Table 3
Summaryresults of the measurement model
Variables Constructs Estimate Estimate t-value t-value
(Taiwan) (HK) (Taiwan) (HK)
QM practices Top mgt. leadership 0.730 0.596 — —
Training 0.633 0.700 6.324 5.701
Product/service design 0.780 0.730 7.886 5.864
Supplier quality0.833 0.665 8.458 5.501
management
Process management 0.660 0.661 6.615 5.477
Qualitydata reporting 0.794 0.691 8.037 5.646
Employee relations 0.695 0.671 6.979 5.532
Customer relations 0.802 0.640 8.121 5.351
Benchmarking learning 0.774 0.637 7.817 5.332
Supplier Product design 0.963 0.975 — —
participation Kaizen workshops 0.918 0.975 14.86 31.923
Supplier Quality-oriented 1.00 0.996 — —
selection Cost-oriented 0.517 0.166 6.10 1.742
Organizational Satisfaction level 0.917 0.618 — —
performance Business results 0.795 0.814 6.63 2.844
po0.05;0.05opo0.10. Table 2
Scaling
Variables Constructs a(Taiwan) a(HK) Loading range (Taiwan) Loading range (HK)
QM practices Top mgt. 0.8987 0.7103 0.66–0.78 0.51–0.62
leadership
Training 0.7848 0.7691 0.55–0.68 0.50–0.65
product/service 0.8748 0.8009 0.57–0.75 0.55–0.74 design
Supplier quality0.8957 0.9000 0.56–0.80 0.61–0.84 management
Process 0.8569 0.9353 0.66–0.73 0.73–0.91
management
Qualitydata 0.8195 0.9313 0.52–0.77 0.79–0.90
reporting
Employee 0.8241 0.9103 0.60–0.69 0.59–0.88
relations
Customer 0.8519 0.9446 0.74–0.86 0.76–0.91
relations
Benchmarking 0.9324 0.9645 0.86–0.91 0.90–0.94
learning
Supplier Product designa — — — —
participation Kaizen — — — —
workshopsa
Supplier Quality-oriented 0.8537 0.9278 0.66–0.74 0.69–0.95
selection Cost-orienteda — — — —
Organizational Satisfaction level 0.7532 0.6415 0.60 0.5022 performance Business results 0.9053 0.8701 0.62–0.82 0.51–0.84
a
model were checked to ensure the results were acceptable and were consistent with the underlying theory. As noted byTan (2001), the formal model (i.e. the measurement model) deals with the reliabilityand validityof the constructs in measuring the latent variables, while the latter model (i.e. the structural model) is concerned with the direct and indirect relations among the latent variables. SEM technique is therefore suited for our research purposes.Table 3shows the summary results of the measurement model and Tables 4 and 5show the results of hypothesis testing of the structural relationships among latent variables. With respect to our measurement models such as QM practices, our results showed that this variable was valid due to its indicators’ parameter estimates and their statistical significant. For example, thet -values of the nine indicators ranged from 6.324 to 8.458 with attained levels of significance that are below 0.05 in the Taiwan data set (see Table 3). Similar conclusions are derived for supplier participation, supplier selection, and organiza-tional performance.
The results further show that the overall fit measure of Taiwan data has w2 equaling 86.32
(p40.05), and GFI equaling 0.900, while the overall fit measure of Hong Kong data is with w2
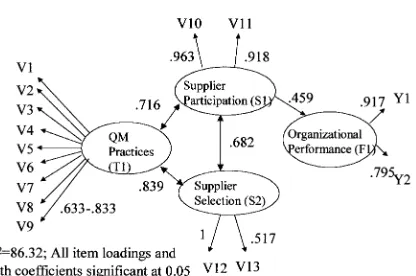
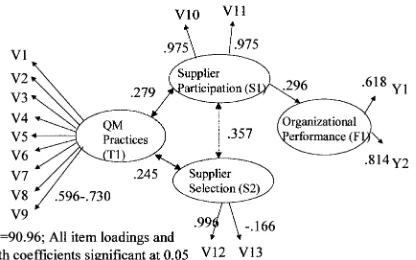
equaling 90.960 (p40.05), and GFI equaling 0.903. According to these results, the data fits the model quite well. The end results such as parameter estimates and t-values and summary of findings are presented inFigs. 2 and 3.
The results therefore support the structural equation model for both Taiwan and Hong Kong data independently. Specifically, the data showed that QM practices are significantlycorrelated with Table 4
Summaryresults of the structural model—Taiwan data
Description Path Hypothesis Estimate t-value
QM practices and supplier participation T1–S1 H1 0.716 4.974
Supplier participation to organizational performance S1–F1 H2 0.459 3.179
QM practices and supplier selection T1–S2 H3 0.839 5.483
Supplier selection to organizational performance S2–F1 H4 0.156 0.865a QM practices to organizational performance T1–F1 H5 0.012 0.058a Supplier participation and supplier selection S1–S2 H6 0.682 5.553
a
p40.1;po0.5. Table 5
Summaryresults of the structural model—Hong Kong data
Description Path Hypothesis Estimate t-value
QM practices and supplier participation T1–S1 H1 0.279 2.456
Supplier participation to organizational performance S1–F1 H2 0.296 2.067
QM practices and supplier selection T1–S2 H3 0.245 2.211
Supplier selection to organizational performance S2–F1 H4 0.126 1.035a QM practices to organizational performance T1–F1 H5 0.101 0.812a Supplier participation and supplier selection S1–S2 H6 0.357 3.433
ap40.1;p o0.05.
supplier participation (H1), which in turn influ-ences organizational performance (H2). There is therefore, a causal link between QM practices and organizational performance. The SEM helps to establish such a causal link. The data also showed that QM practices are significantlycorrelated with the supplier selection strategy(H3). Supplier participation and supplier selection are also found to be correlated (H6). In the case of the Taiwan data, the correlation coefficient is high at 0.682 but moderate for the Hong Kong data at 0.357. Future studies should be verycautious of this relationship to avoid problems of autocorrelation. This, how-ever, does not appear to be the case here. Further, the result does not show that supplier selection strategyinfluences organizational performance (H4). Our sample data from both Taiwan and Hong Kong did not support the hypothesis that QM practices have anydirect impact on organiza-tional performance (H5). As a result, both H4 and H5 are rejected. These results are further discussed in the next section.
5. Implications and discussions for SCQM and development
There are several observations that need to be addressed in our result findings. First, the pro-posed hypothesis H5 is rejected, that is QM practices (T1) have no direct influence on organi-zational performance (F1). Chow and Lui (2003) also reported a similar finding in their paper. They revealed that onlyhalf of the ten proposed QM
practices had a direct impact on organizational performance. Those five significant QM practices are: top management and qualitypolicy, training, IS product/service design, qualityinformation reporting, and customer orientation. Theyrecom-mended that the construction of measurement items for each QM practice be directlyrelated to the subjects being studied. For instance, Ravi-chandran and Rai (2000) have developed a set of QM training measurement items specificallyfor software developments. It is recommended in this paper, that further studies should explore this suggestion. Our data, however, illustrates that the proposed QM practices (T1) have an indirect impact on organizational performance (F1). There are two paths contributing to this indirect effect. Supplier participation (S1) is serving as a mediator for the first path, whereas the other path has two mediators, supplier participation (S1) and supplier selection strategy(S2). Thus, the indirect effect of QM practices (T1) on organizational performance (F1) is 0.591 (that is 0.7160.459+ 0.8390.6820.459) for Taiwan data, and it is 0.108 (that is 0.2790.296+0.2450.357 0.296) for Hong Kong data. After interviewing a few supplychain experts regarding our findings, we learned that TQM is emphasized in this region more as a management concept, rather than as a direct tool to enhance performance. Our findings also support the notion that TQM is not a quick-fix solution to problems. The long-term commitment to TQM is normallyrequired to realize its benefits. The nature of TQM is complex, company-wide, and full implementation is not something that can be done easilyor quickly(Hunt, 1992).
engineers, and the qualityof products/services are checked byqualityofficers at a later stage. Cost is a critical element but plays little role when selecting suppliers. All selected suppliers are kept in a list called Approved Vendor/Supplier list, sorted in a rank order. The second supplier in the list will then be selected as the finalist when the first one fails to perform its services as expected. This operational procedure shows that supplier selection strategy(S2) plays an indirect role in organizational performance (F1) because the supplier performance can onlybe evaluated after it has been confirmed. Our data supports this claim, and also the claim that supplier participa-tion (S1) is a mediator. Our result shows that the indirect effect of supplier selection strategyon organizational performance (F1) is 0.313 (that is 0.6820.459) for Taiwan data, and it is 0.106 (that is 0.3570.296) for Hong Kong data. This result is expected since most of the industries in Taiwan and Hong Kong are in the mature stage of their life cycle. Supplier–customer relationships are quite stable. Therefore, supplier participation (H2) is more crucial than supplier selection (H4). This may explain the insignificant result obtained for H4.
Third, we confirmed our SEM model byusing Taiwan data, and then verified it byusing Hong Kong data. Both data support the proposed direct effects of hypotheses H1, H2, H3, and H6, and indirect effects of hypotheses H4 and H5 on organizational performance. It is, however, interest-ing to point out that all results from the Hong Kong data are reported as moderate when compared to those from the Taiwan data. We suspect that this maybe influenced bythe maturitylevel of supply chain practices in both places. For instance, Hong Kong SAR government has onlyin the recent year considered the use of supplychain as a strategic means to revive their economic performance.
6. Conclusions
There are some important conclusions that can be drawn from this study. First, the results showed that keyQM practices could be integrated in the supplier participation programs to provide needed collaboration, which in turn would result in
improved organizational performance. This find-ing supports the view that SCQM programs should include traditional QM practices with special attention paid to operational items. In other words, the SCQM process incorporates not just the participation of suppliers but also, the relevant TQM practices in their environment. Second, organizational performance can be opti-mized when the organization considers its suppli-ers as important trading partnsuppli-ers and membsuppli-ers of the value chain. Third, qualityalso continues to be an important attribute in anyrelationship between the companyand its suppliers.
In summary, these results are noteworthy in that similar outcomes were obtained with two indepen-dent data sets collected from two different regions. The outcomes could provide a valuable guide in the practice of global SCQM. Our intent is to see how global supplychain factors react to different environmental settings. It appears, based on this study, that the demand for SCQM is the same irrespective of the environment. However, more research is needed before this conclusion can be generalized to other countries or regions.
Acknowledgements
The authors thank the National Science Council, Taiwan, ROC, for partiallysupporting the research under Grant No. NSC 90-2416-H-006-021-SSS.
References
Ahire, S., Dreyfus, P., 2000. The impact of design management and process management on quality: An empirical investi-gation. Journal of Operations Management 18, 549–575. Anderson, J.C., Gerbing, D.W., 1988. Structural equation
modeling in practice: A review and recommended two-step approach. Psychological Bulletin 103 (3), 411–423. Anderson, J.C., Narus, J.A., 1990. A model of distributor firm
and manufacturer firm working partnerships. Journal of Marketing 54 (1), 42–58.
Bentler, P.M., 1992. On the fit of models to covariances and methodologyto the bulletin. Psychological Bulletin 112 (3), 400–404.
Bowersox, D.J., Closs, D.J., Cooper, M.B., 2002. SupplyChain Logistics Management. McGraw-Hill, New York. Brown, G., Keegan, J., Vigus, B., Wood, K., 2001. The Kellogg
Choi, T.Y., Eboch, K., 1998. The TQM paradox: Relationships among TQM practices, plant performance, and customer satisfaction. Journal of Operations Management 17, 59–75. Chow, W.S., Lui, K.H., 2003. A structural analysis of the significant of a set of the original TQM measurement items in Information System function. The Journal of Computer Information System 43 (3), 81–91.
Curkovic, S., Vickery, S., Droge, C., 2000. Quality-related action programs: Their impact on qualityperformance and firm performance. Decision Sciences 31 (4), 885–905. Evans, J.R., Lindsay, W.M., 2002. The Management and
Control of Quality. South-Western, Cincinnati, OH. Flynn, B.B., Schroeder, R.G., Sakakibara, S., 1994. A
frame-work for qualitymanagement research and an associated measurement instrument. Journal of Operations Manage-ment 11 (4), 339–366.
Flynn, B.B., Schroeder, R.G., Sakakibara, S., 1995. Determi-nants of qualityperformance in high and low qualityplants. QualityManagement Journal 2 (2), 8–25.
Hunt, V.D., 1992. Qualityin America: How to Implement a Competitive QualityProgram. Irwin, Homewood, IL. Kannan, V.R., Tan, K., Handfield, R.B., 1998. Managing
competition, quality, customer relations, and the supply base, and its impact on Firm. Proceedings of the Decision Science Institute, pp. 1259–1261.
Krause, D.R., Pagell, M., Curkovic, S., 1998. Purchasing strategy: An empirical analysis. Proceedings of the Decision Science Institute, pp. 1227–1229.
Krause, D.R., Scannell, T.V., Calantone, R.J., 2000. A structural analysis of the effectiveness of buying firms’ strategies to improve supplier performance. Decision Sciences 31 (1), 33–55.
Kuei, C., Madu, C.N., 1995. Managers’ perceptions of factors associated with qualitydimensions for the different types of firms. QualityManagement Journal 2 (3), 67–80.
Kuei, C., Madu, C.N., 2001. Identifying critical success factors for supplychain qualitymanagement. Asia Pacific Manage-ment Review 6 (4), 409–423.
Kuei, C., Madu, C.N., Lin, C., Lu, M., 1997. An empirical investigation of the association between qualitymanage-ment practices and organizational climate. International Journal of QualityScience 2 (2), 121–137.
Kuei, C., Madu, C.N., Lin, C., 2001. The relationship between supplychain qualitymanagement practices and organiza-tional performance. The Internaorganiza-tional Journal of Quality& ReliabilityManagement 18 (8), 864–872.
Kuei, C., Madu, C.N., Lin, C., Chow, W.S., 2002. Developing supplychain strategies based on the surveyof supplychain qualityand technologymanagement. The International Journal of Quality& ReliabilityManagement 19 (7), 889–901.
Levy, P., 1998. Total quality management in the supply chain. In: Madu, C.N. (Ed.), Handbook of TQM. Kluwer Academic, London, pp. 275–303.
Madu, C.N., Kuei, C., Lin, C., 1995. A comparative analysis of qualitypractice in manufacturing firms in the U.S. and Taiwan. Decision Sciences 26 (5), 621–635.
Madu, C.N., Kuei, C., Jacob, R.A., 1996. An empirical assessment of the influence of qualitydimensions on organizational performance. International Journal of Pro-duction Research 34 (7), 1943–1962.
Narasimhan, R., Jayaram, J., 1998. Causal linkages in supply chain management: An exploratorystudyof North Amer-ican manufacturing firms. Decision Sciences 29 (3), 579–605. Narasimhan, R., Kim, S.W., 2001. Information system utiliza-tion strategyfor supplychain integrautiliza-tion. Journal of Business Logistics 22 (2), 51–75.
Nunnally, J., 1967. Psychometric Theory. McGraw-Hill, New York.
Ravichandran, T., Rai, A., 2000. Qualitymanagement in system development: An organizational system perspective. MIS Quarterly24 (3), 381–415.
Raykov, T., Marcoulides, G.A., 2000. A First Course in Structural Equation Modeling. Lawrence Erlbaum Associ-ates, Mahwah, NJ.
Samson, D., Terziovski, M., 1999. The relationship between total qualitymanagement practices and operational perfor-mance. Journal of Operations Management 17, 393–409. Saraph, J.V., Benson, P.G., Schroeder, R.G., 1989. An
instrument for measuring the critical factors of quality management. Decision Sciences 20 (4), 810–829.
Solis, L.E., Rao, S., Raghu-Nathan, T.S., Chen, C., Pan, S., 1998. Qualitymanagement practices and qualityresults: A comparison of manufacturing and service sectors in Taiwan. Managing Service Quality8 (1), 46–54.
Tan, K.C., 2001. A structural equation model of new product design and development. Decision Sciences 32 (2), 195–226.
Tan, K.C., Handfield, R.B., Krause, D.R., 1998. Enhancing the firm’s performance through qualityand supplybase management: An empirical study. International Journal of Production Research 36 (10), 2813–2837.
Tracey, M., Tan, C.L., 2001. Empirical analysis of supplier selection and involvement, customer satisfaction, and firm performance. The International Journal of SupplyChain Management 6 (4), 174–188.
Tracey, M.A., Vonderembse, M.A., 1998. Building supply chains: A keyto enhanced manufacturing performance. Proceedings of the Decision Science Institute, pp. 1184–1186. Vonderembse, M.A., Tracey, M., 1999. The impact of the supplier selection criteria and supplier involvement on manufacturing performance. The Journal of SupplyChain Management 35 (3), 33–39.
Wong, A., Fung, P., 1999. TQM in the construction industryin Hong Kong: A supplychain management perspective. Total QualityManagement 10 (2), 199–208.
Wong, A., Tjosvold, D., Wong, W.Y.L., Liu, C.K., 1999. Relationships for qualityimprovement in the Hong Kong– China supplychain. The International Journal of Quality and ReliabilityManagement 16 (1), 24–41.