Research on knowledge-based optimization method of indoor location based on low energy
Bluetooth
CHANG LI a, b*, Guie LI b, Yong DENGb, Tianli WANGb, and Zhizhong Kangc
a Key Laboratory for Geographical Process Analysis & Simulation, Hubei Province, Central China Normal University, Wuhan, China. ([email protected])
bCollege of Urban and Environmental Science, Central China Normal University, Wuhan, China.
cSchool of Land Science and Technology, China University of Geosciences, Xueyuan Road 29, Haidian District, Beijing 100083, China ([email protected]).
Commission IV, WG IV/5
KEY WORDS: Indoor Location; Low Energy Bluetooth; Visibility Analysis; Robust Regression Estimation; Random Sampling Consensus; Indoor 3D Map
ABSTRACT:
With the rapid development of LBS (Location-based Service), the demand for commercialization of indoor location has been increasing, but its technology is not perfect. Currently, the accuracy of indoor location, the complexity of the algorithm, and the cost of positioning are hard to be simultaneously considered and it is still restricting the determination and application of mainstream positioning technology. Therefore, this paper proposes a method of knowledge-based optimization of indoor location based on low energy Bluetooth. The main steps include: 1) The establishment and application of a priori and posterior knowledge base. 2) Primary selection of signal source. 3) Elimination of positioning gross error. 4) Accumulation of positioning knowledge. The experimental results show that the proposed algorithm can eliminate the signal source of outliers and improve the accuracy of single point positioning in the simulation data. The proposed scheme is a dynamic knowledge accumulation rather than a single positioning process. The scheme adopts cheap equipment and provides a new idea for the theory and method of indoor positioning. Moreover, the performance of the high accuracy positioning results in the simulation data shows that the scheme has a certain application value in the commercial promotion.
1. INTRODUCTION
The GNSS (Global Navigation Satellite System) outdoor positioning technology application is very mature, but GNSS in the indoor environment, the positioning effect is very unsatisfactory. In the indoor environment, due to the complex structure of the building and the indoor space of the shelter, GPS and other external signals are susceptible to interference, the traditional GPS positioning method cannot fully achieve indoor positioning.
Wireless positioning technology originated in the nineties of last century, 1992 British Cambridge University developed the Active Badge positioning system (Want,2000)which is the leader in indoor wireless positioning technology, in 1999 Cambridge laboratory developed a Bat(Harter,2002)indoor positioning system. In 2000, the Microsoft Institute proposed a radio-based Radar positioning system(Bahl,2000).In the same year, the MIT (Massachusetts Institute of Technology) developed the Cricket(Priyantha,2000)indoor positioning system: based on RF and ultrasonic TDOA(Mensing,2006) (based on arrival time difference) positioning system.
In the field of indoor positioning, there are a variety of positioning technology, including infrared (IR) indoor positioning, ultrasonic (US) indoor positioning, RFID indoor positioning, ultra-wideband (UWB) indoor positioning, WiFi indoor positioning, a very common positioning Technology - Bluetooth indoor positioning(Palumbo,2015;Pei,2010)and so on.
From the current situation, domestic and foreign scholars for the study of indoor positioning in full swing, but there are still problems that need to be improved, mainly in the following aspects: (1) lack of good positioning system (2) algorithm complex (3) the robustness of the algorithm needs to be
improved (4) the cost of positioning and the large amount of pre-work.
According to the shortcomings of the existing indoor positioning methods, this paper presents a new type of indoor positioning method based on low energy consumption of Bluetooth, the specific innovation lies in: (1) the establishment and application of knowledge base (2) step-by-step source optimization.
2. METHODOLOGY
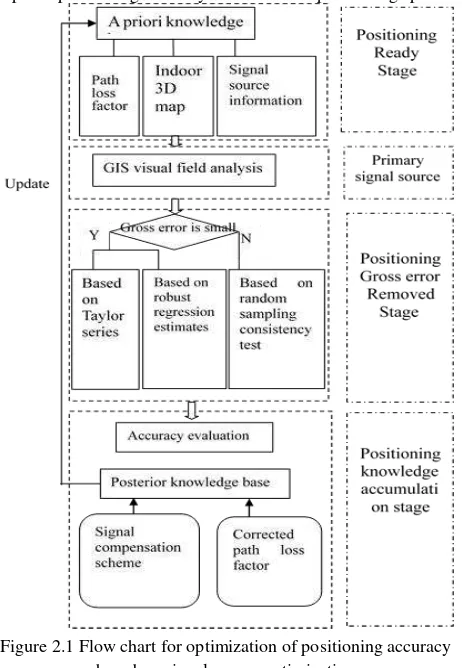
This paper mainly discusses the optimization method of spatial 3D positioning accuracy based on Bluetooth low energy (BLE) technology. The preferred technical roadmap of the step-by-step source is shown in Figure 2.1.
Based on the optimization of the positioning accuracy of the signal source, this paper mainly includes the following process: 1)Positioning preparation phase: It is mainly a priori knowledge base establishment phase, including the different path loss index search and storage, indoor three-dimensional map production and the basic situation of the Bluetooth signal test and information collection;
2)The source stage of the signal source: Combining the indoor layout planning of the Bluetooth signal source, using the indoor three-dimensional map for the visual field analysis, the signal source indoor occlusion situation and the occlusion medium to identify the primary source of the signal source;
4)Positioning knowledge accumulation stage: the stage, on the one hand, according to the positioning accuracy of the establishment of posterior knowledge base, corrects the path loss factor and develop the corresponding signal compensation scheme, on the other hand,completes the relevant knowledge base related to the update.
The process is not only a positioning process, but a dynamic knowledge accumulation process, through the non-scene, the use of different Bluetooth signal source positioning, and constantly accumulate knowledge, and ultimately to achieve the corresponding scene-related knowledge of the direct call to improve positioning accuracy and the use of positioning speed.
Figure 2.1 Flow chart for optimization of positioning accuracy based on signal source optimization
2.1 The Establishment and Application of Transcendental Knowledge Base
The contents of the prior knowledge base mainly include the work should be completed before the actual positioning begins: (1) Path loss factor for different media
The path loss factor for the same Bluetooth source is different for different indoor scenarios. Need to obtain a more accurate loss factor in order to better estimate the signal source to the positioning point of the distance.
(2) Interior Scene 3D Map
Indoor map ,on the one hand, the visual field analysis ,the occlusion of the indoor scene are judged for indoor scenes and the choice of path loss factor can be made, on the other hand , constraints can be formulated according to the actual range positioning range of indoor scenes, in other words, to restrain indoor space and road network.
(3) The basic information of the Bluetooth signal source
Bluetooth signal source of different models, the corresponding signal fluctuations, 1 meter at the signal strength, battery life, etc. are different, so need to save the Bluetooth information.
2.2 Establishment and Application of Posterior Knowledge Base
The posterior knowledge base mainly stores the information obtained in the positioning phase to improve the positioning accuracy:
(1) Signal compensation
There is a certain degree of fluctuations in the Bluetooth signal source, a sectional compensation can be made to Bluetooth signal source from the results in testing it, thereby improving the positioning accuracy. In the actual positioning process can also be based on positioning results for timely updates and correction.
(2) Path loss coefficient correction
The initial location uses the signal path loss factor in the prior knowledge base, but because of the thickness and material properties of the occlusion medium in the actual scene, the loss coefficient has a certain degree of deviation. In the actual positioning process, through a number of positioning information on the path loss coefficient to a certain degree of correction.
A priori knowledge base and posterior knowledge base are all dynamic update library, will be based on the positioning of different scenarios for the relevant information updates and orderly storage. With the application of the positioning scheme, the contents of the knowledge base are increasing, and the basic information of similar scenes can be directly invoked in the subsequent positioning process, thus improving the positioning accuracy and positioning speed to a certain extent, and realize the optimization of positioning accuracy under knowledge guidance.
2.3 Signal source primaries - GIS visual field analysis The most important factor affecting the accuracy of indoor positioning is the non-line-of-sight propagation of the signal. The visual field analysis can be used to select the unshielded signal source for the positioning calculation. Moreover, if the partial occlusion signal source must participate in the calculation, the domain analysis determines what material the obstruction is blocking the source, thus selecting the appropriate path loss index. The 3D Analyst tool in ArcGIS can handle the processing of visual field analysis.
(1) Visual analysis
Visual analysis refers to a straight line between two points on the surface that can be used to determine whether the straight line between the signal source and the mobile terminal is visible. (2)Point of view analysis
Viewpoint analysis is the observation point (signal source) that can be seen when the indoor map surface (raster data) is viewed. Applied to the indoor location study, it can be used to determine how many areas of each signal source is visible.
(3) Field of view analysis
source can be used to judge the visual field, so as to better determine the installation position of the signal source, reduce the occlusion of the obstacle, and utilize the Bluetooth signal source to a greater extent. After the primary source of the signal source is completed, three different solving algorithms are selected according to the size of the initial difference.
2.4 Three - dimensional localization method
(1)Indoor Location Algorithm Based on Taylor series:this paper, the main RSSI estimation method is used to solve the position, that is, according to the RSSI value at the anchor point, the distance between signal source (the location of the signal source is known) and the location points will be estimated, logarithmic distance path loss model is mainly used to solve the distance. First, according to the indoor map to establish the appropriate coordinate system, and set the target coordinates (x, y, z), the coordinates of the Bluetooth signal source are (xi, yi, zi) (i = 1, 2, 3, 4 ... n), the distance from the Bluetooth signal source to the target estimated by RSSI is di (i = 1, 2, 3 , 4 ... n) . The following formula will be got:
2 2 2 2 overdetermined nonlinear equations are usually of low accuracy and poor positioning accuracy. To this end, this paper uses the Taylor series expansion to linearize the solution of the target position, and then iterates iteratively until the solution to be set can be reached. The method of 3D location algorithm based on Taylor series is essentially a combination of Taylor series and least square. It can make full use of all the available information of the available signal sources. Generally, the algorithm can achieve better localization accuracy for the location with less range estimation error.
(2)Indoor Location Algorithm Based on Robust Regression Estimation: In the case of large distance estimation error, the three-dimensional positioning method based on Taylor series is difficult to take accurate positioning. Robust regression estimation refers to that when there is gross in the date ,it still can ensure that the regression parameters can be close to the optimal solution, the algorithm can compensate for the least squares estimation method with robust ability, which belong to a kind of method for maximum likelihood estimation. The algorithm has a certain ability to resist, eliminate the gross error, its advantages are more obvious.
(3)Indoor Location Algorithm Based on Random Sampling Consistency Test: For the data with a large number of gross errors, this paper introduces the random sampling consistency test to remove the gross error data, and combined with the localization algorithm based on Taylor series, together constitute the indoor location algorithm based on random sampling consistency check. This paper chooses the RANSAC (Random Sampling Consensus) (Fischler,1987) algorithm proposed by Fishler and Bolles, the indoor positioning algorithm based on random sampling consistency test has a good ability to identify and eliminate coarse data.
3. EXPERIMENT ANALYSIS
3.1 Simulation environment
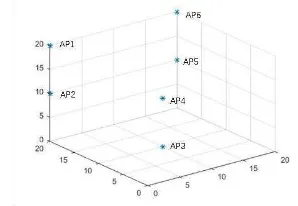
In order to compare and analyze the localization performance of each algorithm, this paper uses Matlab 2015a version as the realization and simulation software of the algorithm. By changing the corresponding conditions, the indoor location algorithm based on Taylor series, the indoor location algorithm based on robust regression estimation and the indoor location algorithm based on random sampling consistency test are simulated and compared, so as to evaluate the positioning performance of the three algorithms. In this paper, the simulation experiment simulates an indoor environment area with an aspect height of 20m * 20m * 20m. Six Bluetooth signal sources are simulated at any location in the area, simulation environment and the distribution of the signal source shown in Figure 1. The simulated coordinate position distribution of the Bluetooth signal source is shown in Table 1.
Figure 1 Simulation of the experimental environment and simulation of Bluetooth signal source distribution
Analog
Table 1 Analog Coordinate of Bluetooth Source 3.2 Simulation results analysis
For the localization of the real scene, the main factors that affect the accuracy of the indoor positioning are the deviation of the distance estimation of the Bluetooth signal source to the positioning mobile terminal, which leads to the error of the positioning solution. And combined with the indoor scene shows that some of the line of sight signal transmission distance calculation is relatively accurate, there is occlusion or room there are other factors of interference, the distance estimation there will be a big error. Therefore, in the simulation experiment, this paper evaluates the applicability and stability of the algorithm and the calculation speed by changing the gross error of the data. In the process of algorithm simulation, this paper mainly divides it into two kinds of cases to evaluate the algorithm.
(1)Positioning results and analysis of partial data containing errors
mobile terminals. In the absence of errors, the distance from the six analog signals to the mobile terminal is represented by vector D. In this calculation, this paper first calculates the data without error, containing an error data, containing two error data, containing three error data (the error sizes of each case are the same, and the items of the errors are the same). The results of the three algorithms are compared, it should be noted that the results of each set of algorithms are repeated several times to ensure that the accuracy of the experimental results, especially the running time, the results shown in the following table:
algorithm Interior Location Algorithm Based on Taylor Series
Measurement index Solve coordinates Running time RMSE
Without error ͧ20.0,20.0,0ͨ 0.0143s 0
1 error (18.9,20.3,-1.3) 0.0146s 1.7
2 errors ͧ19.0,21.7,-1.0ͨ 0.0148s 2.2
3 errors (18.8,23.2,-1.1) 0.0148s 3.6
algorithm Indoor Location Algorithm Based on Robust
Regression Estimation
Measurement index Solve coordinates Running time RMSE
Without error ͧ20.0,20.0,0ͨ 0.0373s 0
1 error (20.0,20.0,0) 0.0382s 0
2 errors (19.8,22.8,0) 0.0388s 2.8
3 errors (17.9,23.9,-1.5) 0.0385s 4.7
algorithm Indoor Location Algorithm Based on Random Sampling Consistency Test
Measurement index Solve coordinates Running time RMSE
Without error (20.0,20.0,0) 0.0638s 0
1 error (20.0,20.0,0) 0.0642s 0
2 errors (20.0,20.0,0) 0.0648s 0
3 errors (19.8,23.0,0.1) 0.0638s 3.0
Table 2 Three algorithm simulation positioning results From the simulation results, we can see that the results of the three algorithms are not different if there is no error. However, considering the complexity of the algorithm, the three-dimensional positioning method based on the Taylor series is given priority. The corresponding algorithm has the shortest run time, which is 38% of the time of the indoor localization algorithm based on robust regression estimation and 22% of the time of indoor positioning algorithm based on random sampling consistency test. It can be seen that this algorithm has a greater advantage in this case; when the data contains an error situation, the indoor positioning algorithm based on robust regression estimation shows a better advantage, high positioning accuracy and shorter running time. If the data contains two or three errors, the indoor positioning algorithm based on the random sampling consistency test is more advantageous, the positioning accuracy is better than the other two algorithms, the algorithm running time is also within the acceptable range. This article does not proceed with tests on data of more than half of the larger errors in the six sets of data, because for any algorithm, if the number of large error data exceeds 50%, it is difficult to obtain a better result.
(2)The positioning results and analysis of all data containing errors
In the actual indoor positioning, the data contains the error is normal because of the impact of various factors affecting the indoor positioning, but excluding other great extreme impacts, the errors in the data are generally relatively small. Therefore, In the simulation experiment, we add the noise to the data by
the randn function in Matlab, that is, we will get the Gauss random sequence (white noise sequence) with a mean value of 0 and a variance of 1. We add it randomly to the distance vector D to simulate the movement and the terminal coordinates are still (20, 20, 0), then test three algorithms.
It is clear from the results in Table 3 and Table 4 that the positioning algorithm based on robust regression estimation and the localization algorithm based on random sampling consistency test can achieve a better positioning effect when all data contain errors, and the positioning accuracy of both is almost same, the only difference between the two is the algorithm of computing time. Under the same conditions, due to robust regression estimation based on the positioning algorithm calculation time shorter than the latter, so, priority is given to it to deal with the data.
algorithm Interior Location Algorithm Based on Taylor Series
Measurement
algorithm Indoor Location Algorithm Based on Robust
Regression Estimation
algorithm Indoor Location Algorithm Based on Random Sampling Consistency Test
Consistency Test
Table 4 Comparison of three algorithms for test data Gaussian noise
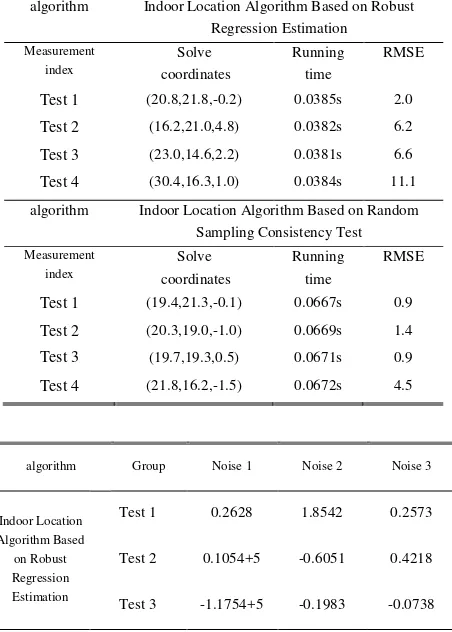
In order to better compare the applicability of the latter two algorithms, this paper changes the simulation experiment conditions to test the stability and applicability of the algorithm. The results are shown in the following table:
algorithm Indoor Location Algorithm Based on Robust
Regression Estimation
algorithm Indoor Location Algorithm Based on Random
Sampling Consistency Test
Table 5 Two algorithms simulate positioning results (add noise in the data)
Description: The bold font in the table indicates the artificially added new noise.
The simulation results shown in tables 5 and 6 can be analyzed in conjunction with tables 3 and 4: the positioning algorithm based on robust regression estimation has a certain ability to resist, but if the error of the data is large, the positioning accuracy of the algorithm will decrease. The positioning algorithm based on random sampling consistency test can still have good positioning accuracy when the data error is large, but the running time of this algorithm is longer than that of the former.
In this paper, we can see that the three-dimensional positioning algorithm based on the Taylor series has better positioning accuracy and the running time is better than the other two algorithms when the data error is small or does not contain the error. When the data contains errors but the error is not too large, the localization algorithm based on robust regression estimation is preferred because of its high positioning accuracy. When the data contains several (generally less than 50% of the total amount of data) large error data, the random sampling based consistency check algorithm is the most ideal positioning algorithm selection. It is undeniable that each algorithm has its own unique advantages and shortcomings. How to locate the algorithm in positioning needs to grasp the characteristics of the data as a whole, so as to obtain the ideal positioning effect with high positioning precision and fast running speed.
4. CONCLUSION
on positioning (2) step-by-step signal source optimization and positioning algorithm optimization, improve the efficiency of the use of the signal source and improve the positioning accuracy. The simulation results show that the latter two algorithms can optimize the data from the perspective of data error distribution, so that the ideal positioning effect can be obtained.
The positioning scheme proposed in this paper can achieve better positioning effect in the ideal state, but it is necessary to further improve and study the aspects that need to be promoted until there is some need to be promoted.
(1) the realization of the positioning program module, this paper is the study of the whole process of the program, the latter need to be assembled into the corresponding module of the corresponding positioning system, so that can be independently run on smart phones, high-precision real-time positioning The (2) In order to better eliminate the impact of Bluetooth signal fluctuations, the follow-up need to obtain more Bluetooth signal data on the source of quality assessment, the
development of more detailed signal compensation program. (3) in the follow-up study can be considered to join the smart phone gyroscope, accelerometer and other combination of positioning; and at the same time consider the positioning side to achieve three-dimensional map display, to the user a more realistic experience to meet the timelier positioning needs and direction to identify.
ACKNOWLEDGEMENTS (OPTIONAL)
The authors thank National Natural Science Foundation of China (NSFC) (grant nos. 41101407), the Natural Science Foundation of Hubei Province (grant nos. 2014CFB377 and 2010CDZ005), China, and the self-determined research funds of CCNU from the colleges’ basic research and operation of MOE (grant no. CCNU15A02001) for supporting this work, Wuhan Youth Science and technology plan (grant no. 2016070204010137) and the National undergraduate training programs for innovation and entrepreneurship (grant no. B2015007). We are grateful for the comments and contributions of the anonymous reviewers and the members of the editorial team.
REFERENCES
Bahl P, Padmanabhan V N. RADAR: an in-building RF-based user location and tracking system; proceedings of the Institute of Electrical & Electronics Engineers Inc, F, 2000 [C].
Fischler M A, Bolles R C. Random sample consensus: a paradigm for model fitting with applications to image analysis and automated cartography [M]. Morgan Kaufmann Publishers Inc., 1987.
Harter A, Hopper A, Steggles P, et al. The Anatomy of a Context-Aware Application [J]. Wireless Networks, 2002, 8(2): 187-197.
Mensing C, Plass S. Positioning Algorithms for Cellular Networks Using TDOA; proceedings of the IEEE International Conference on Acoustics Speech and Signal Processing Proceedings, F, 2006 [C].
Palumbo F, Barsocchi P, Chessa S, et al. A stigmergic approach to indoor localization using Bluetooth Low Energy beacons; proceedings of the IEEE International Conference on Advanced Video and Signal Based Surveillance, F, 2015 [C].
Pei L, Chen R, Liu J, et al. Inquiry-Based Bluetooth Indoor Positioning via RSSI Probability Distributions; proceedings of the International Conference on Advances in Satellite & Space Communications, F, 2010 [C].
Priyantha N, Chakraborty A, Balakrishnan H. The Cricket location-support system; proceedings of the International Conference on Mobile Computing and NETWORKING, F, 2000 [C].